
Business surveys are running hot. The US ISM Manufacturing index printed 54.5% in September 2026, and the 10-year Treasury yield recently closed at its highest level since 2007. Yet a quieter gauge, the global liquidity cycle, has been losing momentum since around Q3 2025. If you take strong economic data as a green light for markets, that gap deserves your attention.
The puzzle is that liquidity is not low. By the estimates of Michael Howell of CrossBorder Capital, the global pool sits somewhere around US$190-200 trillion, close to historic highs. What has changed is its growth rate, and that has turned down.
This matters because the real economy tends to trail the funding conditions that move asset prices. If you watch only jobs, factory output and spending, you are reading a signal that is often more than a year behind the one markets respond to.
Here is a working framework for judging where the cycle sits and what it could mean for your equities, bonds, credit and commodities. You will also see where the framework can break down.
What is the global liquidity cycle and why does it lead the economy?
Why would money conditions move before people spend, hire and build? The answer sits in how the financial system refinances itself.
Global liquidity is the total capacity of the world’s financial system to lend and fund. Howell defines it as the stock and flow of balance-sheet capacity and funding across world markets, tracking cross-border capital flows and credit linked to central banks. It is broader than money supply, which counts only cash and bank deposits.
In a March 2026 interview with FNArena, Howell argued that “liquidity moves markets” because it refinances the world’s enormous stock of debt. When funding is plentiful, borrowers roll over their loans easily. When it tightens, that rollover gets harder.
How the lead-lag works in practice
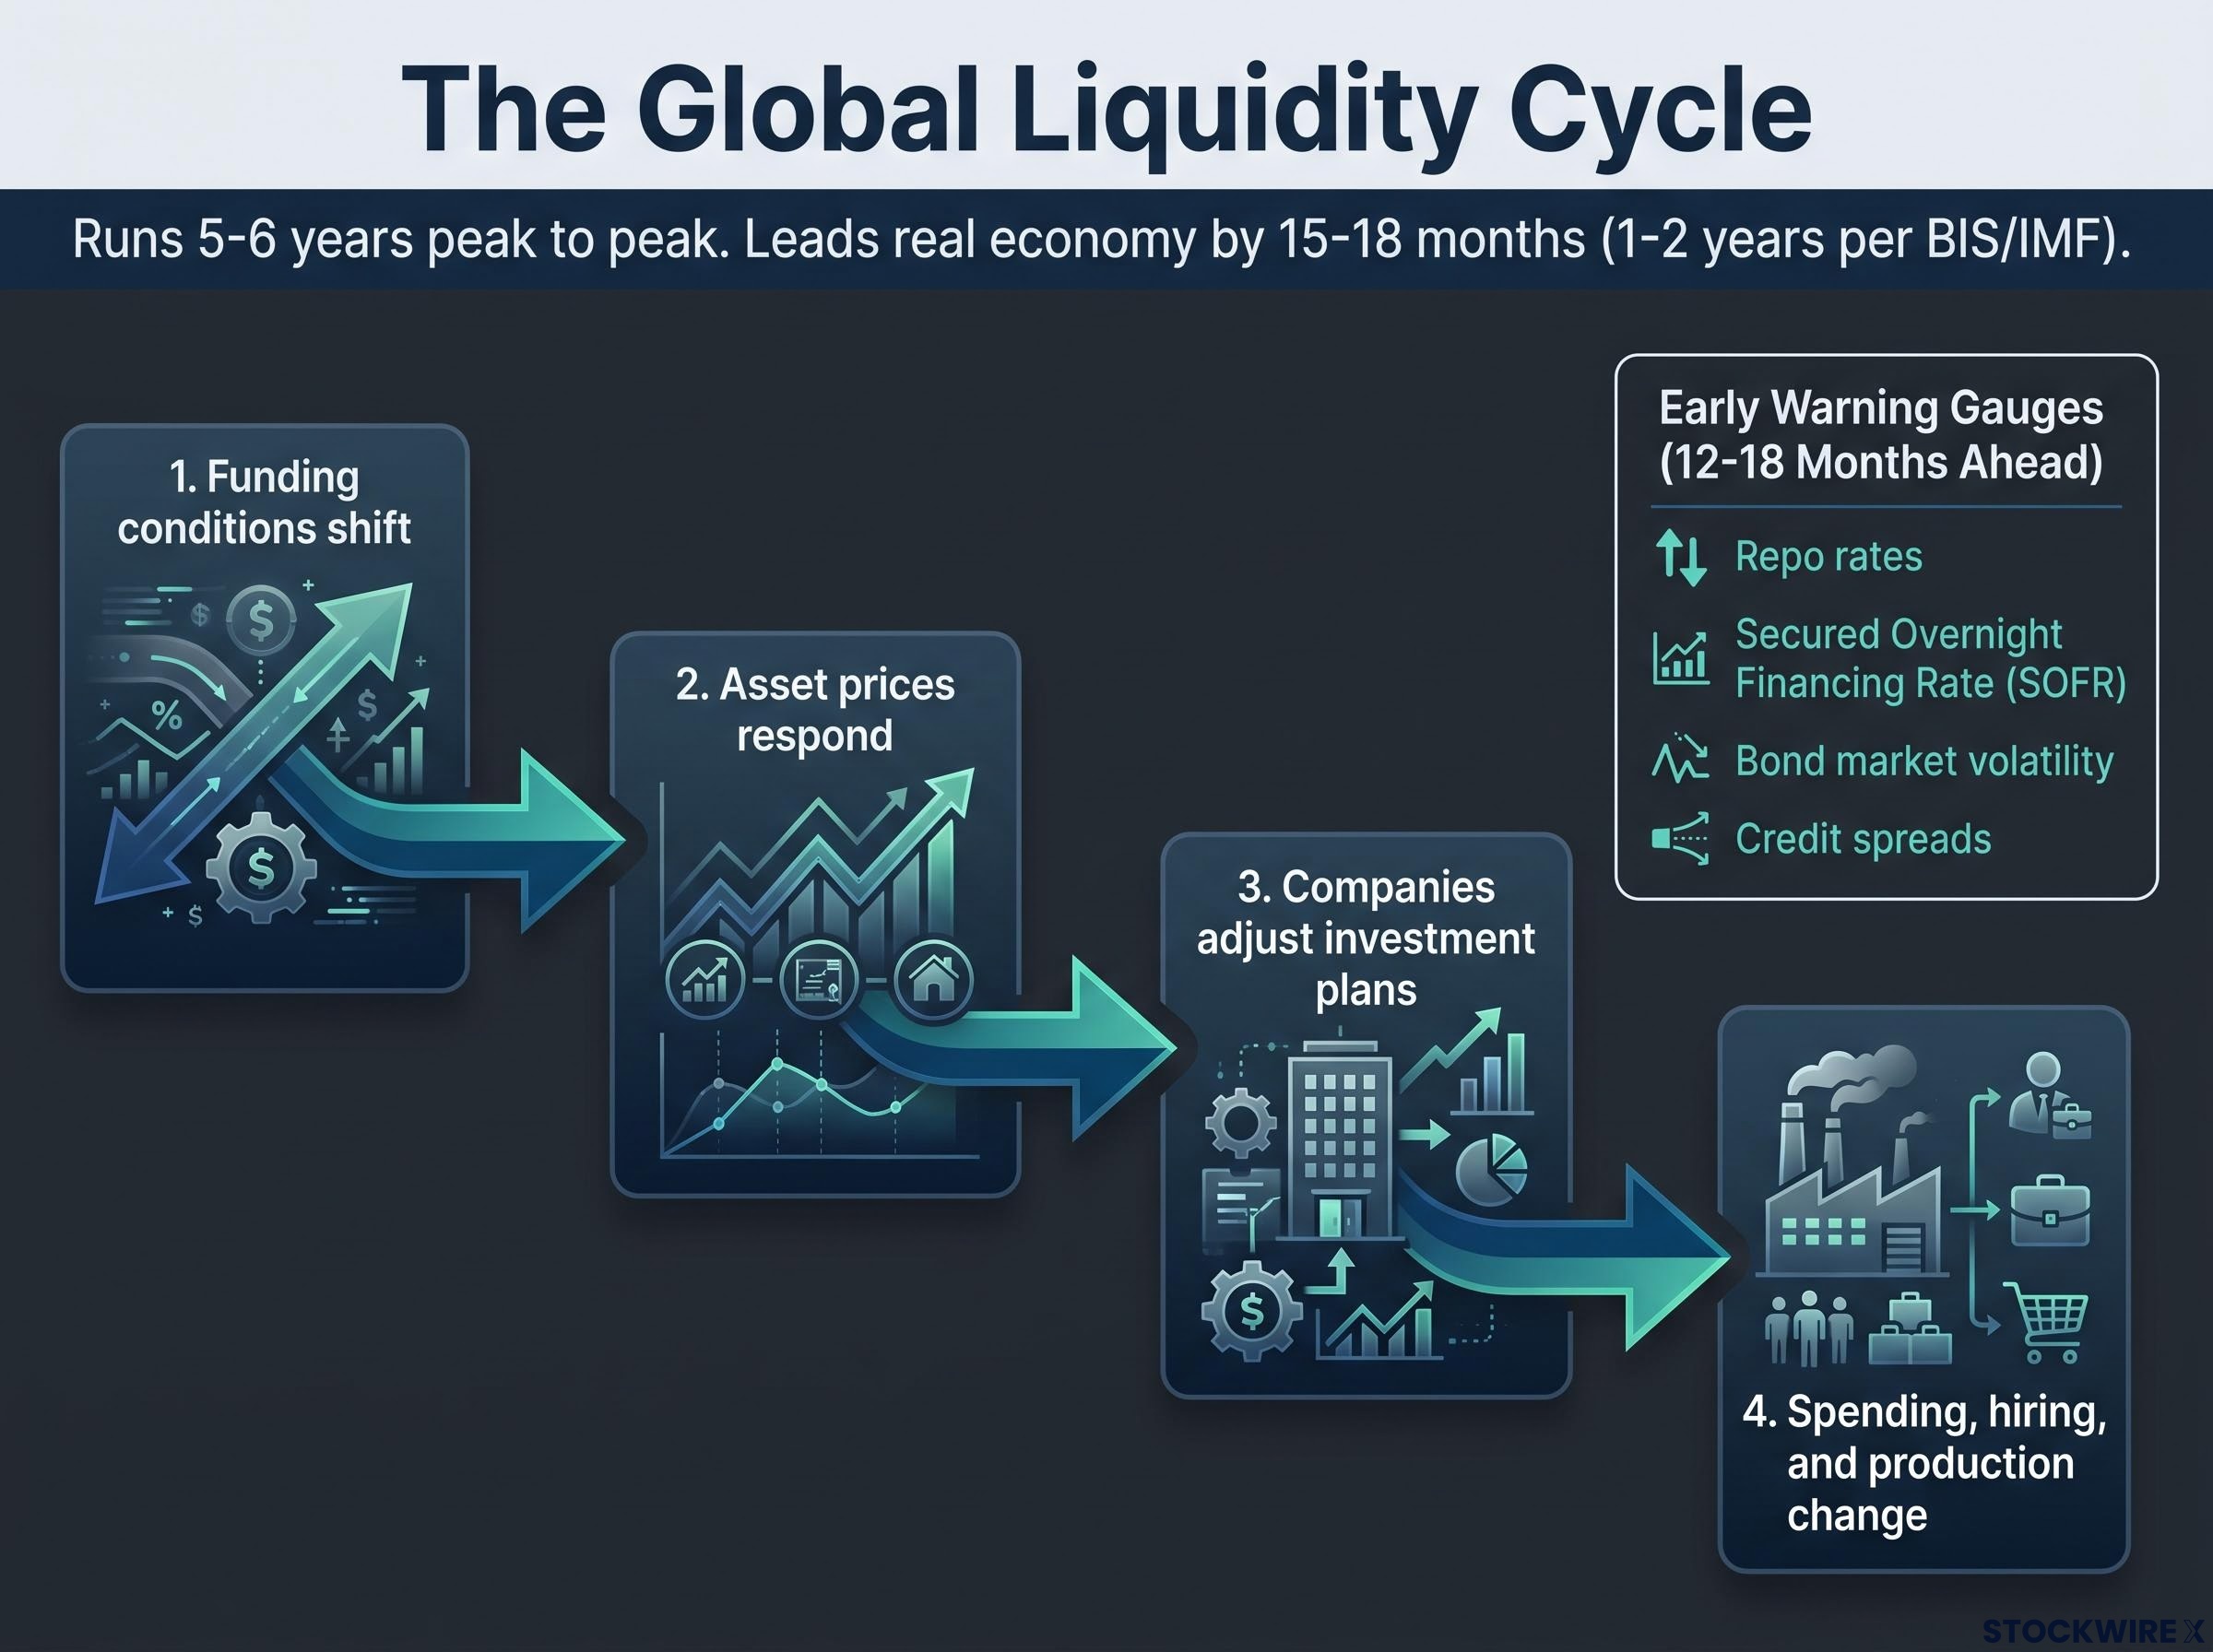
Howell’s cycle runs roughly 5-6 years from peak to peak, and it leads the real-economy cycle by about 15-18 months. That lead means the two often move in opposite directions at any given moment.
The sequence runs like this: funding conditions shift first, asset prices respond, companies adjust investment plans, and only later does the change appear in spending, hiring and production. Research from the Bank for International Settlements (BIS) and the International Monetary Fund (IMF) points the same way, finding that credit supply, dealer balance sheets and central bank balance sheets tend to lead real activity by roughly 1-2 years.
The sequence you see here echoes the idea of long and variable lags: policy and funding shifts take well over a year to reach spending, hiring and production, which is why strong current data tells you little about what comes next.
Practitioners use a rule of thumb to anticipate turning points 12-18 months ahead. Howell’s preferred early-warning gauges include:
- Repo rates, the cost of short-term borrowing secured against bonds
- The Secured Overnight Financing Rate (SOFR), a benchmark for overnight dollar funding
- Bond market volatility
- Credit spreads, the extra yield investors demand to lend to companies over governments
Three episodes that fit the pattern
| Episode | Liquidity move | What assets did | Real-economy timing | Lesson |
|---|---|---|---|---|
| 2008-09 | Interbank funding and securitisation collapsed | Equities, credit and commodities fell; quality bonds and cash outperformed | Funding broke before the deepest recession phase | Funding stress shows first |
| 2020-21 | Central banks expanded balance sheets rapidly | Equities, credit and many commodities rallied | Economy still recovering as assets surged | Liquidity led gains by several quarters |
| 2022 | Momentum turned down as rates rose | Equities de-rated, spreads widened, yields jumped | Nominal growth and inflation still high | Strong data can mask turning liquidity |
The 2022 sequence is the one Howell maps most closely onto today. For you, the takeaway is that a strong economic print says little about where asset prices are heading. The funding signal from 12-18 months ago is the better guide.
When big ASX news breaks, our subscribers know first
Why is liquidity slowing while the economy accelerates?
Hold three facts together for a moment. Liquidity is near a record, its momentum is fading, and the economy is running hot. It looks contradictory until you see that the boom itself is doing the draining.
Level versus momentum
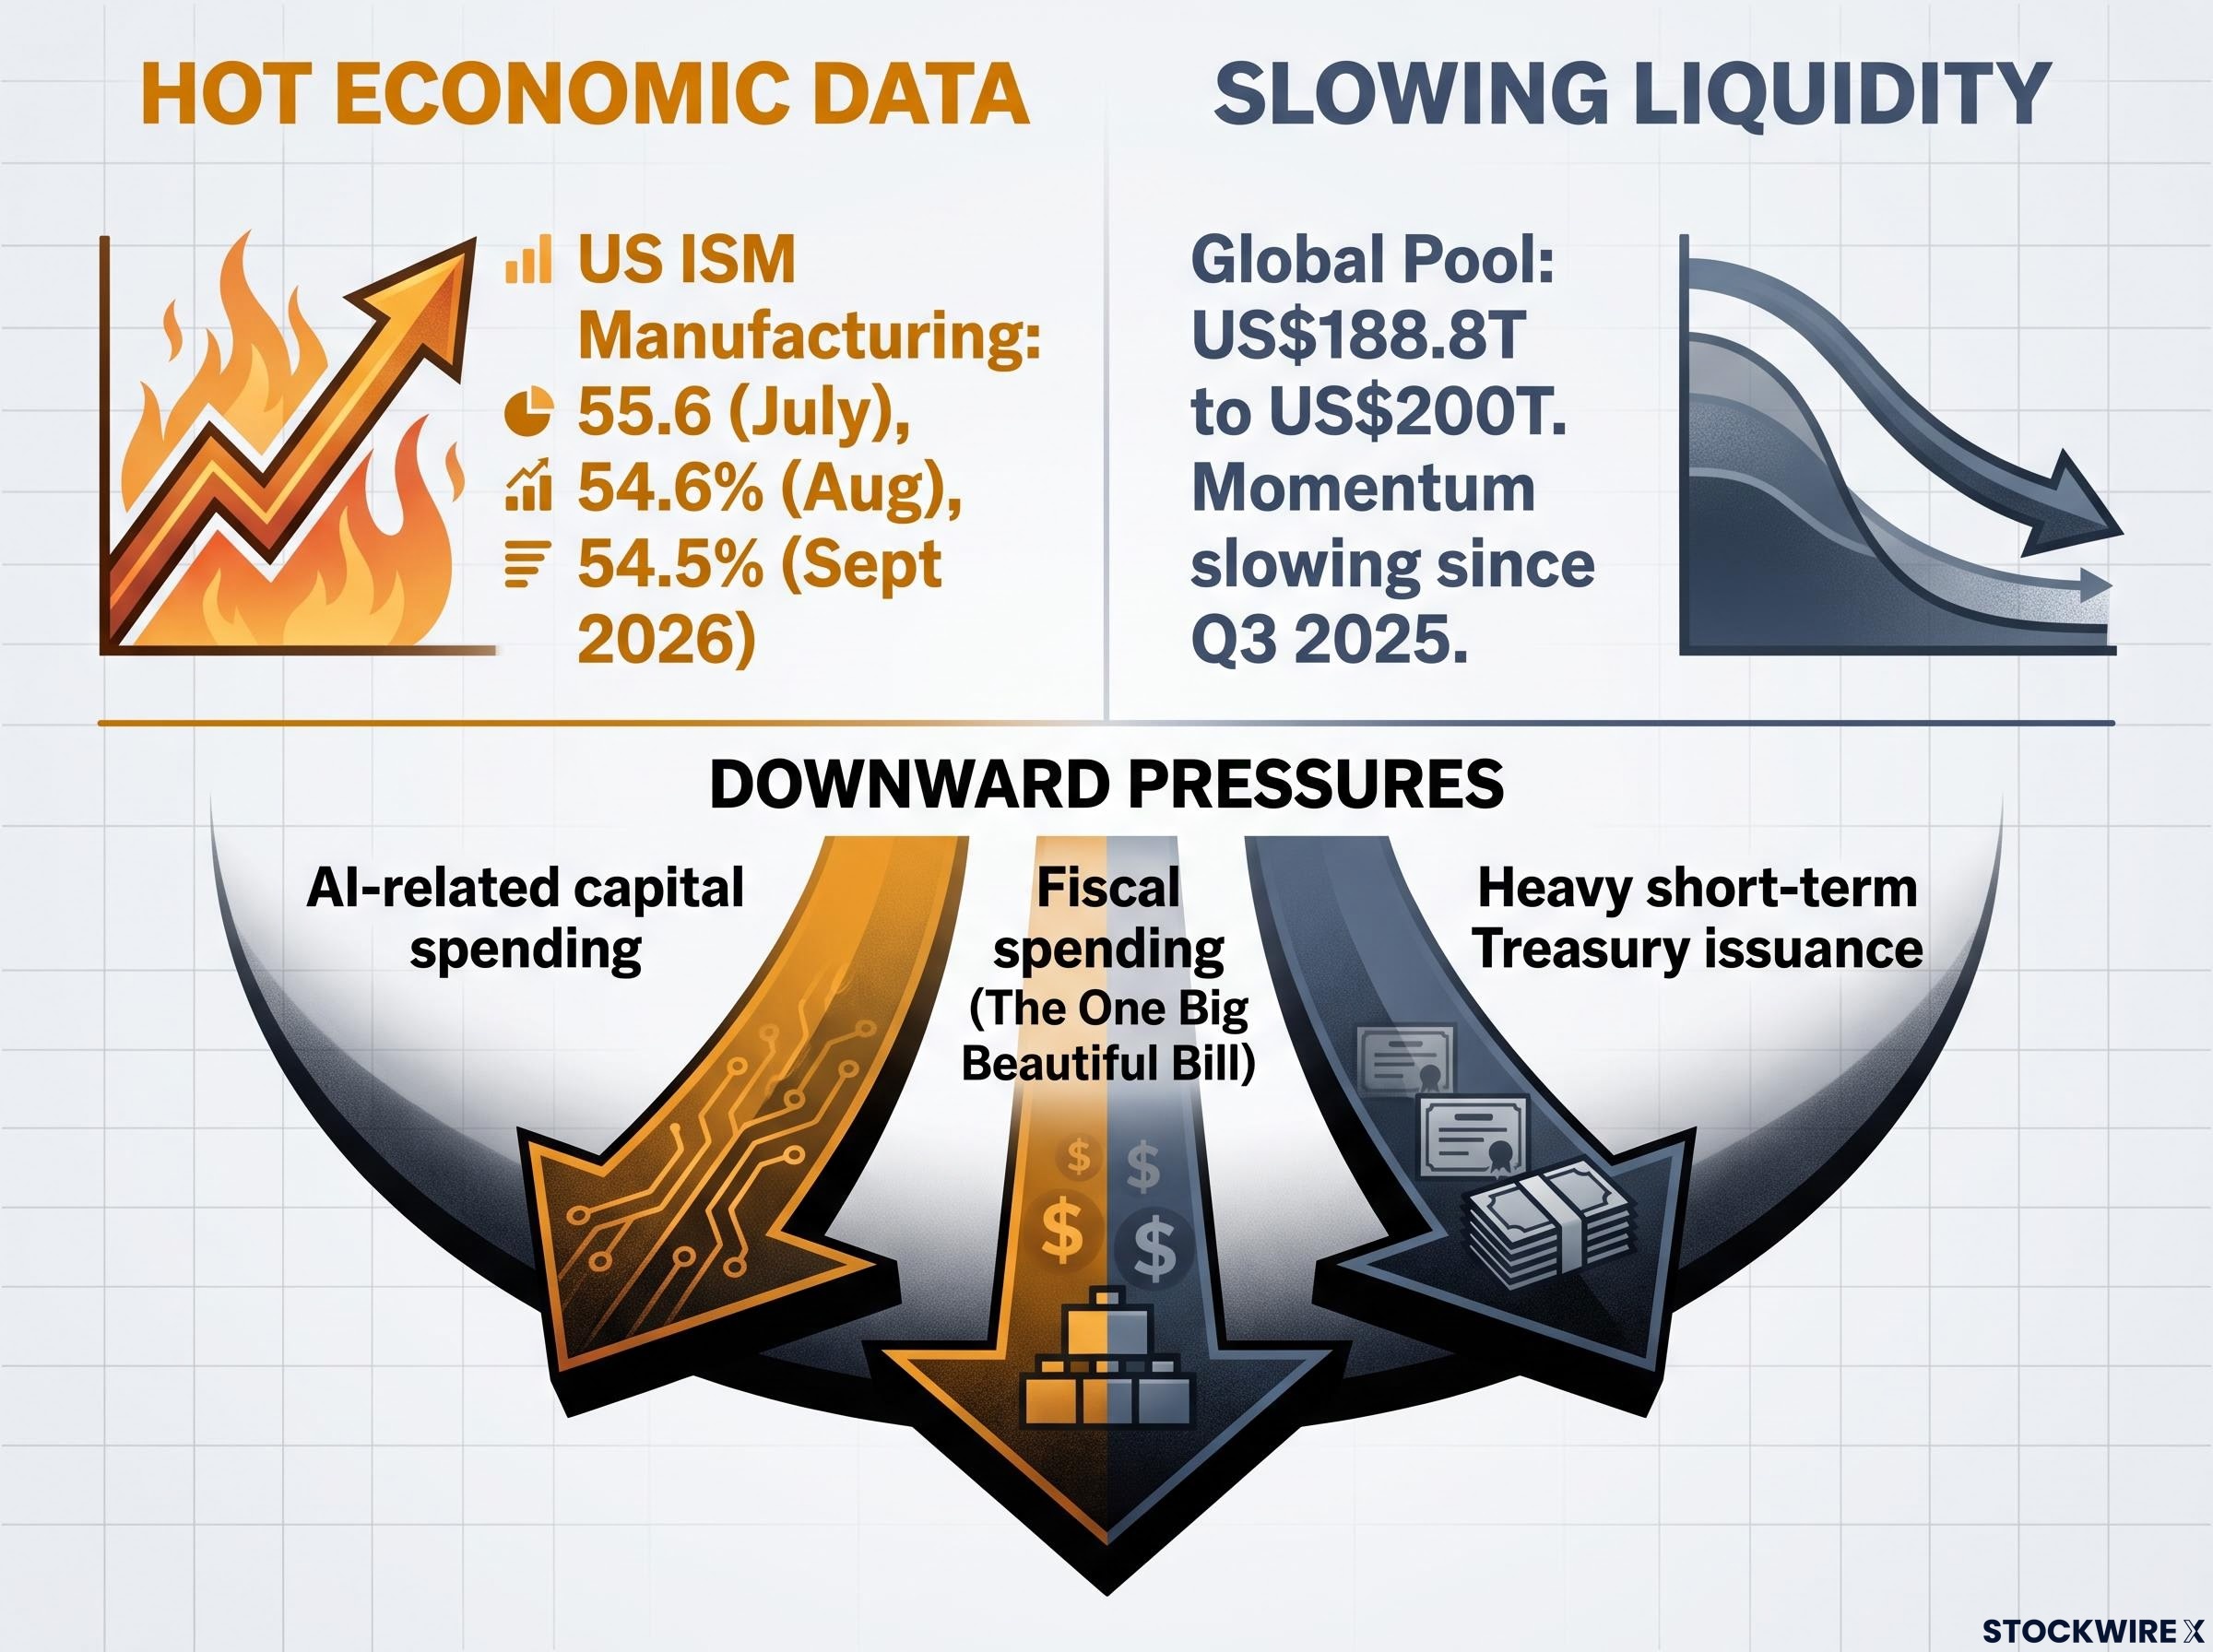
The level and the direction are separate readings. Howell’s estimates put the pool near US$190-200 trillion, but growth peaked around Q3 2025, followed by several months of outright declines and then a flat stretch.
Even the level is contested. TFTC reported a peak of US$188.8 trillion in late February 2026, while FNArena quoted Howell a month later saying the pool was “touching US$200trn”. Both agree on the direction. The gap shows how sensitive these composite measures are to method, so treat any single figure as an estimate.
Howell’s weighted index of about 20 global business surveys tends to move inversely to liquidity, and it is accelerating. The ISM reading of 54.5% in September followed 54.6% in August, and PNC data show the index hit 55.6 in July, a four-year high.
So what is pulling money away? Howell argues central bank tightening is a secondary factor. The main cause is a strong real economy competing with financial assets for capital through three channels:
- AI-related capital spending, which absorbs funds into physical investment
- Fiscal spending, including the “One Big Beautiful Bill”
- Heavy short-term Treasury issuance, which soaks up cash that might otherwise sit in markets
By August 2026, CrossBorder notes described liquidity as “broadly flat” and conditions as “supportive but no longer improving”. Howell added a warning worth keeping in mind:
Howell’s caution Do not confuse a temporary reopening of “the money taps” with the start of a new global liquidity cycle.
Commodities tell the same story. Some commodity indexes are up 40-45% year to date. Howell suggests the slowdown could stretch into 2027, a view he holds with uncertainty.
What this means for you: treat strength in the data as a possible late-cycle signal, not an all-clear. The same strength is absorbing the liquidity that has supported asset prices.
Heavy short-term Treasury bill issuance works much like QE outside the central bank, since commercial banks absorb the bills and money is created, even as it drains cash that might otherwise support markets.
What do Treasury yields, the Fed and the dollar say about the cycle?
The market signals are loud. The harder part is deciding what they mean.
Yields and the Fed
On 16 September 2026, the Federal Reserve raised its target range by 25 basis points to 3.75-4.00%, its first hike since 2023. The 10-year yield closed near 5.01% that day, its highest since 2007, and Schwab noted it was up roughly 80 basis points year to date.
Howell describes Fed chair Kevin Warsh as tightening at a slow, half-hearted pace, arguing that “capital wars” between the US and China make aggressive hikes unlikely. In his reading, US bond yields track four-year nominal GDP growth, and the 2-year yield leads the policy rate. Flat term premia in the US and Germany suggest investors have not lost confidence. Term premium is the extra return investors demand for holding longer-dated bonds instead of rolling shorter ones.
Two ways to read the same move
| Question | Growth signal reading | Fiscal and liquidity stress reading |
|---|---|---|
| What rising yields mean | Stronger nominal growth | Refinancing pressure and debt worries |
| Term premia | Flat (US, Germany) | Rising (France, Sweden, UK, Japan) |
| Dollar implication | Structurally firm | Vulnerable to debt and potential QE |
| What to watch | 2-year yield, ISM direction | Repo, SOFR, bond volatility, credit spreads |
The stress camp, including many bank strategists, points to US debt of about US$40.3 trillion in early October 2026, set against an estimated asset base of around US$600 trillion. Howell himself warns that with debt this large, funding markets matter more than the policy rate.
The dollar question
Howell sees the dollar as structurally firm, supported by high real yields, strong nominal growth and demand for dollar funding. He views the euro as structurally weak and calls the yen “a coin toss”. The counter-view holds that debt and possible quantitative easing (QE), where central banks buy bonds to inject money, could push investors toward gold and non-US assets.
The Reserve Bank of Australia has begun hiking. The point for you is that a rising 10-year yield does not explain itself. Whether it reflects growth or stress decides if long-dated bonds act as a refuge or a risk in your portfolio.
How could the framework shape an allocation, and where can it fail?
A framework earns its place when you can apply it. It earns your trust when you know its limits.
Where Howell places the cycle
Howell puts markets between the speculation and turbulence phases. His rule: bonds draw returns from the liquidity cycle, commodities from the real-economy cycle, and equities from both. Supporting signs include world price-to-earnings multiples contracting while AI earnings hold up, weakness in Australia and the Russell 2000, and widening spreads on junk and hybrid corporate debt.
For 2027, he expects US growth to slow without a recession, with yields easing as money flows toward the dollar and Treasuries.
Widening spreads on junk and hybrid debt are among the credit stress signals that tend to surface before the wider economy shows strain, including distressed debt exchanges and tightening bank lending standards.
Applying it to a portfolio
| Asset class | Cycle driver | Howell’s stance | Main risk to stance |
|---|---|---|---|
| Equities | Both cycles | Defensive, quality | Can still de-rate if yields rise sharply |
| Bonds/Treasuries | Liquidity cycle | Increasing; park cash short term | Yields stay high if fiscal stress dominates |
| Credit | Liquidity cycle | Minimal | Misses carry if defaults stay low |
| Commodities and gold | Real-economy cycle | Commodity core; gold and bitcoin long term, buy dips | Volatile; may lag in a soft landing |
For Australian investors, FNArena and the Indian Sun suggest resource stocks and cyclicals carry more exposure to global funding swings, while defensive income names and quality industrials may hold up better. This is one analyst’s view, not a recommendation. Instead of copying it, run a four-step check on your own holdings:
- Is liquidity momentum rising, flat or falling?
- Are business surveys and earnings still accelerating?
- Are credit spreads, repo and SOFR calm?
- Which of your holdings depend on easy funding to justify their price?
Where the framework can fail
- Measurement risk: composite liquidity indexes are opaque and vary by provider, as the US$188.8 trillion versus US$200 trillion gap shows.
- Regime change: fiscal dominance or an AI investment boom could weaken the 5-6 year cycle or the 15-18 month lead.
- Forecasting misses: markets have rallied through slowing liquidity when QE, fiscal stimulus or regulatory relief offset private tightening.
Past performance does not guarantee future results, and these forward-looking views are speculative and subject to change.
Reading the cycle without overcommitting to it
The through-line is simple. Liquidity remains high, its momentum has turned, and the real economy has not yet caught up. If the lead-lag logic holds, vulnerability builds quietly in leveraged credit and long-duration assets before it shows in the data.
Your practical task is to track a short list of signals: liquidity momentum, the 2-year yield, repo and SOFR, credit spreads and the direction of the ISM. Use the framework as a lens for testing your exposure, not a timetable for trading.
2027 is where Howell’s view faces its real test, with his expectation of slower growth and easing yields. Keep in mind that the 15-18 month lead is a historical tendency, and it may not repeat this time.
This article is for informational purposes only and should not be considered financial advice. Investors should conduct their own research and consult with financial professionals before making investment decisions.