Brent crude is sitting just below US$117 a barrel and the US 10-year Treasury yield is brushing 5%. Those two numbers connect the week’s biggest stories: whether Australian borrowers face another rate hike, and whether Big Tech can keep funding its artificial intelligence (AI) build-out without unsettling credit markets.
For investors, the week ahead is a convergence point. Oil is lifting inflation expectations. Meta fell about 7% on 22 October after showing investors it is spending more cash than it generates. The Reserve Bank of Australia (RBA) is close to a coin toss ahead of its 3 November Melbourne Cup Day decision.
The 28 October Australian CPI print sits between those forces and feeds straight into the RBA’s call. These are not separate headlines. Each one changes how the others are likely to be read.
Here is a map of the data points and company disclosures that matter most, and how to read them for your ASX holdings, your mortgage and your wider portfolio.
Why last week’s rotation and Meta’s drop set the tone for the week ahead
On the surface, last week looked like a shrug. The S&P 500 slipped 0.5%, the Nasdaq Composite lost 0.7% and the Dow added 0.4%. The headline moves hid a sharp rotation, and a Friday that did most of the damage to tech.
| Index/Item | Weekly move | Note |
|---|---|---|
| S&P 500 | -0.5% | Mixed week, rotation beneath the surface |
| Nasdaq Composite | -0.7% | Fell 2.6% on Friday alone |
| Dow Jones | +0.4% | Held up better than tech-heavy indices |
| Communication services | -5.5% | Meta -9.4%, Google -5.9% |
| Healthcare | +1.9% | Defensive rotation |
| Brent crude | Up more than 6% | Just below US$117 |
| US 10-year yield | Near 5% | Around 4.96-4.99% |
Money left communication services and moved into healthcare and energy. Meta’s result explains why.
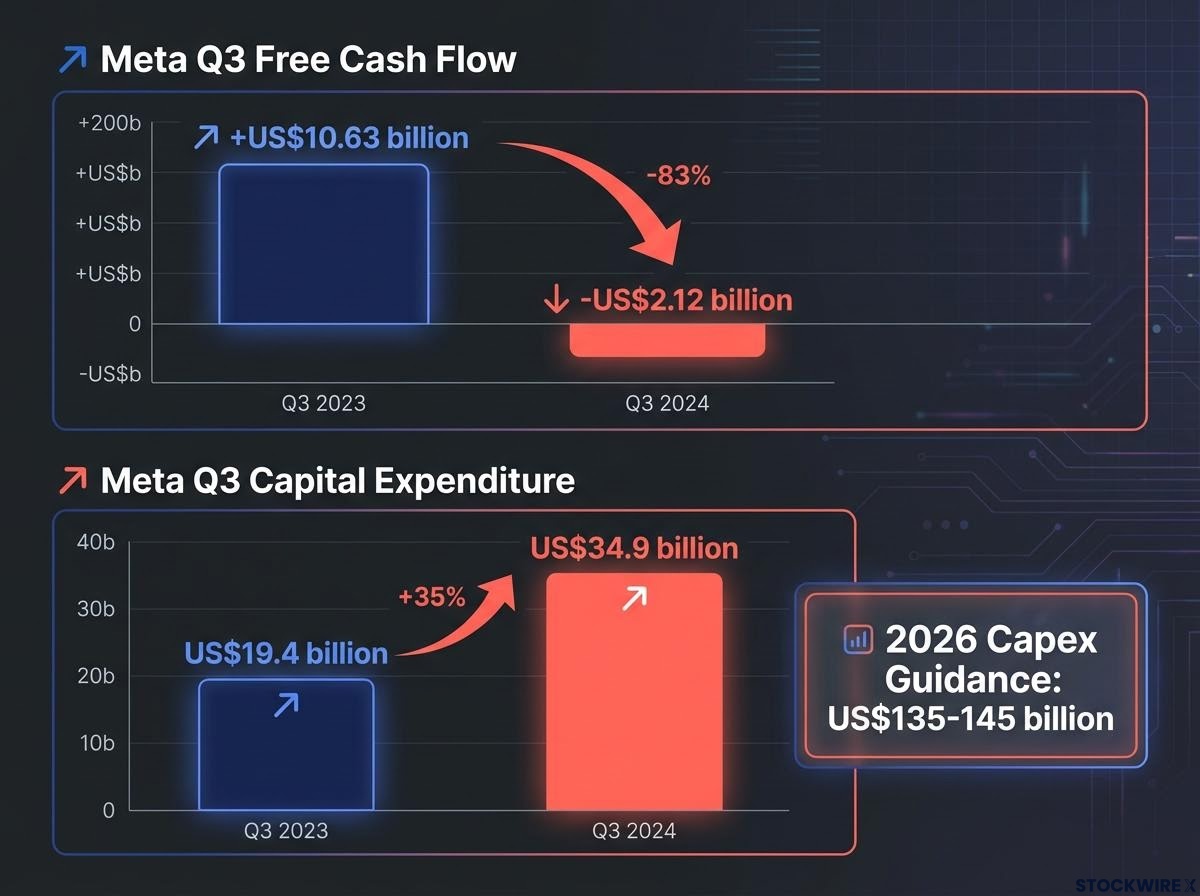
Meta’s free cash flow (the cash left after paying for operations and capital investment) came in at -US$2.12 billion for Q3, against +US$10.63 billion a year earlier. According to Fortune, it was the company’s first quarterly deficit since 2012. Q3 capital expenditure (capex), meaning spending on long-term assets such as data centres, reached about US$34.9 billion, up from US$19.4 billion. Meta also lifted the floor of its 2026 capex guidance to US$135-145 billion, from US$130 billion.
What Meta revealed about investor tolerance
Investors accept heavy spending while revenue and margins are accelerating. Meta showed the four conditions under which that patience runs out:
- Free cash flow turns negative.
- The spending forecast rises.
- Management floats potentially large share issuance, in Meta’s case proposed non-voting Class C shares.
- Returns on AI investment are hard to measure.
The concern has also moved beyond share prices. Meta’s credit-default-swap spread, the cost of insuring its debt against default, hit a record, while credit risk at Oracle and Amazon is also elevated.
The market is now penalising spending that outruns cash generation. If you hold Big Tech directly, through an ETF or through your super fund’s international allocation, this week’s capex disclosures carry more weight than usual.
When big ASX news breaks, our subscribers know first
What to watch in Microsoft, Alphabet and Amazon earnings
Meta set the bar. Now three larger spenders have to clear it.
Microsoft and Alphabet report Wednesday after the US close, which is Thursday morning in Australia. Amazon follows Thursday after the US close, landing Friday morning AEDT. Memory maker SK Hynix reports Tuesday and Intel and SanDisk report Wednesday, giving an early read on chip and memory demand.
| Company | Reporting day (US) | Consensus EPS | Consensus revenue | Key watch item |
|---|---|---|---|---|
| Microsoft | Wednesday, after close | US$4.71 | US$90.63B | Azure growth near 45% vs 43% |
| Alphabet | Wednesday, after close | US$3.03 or US$2.94 | US$127.91B or US$112.7B | Capex guidance of US$195-205B |
| Amazon | Thursday, after close | US$1.96 | No consistent figure found | Capex commentary (no formal guidance found) |
The Alphabet figures come from conflicting compilations, and the gap in revenue estimates is wide. That makes “beat or miss” headlines on Alphabet less reliable than usual, because the result depends on which consensus a given outlet uses.
Earnings per share (EPS) will grab the headlines, but three signals are more likely to move the stocks:
- Capex: whether spending plans hold steady or climb again. Alphabet has already lifted its 2026 guidance from US$180-190 billion.
- Cloud monetisation: whether Azure and its rivals show AI demand turning into revenue.
- Path to free cash flow: any timeline for spending to fall back within what the business generates.
The bullish case leans on demand. Microsoft’s AI business was reported to have passed a US$37 billion annual revenue run rate. Hyperscalers, the largest cloud operators, argue data centres are a prerequisite for earning anything from AI at all.
The cautious case leans on the arithmetic. Reuters reported the six major hyperscalers could spend more than US$7 trillion on data centres and AI over 2025-2030. A Reuters analysis of LSEG estimates found several, including Microsoft, Alphabet and Amazon, are expected to spend more on capex than they generate in free cash flow by 2027.
The investor worry Robert Pavlik of Dakota Wealth said investors were concerned the spending was becoming a “money pit.”
Strong cloud growth alongside steady capex would suggest the spending is demand-led, which is supportive for chip and memory names. Rising capex without matching cloud acceleration would likely repeat the Meta reaction, and that flows into your US tech ETFs and semiconductor-linked holdings.
For readers weighing whether the sell-off has gone far enough, our deep-dive into whether internet stocks are a buying opportunity examines Evercore’s view that hyperscaler free cash flow could inflect within 3-12 months.
How oil is pushing up bond yields, and why aluminium is in the frame
The screen tells the story. Brent rose more than 6% last week to just below US$117, with the year’s high near US$126. The US 10-year yield finished the week around 4.96%, according to Faircurve Insights, and closer to 4.99% in a later TradingKey update.
Why would bonds care about oil? A bond yield is the return investors demand for lending money, and it rises when they expect higher inflation or higher interest rates. Here is how an oil shock feeds through:
- Oil prices rise.
- Petrol, transport and production costs follow.
- Inflation expectations climb, first in headline figures and then in underlying measures.
- Investors price higher central bank rates for longer, plus a larger term premium (the extra return demanded for holding long-dated bonds).
- Long-duration assets, those whose value depends on cash flows far in the future, come under pressure.
Escalation risk is keeping that chain active. The US State Department ordered non-emergency staff to leave Saudi Arabia after Houthi strikes on Saudi targets, a third US aircraft carrier is heading to the region and President Trump has floated action after the 3 November US midterms.
The inflation channel versus demand destruction
There is a counterforce. Expensive oil can slow spending and investment, eventually cooling inflation and pulling yields down; this is called demand destruction. BMO rates strategist Ian Lyngen said markets were treating the shock mainly as an inflation problem and largely ignoring that second channel.
XTB’s Kathleen Brooks said developed-market bonds have generally struggled when oil trades above US$100, especially in highly indebted economies.
Swissquote’s Ipek Ozkardeskaya described “dueling headwinds” from energy and yields. This is the stagflation bind: oil lifts inflation while eroding real incomes, and a central bank cannot easily fix both at once. For your portfolio, rising yields hit growth stocks and listed property regardless of how well those companies are performing.
Supply-driven oil rallies carry the risk of a stagflationary outcome, leaving the Fed with the least room to manoeuvre, and some managers are already shortening duration and rotating into inflation-linked bonds in response.
Aluminium: a mixed supply picture
Aluminium shows how geopolitics reaches industrial metals. The Middle East produces about 9% of global supply, and attacks plus Hormuz disruption knocked out almost 3 million tonnes of capacity. LME three-month aluminium sits just above US$3,000/t, and BMI raised its 2026 forecast to US$3,100/t from US$2,900, citing supply-squeeze risk.
The recovery case is just as real. Japanese Q4 premiums fell 35% as Middle Eastern supply returned, and Standard Chartered reportedly cut forecasts on Indonesian, Chinese and European output. The lesson is that a war premium can unwind quickly, so a commodity spike is rarely a one-way trade.
Fed, CPI and the RBA: where the rate odds stand
Oil is pushing inflation expectations up. The question is which central bank responds, and the answer differs sharply between Washington and Sydney.
The Fed: a hold with a December question
The Federal Reserve meets Wednesday, with its decision landing Thursday morning AEDT. CME FedWatch priced a 90.6% chance of no change, according to Yahoo Finance on 25 October, so the meeting is mostly about guidance.
The live question is December. FedWatch shows about 68% odds of a hike, below the roughly 75% cited in earlier coverage, a gap that likely reflects timing or method. A Reuters poll found all 100 economists surveyed expect a December hike. Watch for comments on financial conditions as credit spreads widen.
RBA: why CPI day decides Cup Day
The RBA picture turns on one number. Market odds of a 25 basis point hike to 4.85% on 3 November sit around 51%, with snapshots ranging 41-55% (Yahoo Finance and The Bull). An earlier figure of about 65% is now dated. Deputy Governor Andrew Hauser’s remark that the inflation outlook looked “materially worse” moved pricing from roughly 20-22% to about 50%.
Consensus for Wednesday’s Q3 trimmed mean (an underlying inflation measure that strips out the most extreme price moves) is about 1.0% quarter-on-quarter, or roughly 3.6% year-on-year.
The trimmed mean has been the RBA’s decisive gauge this cycle; it held at 3.6% in the prior quarter, beating consensus, which shows how small misses against forecast can swing the hike debate.
| Institution | Stance | Stated reasoning |
|---|---|---|
| Citi | Hike | Josh Williamson and Faraz Syed say even 0.9% could support a hike |
| Goldman Sachs, UBS, ANZ | Reported favouring a hike | Broad, persistent inflation; acting before expectations entrench |
| NAB | Hold | Expects 1% but still forecasts a hold |
| CBA | Hold | Retains hold call, with growing hike risk |
The hold camp has two strong arguments. Warren Hogan warned earlier increases could still suppress spending over 12-18 months, and a rate rise cannot add a single barrel of oil.
For households, the stakes are concrete:
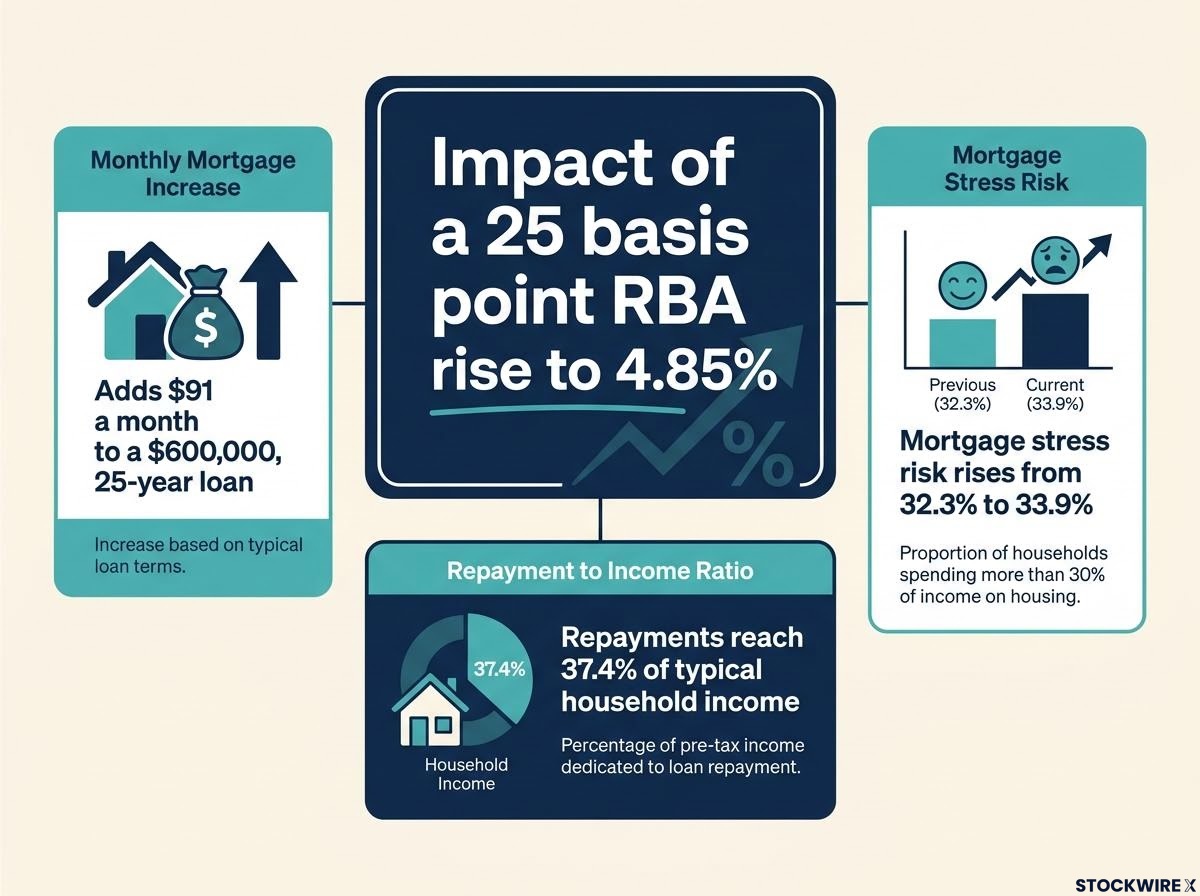
- A 25 basis point rise adds about $91 a month to a $600,000, 25-year loan.
- REA economists estimate repayments would reach about 37.4% of typical household income at 4.85%.
- Roy Morgan estimates the share of mortgage holders at risk of stress could rise from 32.3% to 33.9%.
If you hold a mortgage or bank shares, a trimmed mean at or above 1% moves a hike to near-even odds. Wednesday’s CPI, not Cup Day, is your moment to reassess.
What a rate shock could mean for ASX sectors
A hike is not uniformly bad for the ASX. The winners and losers depend on whether markets read the shock as inflation or as a slowdown.
| Sector | Likely effect | Main driver |
|---|---|---|
| Banks | Positive first, risk later | Wider margins initially; arrears and slower credit growth later |
| Housing and consumer | Negative | Lower borrowing capacity and discretionary spending |
| Property trusts | Negative | Higher discount rates and refinancing costs |
| Energy and resources | Mixed to positive | Higher oil and aluminium, offset by weaker demand |
| Industrials and transport | Negative | Fuel costs and disruption |
| Exporters | Mixed | Weaker AUD helps; global risk-off may overwhelm it |
| Tech and growth | Most exposed | Rising yields |
This is general information only and does not consider your personal circumstances.
Banks show the timing split most clearly. Margins can widen quickly after a hike, while credit-quality damage builds over months. With the major banks reporting in a couple of weeks, their commentary on arrears is the next test.
Energy holders should note that US energy outperformed Australian energy last week, so oil strength is not translating evenly. If your holdings lean heavily towards growth, property and consumer names, you are concentrated on the side a rate shock hits hardest.
Sector positioning has historically mattered more than the binary choice to hold equities; in the 2022 downturn, industrials and energy produced the top performers while real estate and consumer discretionary produced none.
Four checkpoints that will settle the week
The common thread is a policy squeeze. Oil is lifting inflation expectations just as AI spending tests how willing investors are to fund long-dated growth. These are your checkpoints, in order:
- 28 October, Australian CPI: a trimmed mean near 1% keeps a hike near a coin toss; a clear miss strengthens the hold case.
- Wednesday and Thursday (US time), Fed and Big Tech: December guidance, then capex against cloud growth.
- All week, oil and yields: Brent near US$117 and the 10-year near 5% are the pressure gauges.
- 3 November, RBA decision: the same day as the US midterms, adding geopolitical timing risk.
Check CPI first. A higher number pressures your rate-sensitive holdings; heavier capex without cloud payoff pressures your growth exposure. And a hike still cannot create oil supply.
This article is for informational purposes only and should not be considered financial advice. Investors should conduct their own research and consult with financial professionals before making investment decisions. Past performance does not guarantee future results. Financial projections are subject to market conditions and various risk factors.