Bearish sentiment among Australian investors reached 54.4% in the week ending 19 September 2026, its second-highest reading since the survey began. The last time pessimism ran this close, in early March 2026, the ASX 200 fell roughly 9% over three weeks.
The question facing investors now is not whether rates are high. It is whether your portfolio sits in the sectors that have historically absorbed rate pressure rather than transmitted it straight through to your returns.
That distinction matters more than usual right now. With the US Federal Reserve resuming hikes (its September 2026 move to 3.75-4.00% was its first increase since 2023) and the RBA holding at 4.35% with markets pricing a further rise, the rate environment has stopped being an abstract risk. It is a live condition shaping ASX sector returns.
The 2022 cycle produced a sharp, sector-specific split that most people remember as one broad decline. That memory obscures the real lesson: some ASX sectors produced top performers even as the index fell.
This piece maps which ASX sectors held up through 2022 and why, explains the structural mechanics behind that resilience, sets out what UBS and other strategists are recommending now, and flags where the 2022 template strains in 2026. Here is the framework for thinking about sector allocation when rates are high, grounded in evidence rather than intuition.
What 2022 actually showed about which ASX sectors survive a hike cycle
The Fed lifted rates for the first time in nearly four years on 16 March 2022. What happened over the following three months is where the real story sits, and it did not unfold the way most investors expected.
For the first five weeks, the market rallied. The ASX 200 climbed 5.8% through 21 April 2022, which convinced many investors that a hike cycle would be a manageable, orderly affair.
It was not. As Australian bond yields kept climbing and inflation data pointed to prolonged tightening, the index reversed hard, falling 15% through to 17 June 2022.
Net effect: by 17 June 2022, the ASX 200 sat 10.3% below where it closed on the day of the Fed’s first hike.
The repricing had, in fact, already begun before the hike itself. Australian 10-year bond yields had risen 862 basis points year-to-date by the time the Fed moved, up from around 1%. The event confirmed a trend the bond market had been signalling for months.
The sectors that held, and those that did not
The early rally is what misled people. A benign first five weeks made a hike cycle look tame, right up until the sector rotation revealed itself in the reversal.
During the downturn, top-performing ASX stocks clustered heavily in real-asset and operationally geared sectors. Four sectors produced none at all.
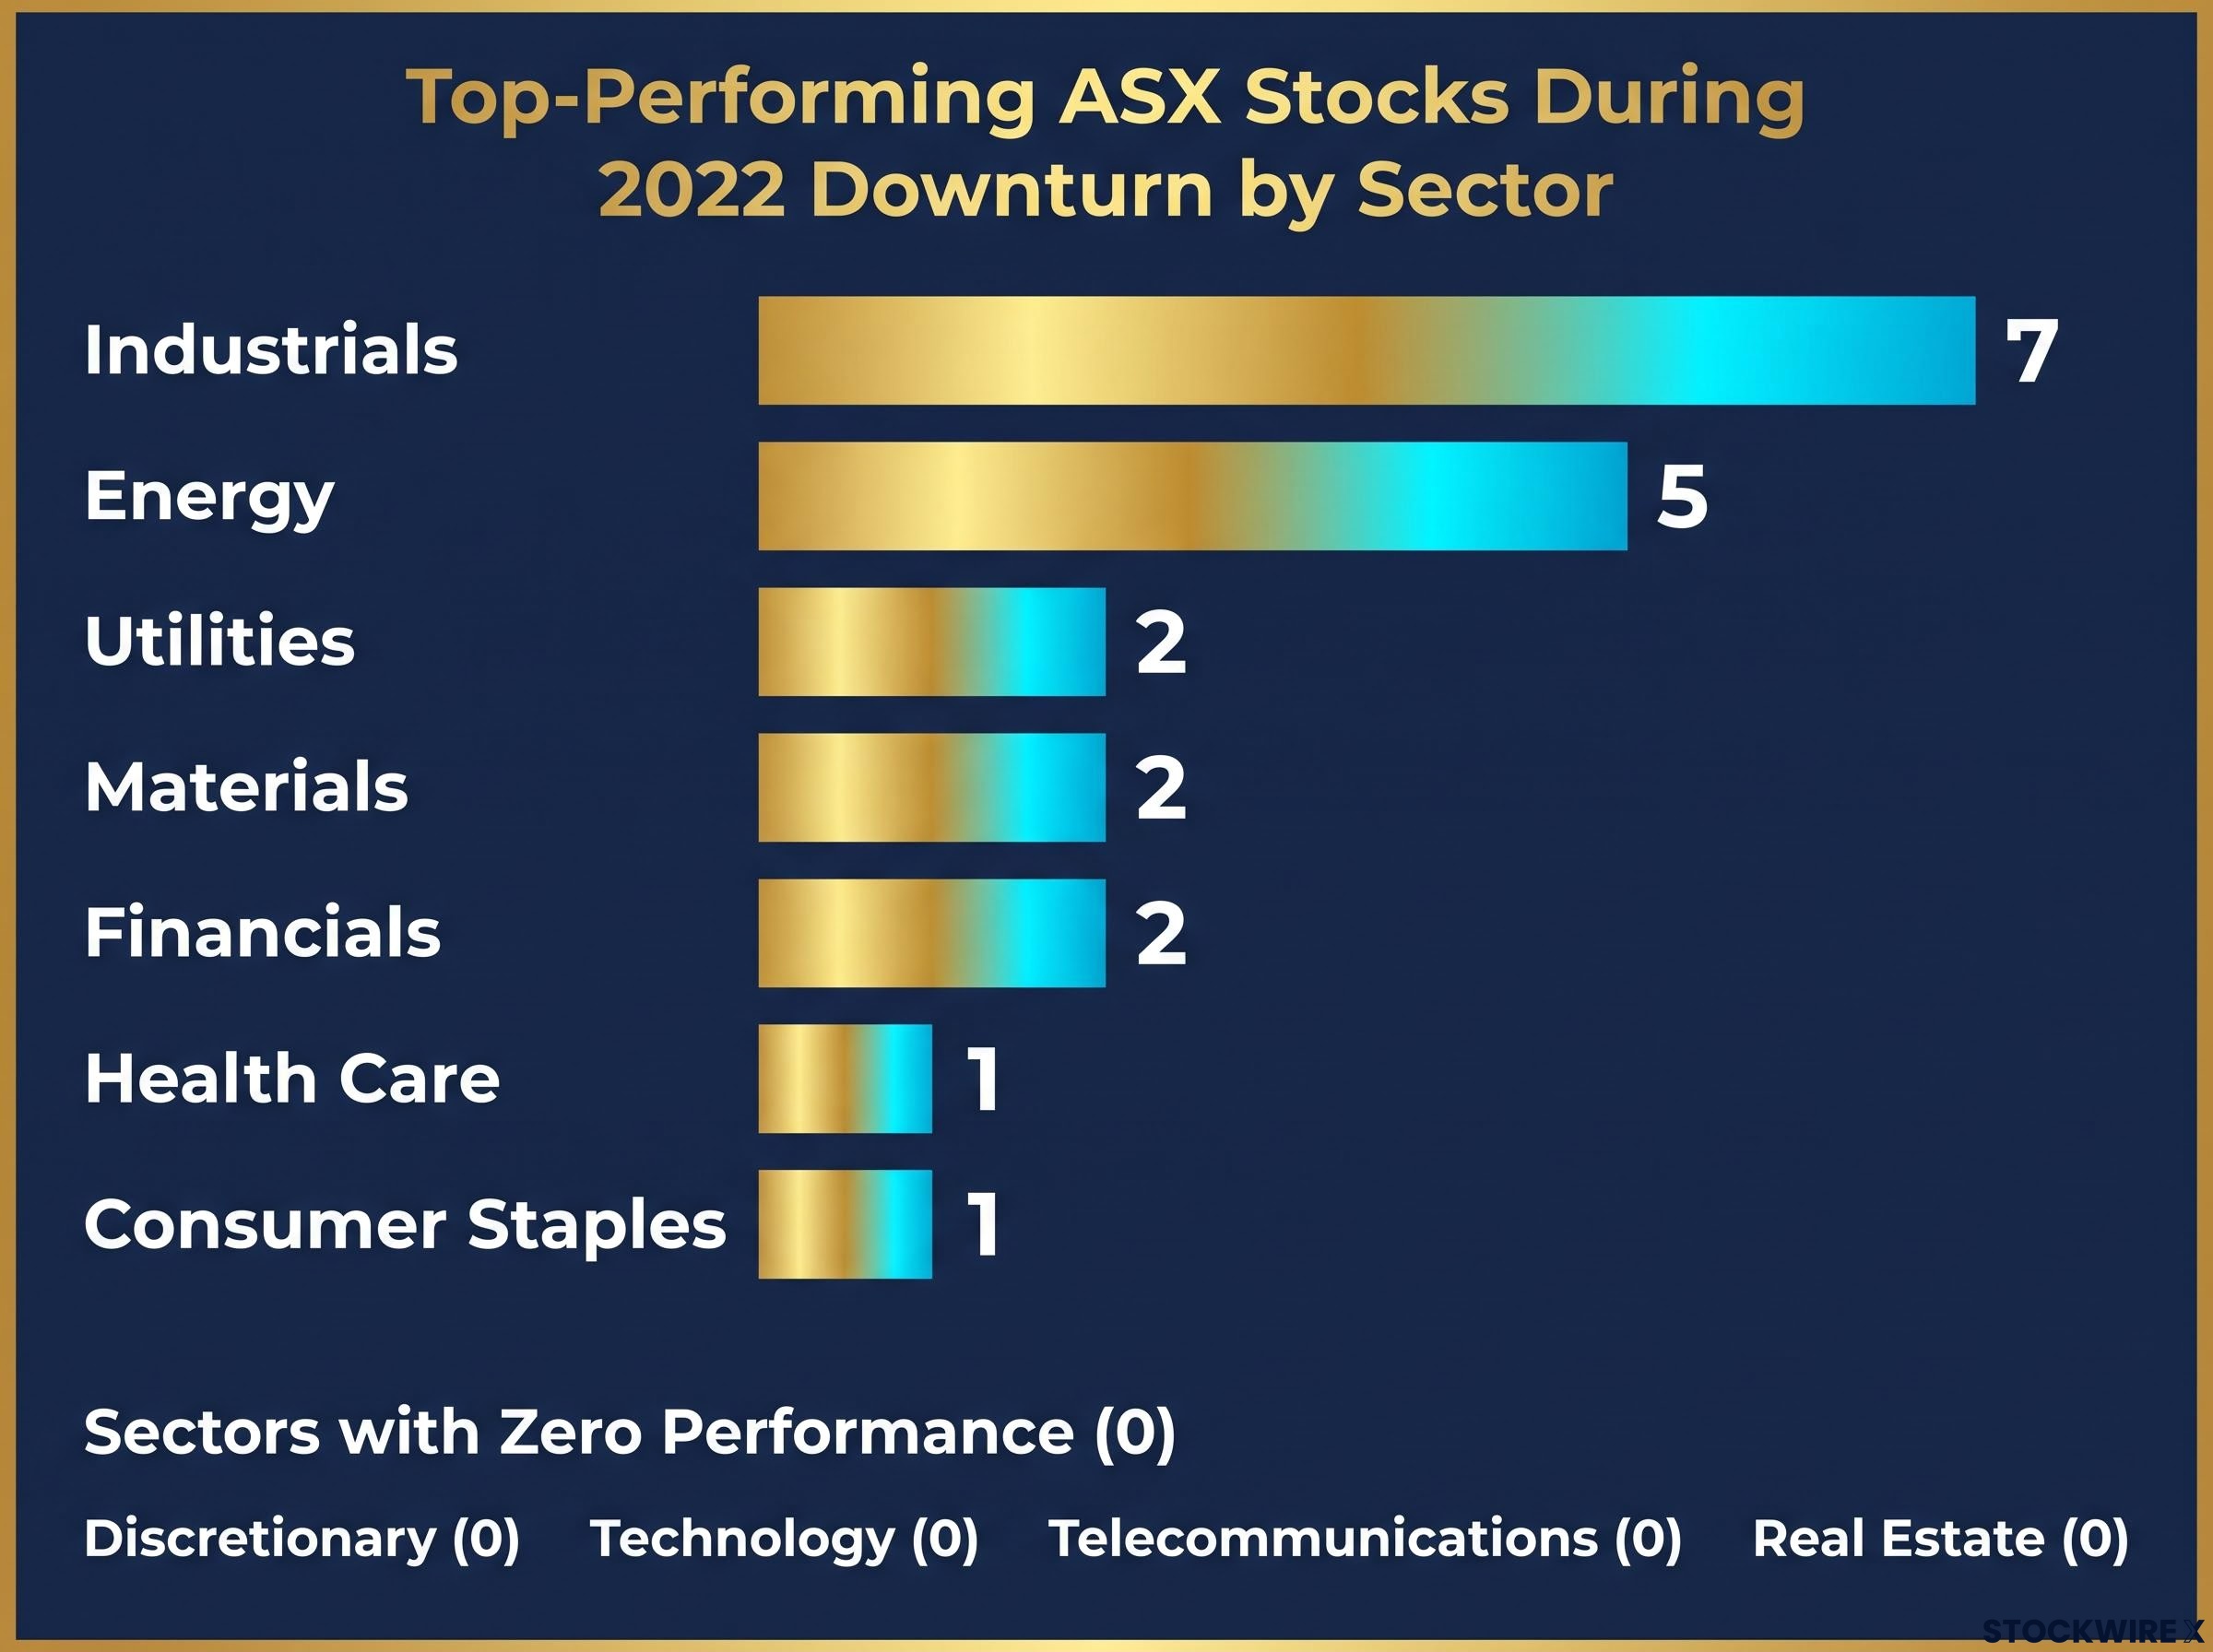
| Sector | Number of top performers | Representative stock types |
|---|---|---|
| Industrials | 7 | Toll roads, engineering firms |
| Energy | 5 | Coal producers, oil refiners |
| Utilities | 2 | Regulated power and infrastructure |
| Materials | 2 | Gold miners |
| Financials | 2 | Diversified financial names |
| Health Care | 1 | Defensive healthcare |
| Consumer Staples | 1 | Defensive consumer |
| Discretionary, Technology, Telecommunications, Real Estate | 0 | None |
The read you should take from this is that a Fed hike cycle does not create a uniform market decline. It creates a rotation, and in 2022 that rotation moved toward real assets and operational leverage. Where you sit within the index, not simply whether you hold equities, is what determined the outcome.
The pattern repeated in early 2026: during the February-March ASX sector rotation driven by the oil shock, Energy gained 16.1% while the broader index fell 9%, and the spread between the best and worst individual performers reached 63 percentage points, confirming that where you sit within the index consistently outweighs the binary decision of whether to hold equities at all.
When big ASX news breaks, our subscribers know first
Why Energy and Materials absorb rate pressure while others transmit it
The sector list is useful, but the mechanism behind it is what makes the pattern repeatable. Start with how commodity companies actually make money in an inflationary period.
Their revenue rises directly with metal and oil prices. Many of their costs, by contrast, are fixed or slow to move. That gap produces operational leverage: when prices climb, margins expand faster than revenue, and profits can outrun the commodity itself.
The Australian energy sector rose approximately 48% from July 2021 to January 2023, outpacing the price of oil over the same window.
That is operational leverage made visible. The sector did not just track the commodity; it amplified it.
This shows up in the correlation data too. Over the three years to 2026, Energy is the only major ASX sector with a meaningfully positive correlation to rising short-term bond yields. Every other major sector shows a negative one.
The contrast is sharpest at the stock level. The names most exposed to RBA hikes are concentrated in property, retail, and consumer sectors:
- Stockland
- Mirvac
- Wesfarmers
- JB Hi-Fi
- Seek
A separate group is more sensitive to movements in long-term bond yields:
- Transurban
- APA
- Wesfarmers
- CBA
Transurban is worth a caveat here. It appears on the long-yield list, but around 68% of its revenue is CPI-linked and roughly 98-99% of its debt is hedged, holding its weighted average cost of debt near 4.1% despite the broader rise in yields. The simple rate-sensitivity label understates how much of that exposure it has already neutralised.
The ASX structural advantage US research cannot replicate
This is where Australian portfolios diverge from the US playbook. The S&P 500 is dominated by technology and growth names, which sit at the vulnerable end of the rate spectrum.
The ASX is built differently. Its index weight leans heavily toward resources, and resources respond to global growth and commodity pricing rather than domestic credit conditions.
That decoupling is the key point. Because miners and energy producers track international demand rather than the RBA cash rate, they can outperform even while the central bank is actively hiking. For Australian investors, resource exposure functions as a structural rate hedge built into the index itself, one that US-focused portfolios simply cannot access the same way.
What the strategists are recommending now, and where the consensus sits
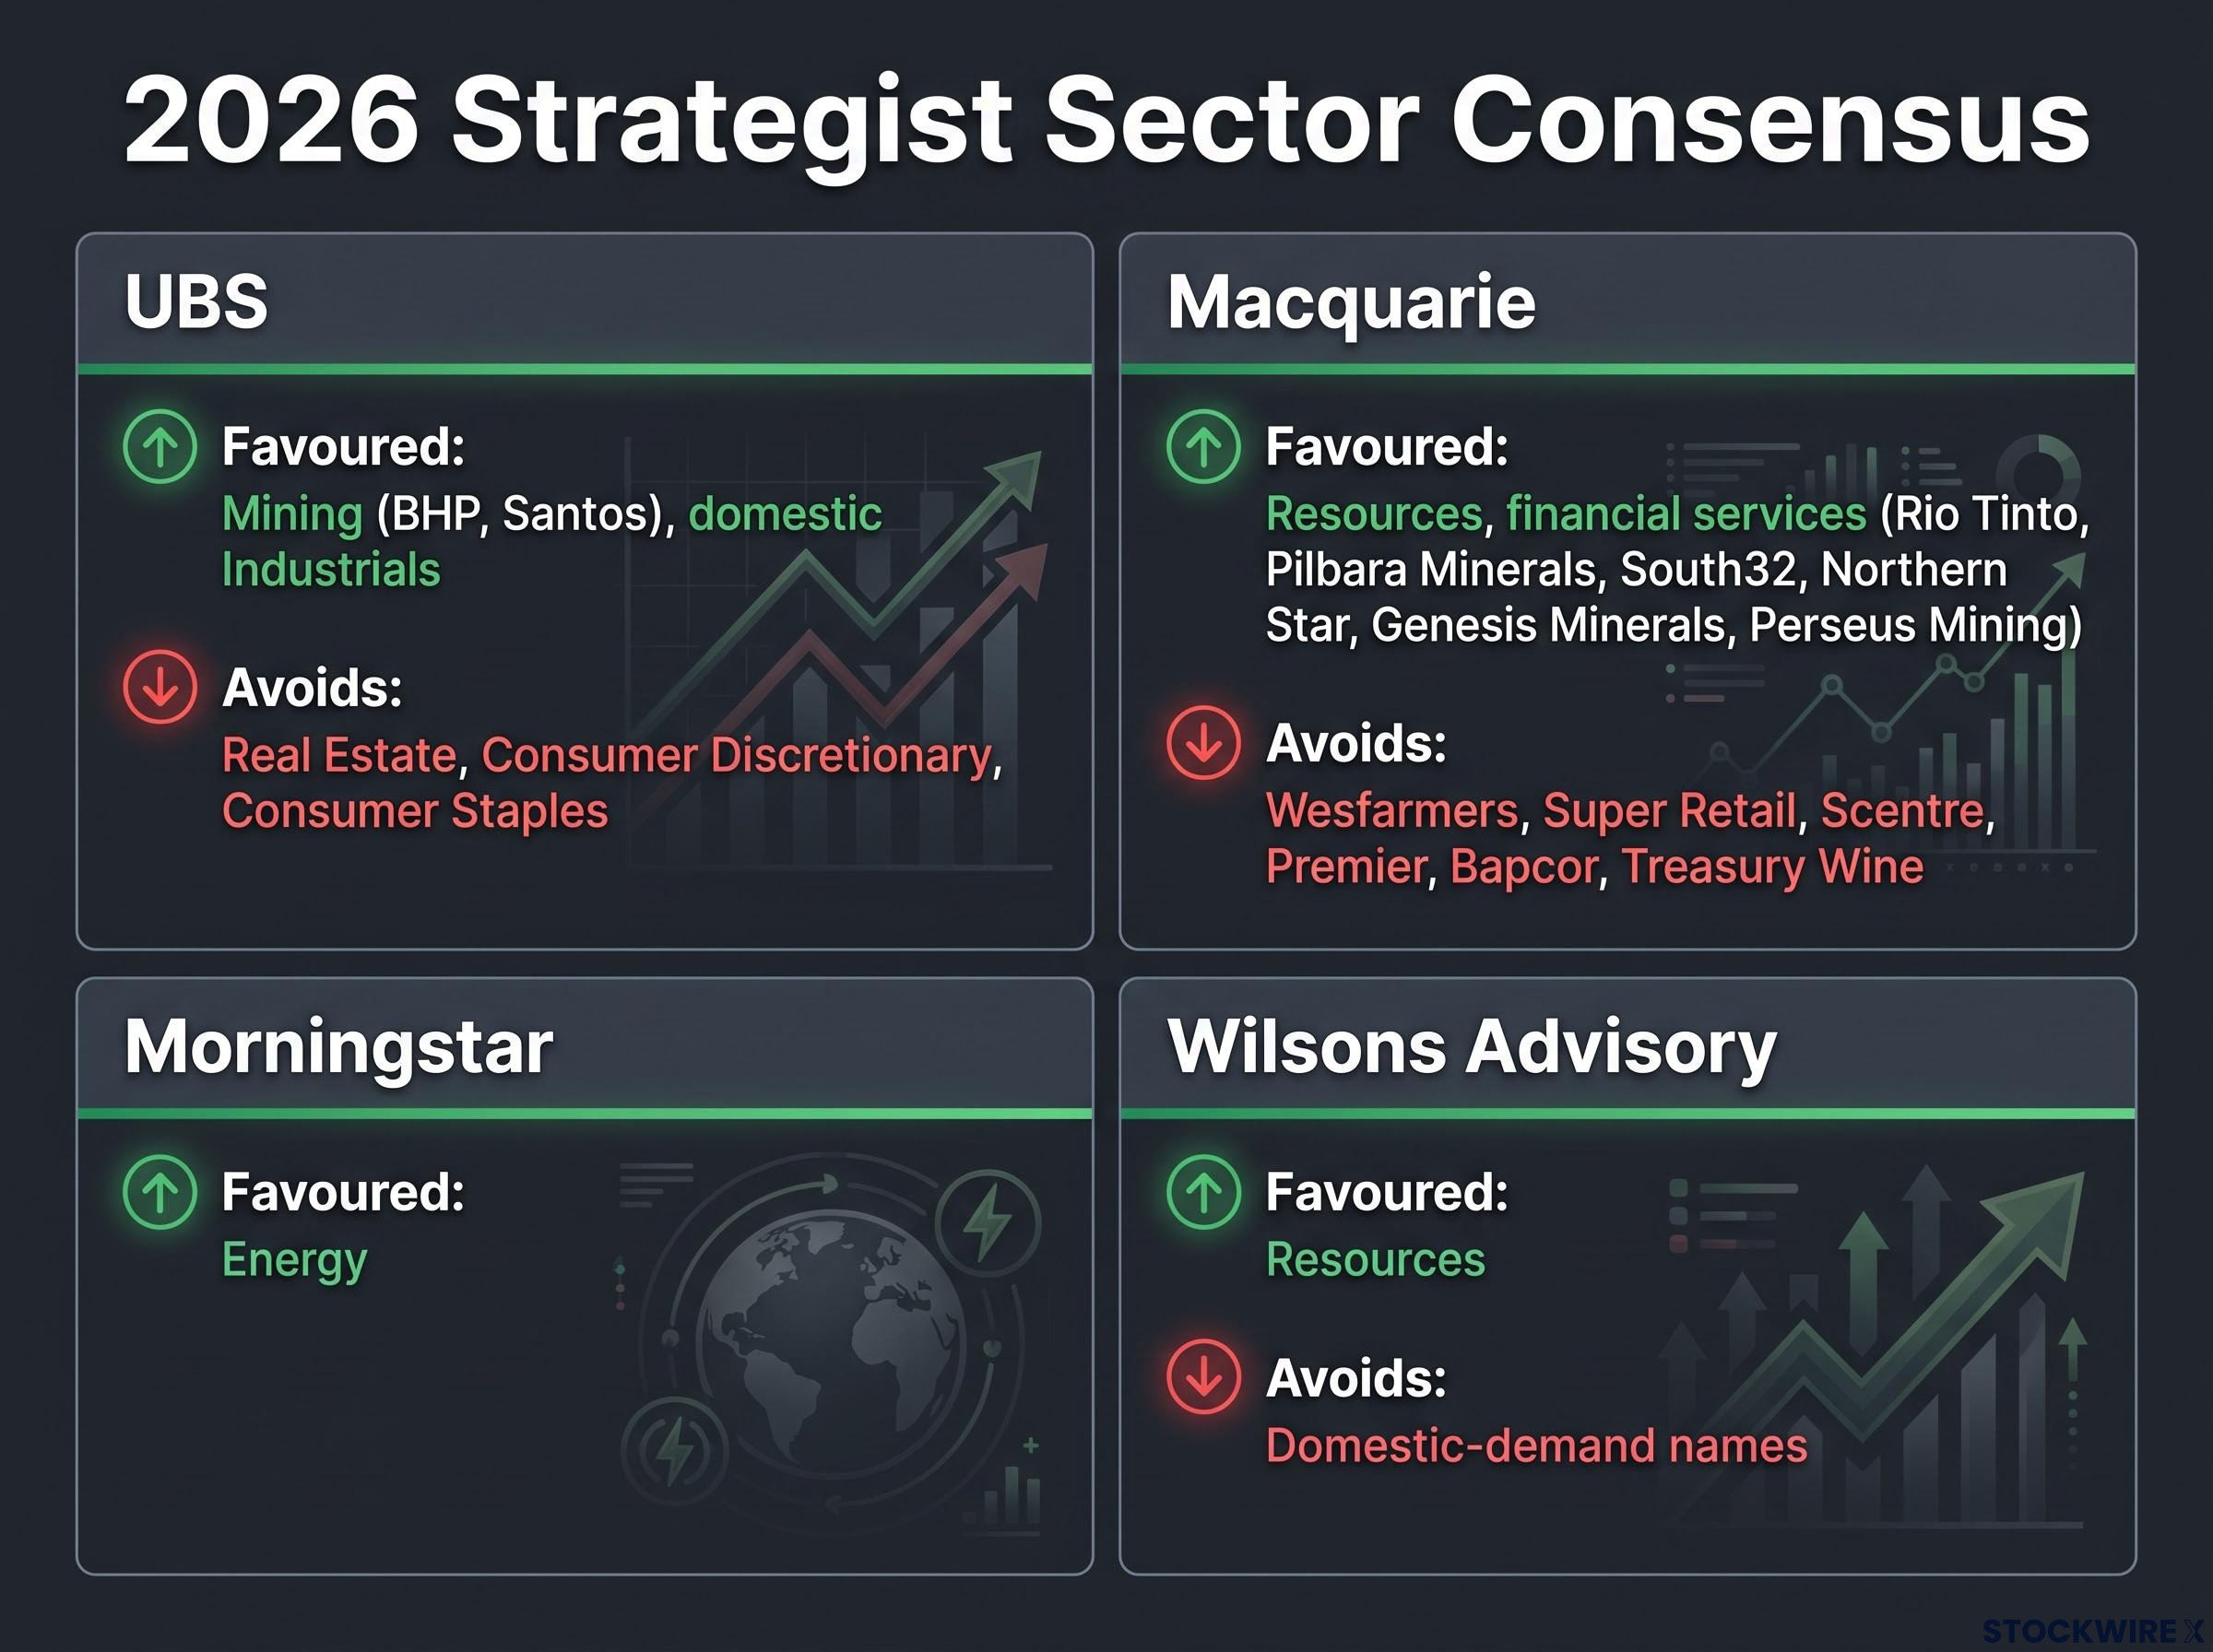
Here is what strengthens the case: four independent research houses have arrived at broadly the same sector calls, each via a different reasoning path.
UBS is the primary reference point. Its analysis favours overweighting Mining (naming BHP and Santos) and domestically focused Industrials tied to mining services, government infrastructure, and defence, while flagging Real Estate, Consumer Discretionary, and Consumer Staples as the sectors most sensitive to short-term rate expectations.
Macquarie lands in a similar place from a late-cycle angle, favouring resources and financial services, with individual miner picks and a separate list of consumer-exposed laggards. Morningstar calls Energy its most undervalued sector, and Wilsons Advisory argues resources outperform ahead of RBA hikes precisely because global growth, not domestic demand, drives them.
| Broker | Favoured sectors | Stocks named | Sectors to avoid |
|---|---|---|---|
| UBS | Mining, domestic Industrials | BHP, Santos | Real Estate, Consumer Discretionary, Consumer Staples |
| Macquarie | Resources, financial services | Rio Tinto, Pilbara Minerals, South32, Northern Star, Genesis Minerals, Perseus Mining | Wesfarmers, Super Retail, Scentre, Premier, Bapcor, Treasury Wine |
| Morningstar | Energy (most undervalued) | Energy and mining names | Not specified |
| Wilsons Advisory | Resources | Not specified | Domestic-demand names |
The current cycle is already confirming these calls. In FY25-26, the sector return hierarchy split sharply:
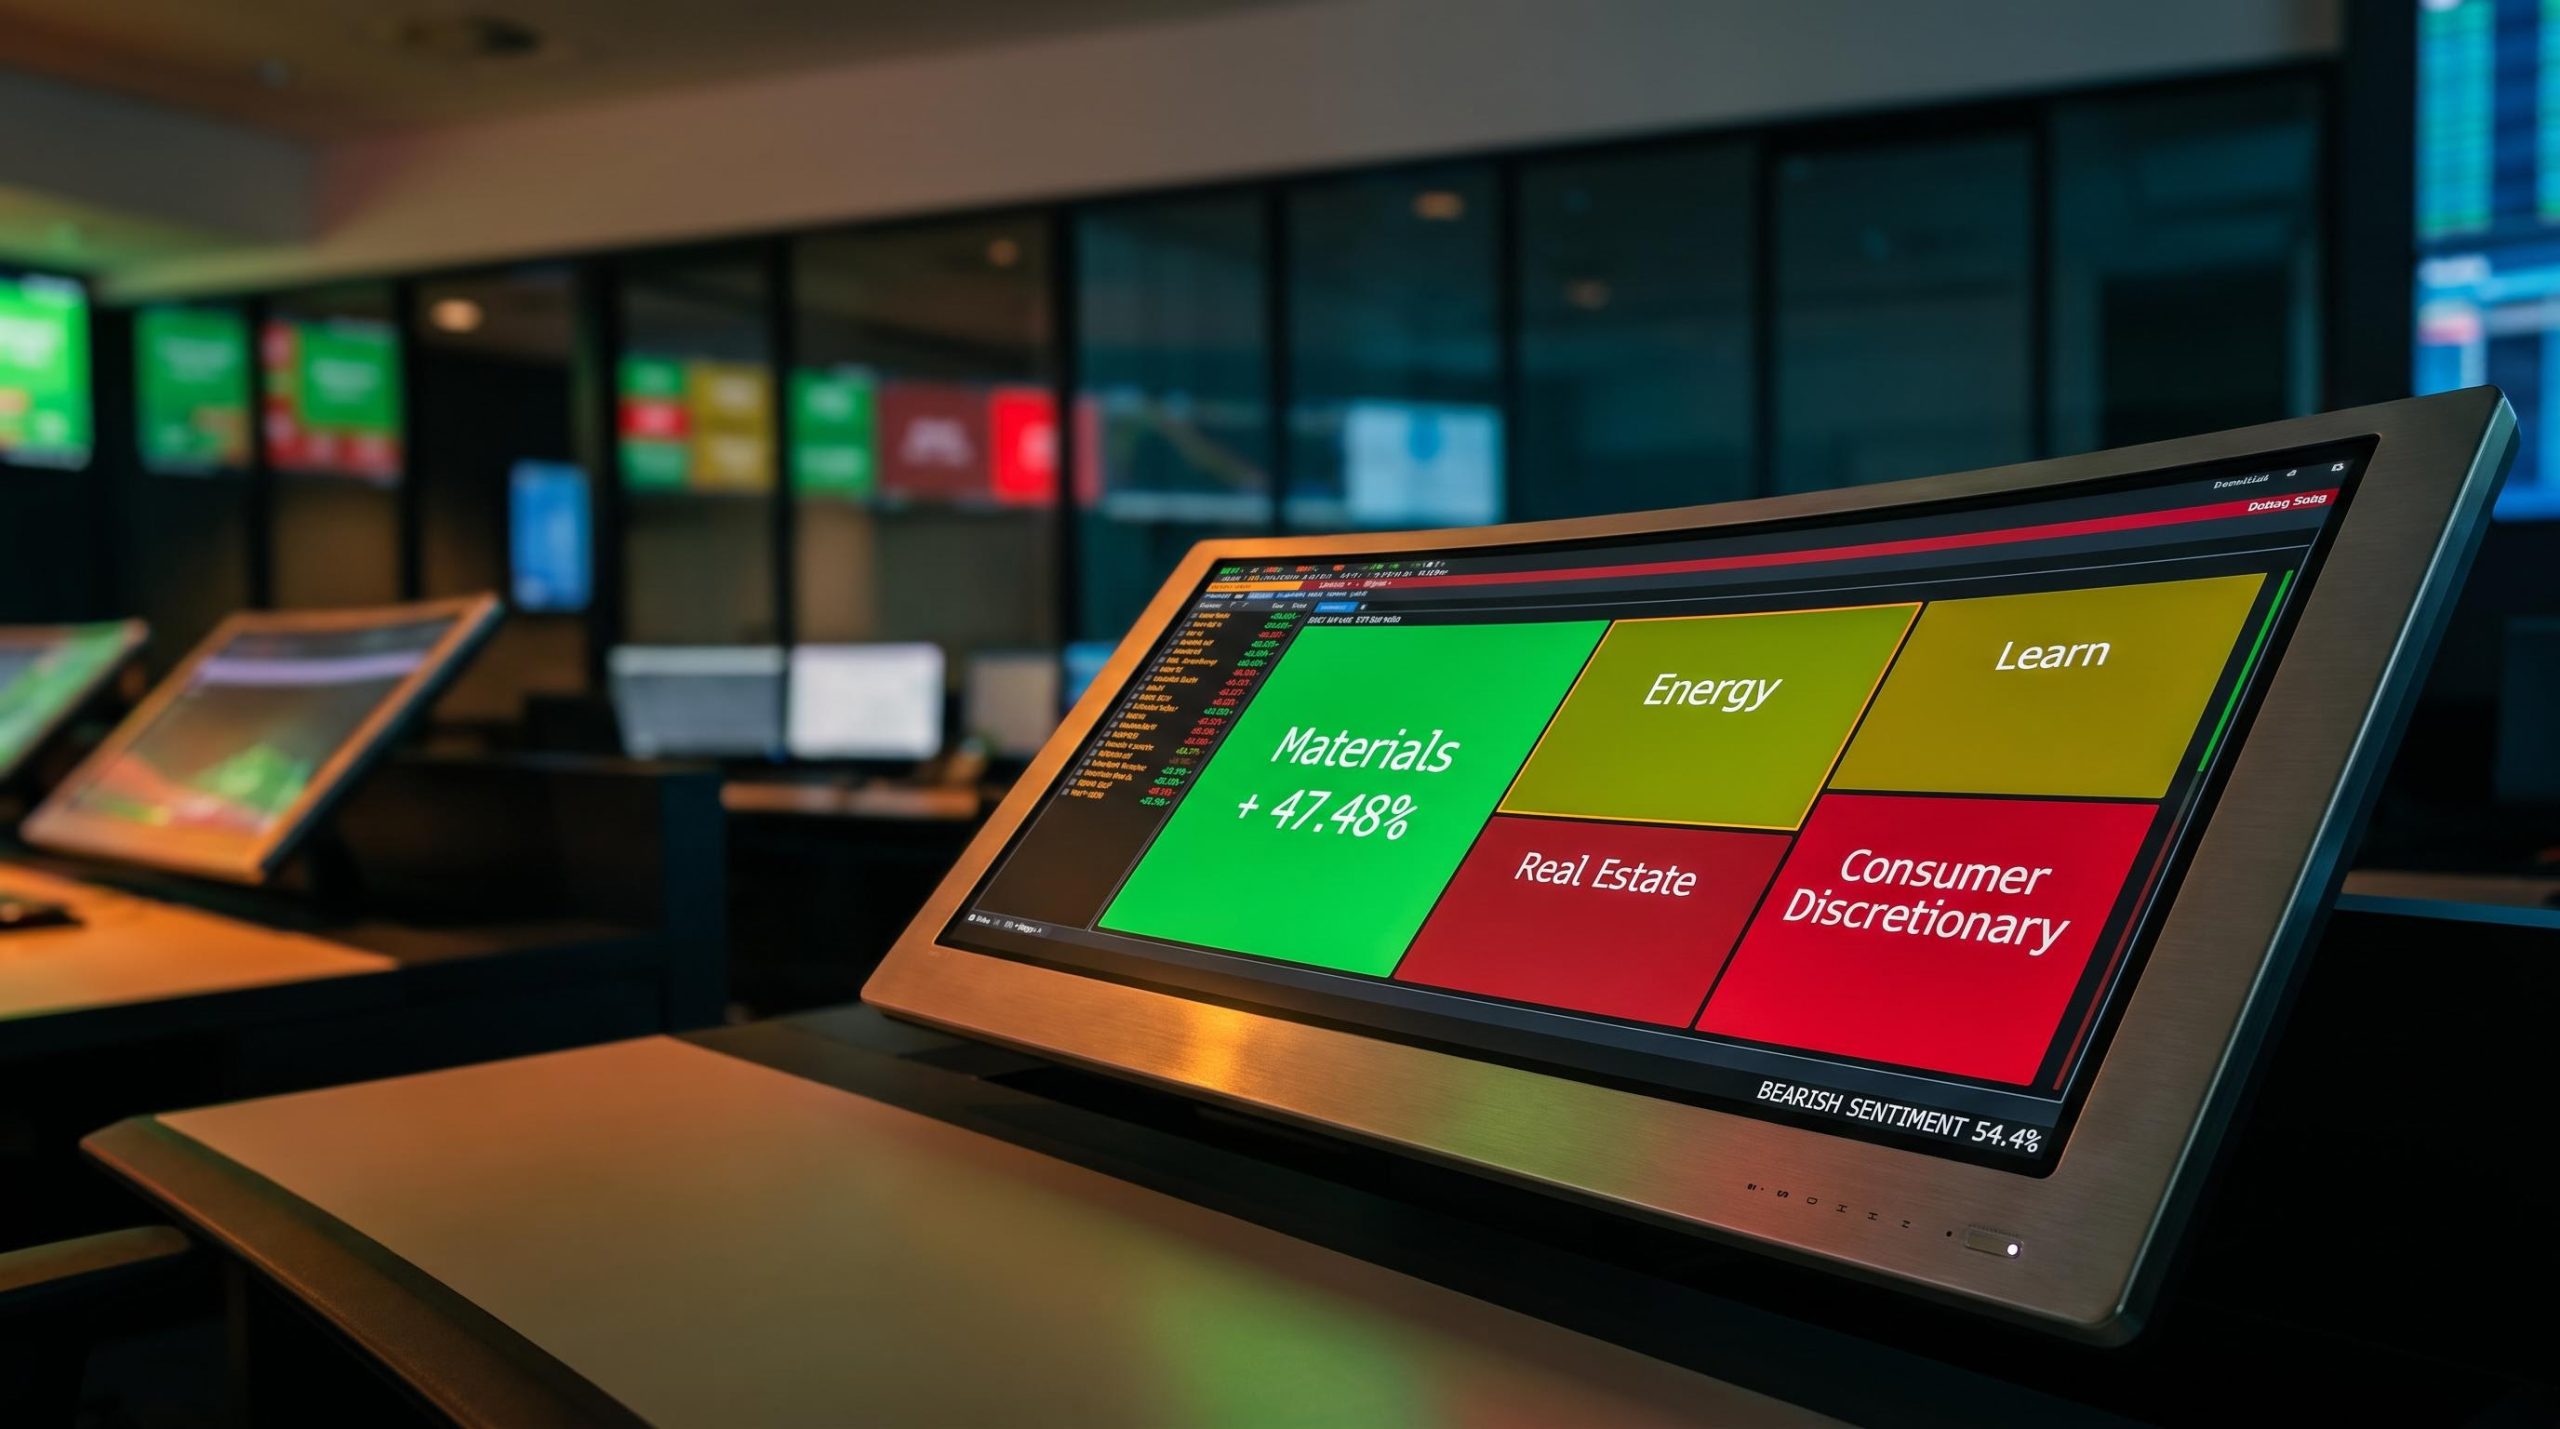
- Materials led, up 47.48% in price terms and 52.11% including dividends.
- Energy gained 9.37% in price and 14.51% including dividends.
- The broader ASX 200 returned roughly +3.2% for FY26.
- Real Estate lagged, down 5.32% in price for a -2.24% total return.
The trailing 12 months to September 2026 tell the same story: Materials up somewhere in the 15-59% range depending on the metric, Energy up 33-34%, and Real Estate down between 8% and 18%.
All of this is forming against a backdrop of extreme pessimism.
Bearish sentiment reached 54.4% in the week ending 19 September 2026, its second-highest level on record.
When UBS, Macquarie, Morningstar, and Wilsons converge on Materials and Energy from four different starting points, the thesis has cleared a higher bar than any single analyst view. What that tells you is this is not a forward bet on a theory. It is a current-cycle observation, already visible in FY26 returns, even with the China risk underneath it still live.
Professional fund positioning as of mid-2026 reinforces the same tilt: Morgan Stanley’s analysis of 62 active Australian equity funds found Industrials had flipped from a structural underweight to a historic overweight, Santos reached its highest ever active weight across the cohort, and CBA carried the largest single-stock underweight in the market at negative 8.0 percentage points, giving the broker consensus a real-money confirmation that extends beyond model portfolios.
Where the 2022 template breaks down in 2026
Now for the part that gives the thesis a more honest shape. The 2022 template points you toward the right sectors, but it does not justify 2022-scale conviction, and the differences are specific.
The 2022 cycle was an extreme shock. US inflation ran near 9%, and the Fed lifted rates by 525 basis points from the zero bound. The 2026 cycle looks nothing like that, with the Fed at 3.75-4.00% after a single 25 basis point move and inflation expectations far better anchored. That has led some strategists to compare the current environment to the milder 1994 or 2004-2006 episodes.
| Cycle parameter | 2022 cycle | 2026 cycle |
|---|---|---|
| US inflation | Near 9% | Substantially lower, anchored |
| Fed tightening | 525bp from zero | 25bp, rate at 3.75-4.00% |
| Comparable historical cycle | Extreme shock | 1994 or 2004-2006 |
There is also a broader-market caveat the headline sector numbers hide. As of late 2026 research, the ASX 200 was up only around 0.5% year-to-date and down roughly 1.3% over the trailing 12 months. Earnings growth has been concentrated heavily in resources, which is a strength when commodities run and a cyclical exposure if they normalise.
The China variable and what it means for bulk commodities
The single largest risk to the resources thesis is China. A prolonged Chinese slowdown weighs directly on bulk commodities, particularly iron ore and industrial metals, which happen to be the largest components of the Materials sector the strategists are recommending.
India and Southeast Asia offer growth, but analysts are clear that this demand does not yet fully offset Chinese weakness. Rising property-sector stress adds to the picture, with rapid rate increases pressuring housing affordability, hitting developers like Stockland, and driving cap-rate expansion across commercial property trusts.
Chinese domestic demand heading into late 2026 presents a more structurally constrained picture than headline GDP figures suggest: retail sales grew just 0.4% year-on-year in August while industrial production ran at 5.0%, and with 70-80% of household wealth sitting in falling property values, the consumer rebound that would typically support bulk commodity demand is not materialising on the timeline that a straight-line resources thesis requires.
The point here is calibration, not reversal. The 2022 template still hands you the right sectors, but in a milder cycle with China as an active headwind, the magnitude of resources outperformance is likely smaller and more concentrated in specific commodities such as energy, gold, and select industrial metals than a straight repeat would suggest.
Positioning for a rate-plateau environment where the historical evidence points
Pulling the threads together produces a tiered view rather than a single verdict. The historical evidence and the strategist consensus point most consistently toward Energy and select Materials, particularly commodities with supply constraints or inflation-linkage. Domestically focused Industrials carry moderate conviction, and Real Estate and consumer names sit at the bottom.
Both central banks remain in restrictive territory, which keeps the framework live. Market pricing puts a 93-95% probability on an RBA move to 4.60% in September 2026, with 4.85% possible by early 2027. The Fed’s median projection sits at 4.1% for end-2026, 3.9% for 2027, and 3.6% for 2028.
The sentiment reading adds a tactical layer worth weighing.
Bearish sentiment peaked at 61.0% on 8 March 2026, coinciding almost exactly with the ASX trough, when the index fell roughly 9% between 2 and 23 March 2026.
Historically, peak pessimism has marked market lows rather than the start of sustained declines. The current 54.4% reading approaches but has not exceeded that March peak, which is a contrarian consideration layered on top of the structural sector case.
To test whether the thesis is holding, track these:
- Chinese industrial activity data
- RBA meeting outcomes and the probability-weighted path toward 4.60% and 4.85%
- Global energy prices
- Signals of commodity price normalisation
For an Australian investor reviewing allocation right now, the question is not whether to tilt toward Energy and Materials. The evidence supports that direction. The real decision is how much of that tilt the China risk justifies trimming.
For investors wanting to build a systematic framework around these observations rather than applying the 2022 template as a one-off heuristic, our comprehensive walkthrough of sector rotation strategy covers business cycle phase classification, Relative Rotation Graph signals, and fund flow analysis as a three-layer confirmation method for identifying where institutional capital is moving before official data confirms it.
This article is for informational purposes only and should not be considered financial advice. Investors should conduct their own research and consult with financial professionals before making investment decisions. Past performance does not guarantee future results, and financial projections are subject to market conditions and various risk factors.