
The US dollar is clawing back ground against the Canadian dollar on the eve of a Federal Reserve decision. Crude oil, the commodity most closely tied to the loonie, is sliding at the same time. USD/CAD trades back above 1.40 after a near 2% two-week slide, and the near-term forecast now hinges on one question: is this a pause in a Canadian dollar rally, or the first leg of a reversal?
The timing compresses the risk. The Federal Reserve (Fed) and the Bank of Canada (BoC) both announce rate decisions on Wednesday 28 October 2026. Two central banks will move the same currency pair within hours of each other.
Oil adds a third moving part. Prices sit near multi-month highs but are slipping as US-Iran diplomacy gathers pace.
After reading this, you will know which drivers carry the most weight for the pair right now, which price levels traders are watching, and what would have to happen for the picture to change.
Why is USD/CAD rebounding while the wider trend still points down?
On Monday, the US dollar firmed. USD/CAD traded around 1.4017-1.4023 on 26 October, up from Friday’s low near 1.3968-1.3969, as the greenback gained against most major peers in a quiet session.
Widen the frame and the bounce looks small. The pair had fallen almost 2% over the previous two weeks, and Monday’s recovery has only reclaimed a sliver of that decline.
The range has also been tight. On 22 October, Reuters reported USD/CAD at 1.4007 with the Canadian dollar at a one-month high. Today’s price is barely above that mark.
Three reference points frame the current setup:
- Friday low: about 1.3968-1.3969
- 22 October level: 1.4007, with CAD at a one-month high
- Current level (26 October): about 1.4017-1.4023
FXStreet’s Guillermo Alcala framed Monday’s move as the dollar recovering part of its losses while the broader trend stays lower. Low volume and an imminent Fed decision point to traders squaring positions, not building new ones.
That distinction matters for how you read the bounce. A recovery this modest inside a falling trend tells you the market is hedging event risk rather than changing its view. Until Wednesday’s decisions land, treat the move as unconfirmed.
When big ASX news breaks, our subscribers know first
How much does oil still drive the Canadian dollar?
Oil is the obvious place to look for an explanation. The relationship is less straightforward than it used to be.
The traditional link
Canada is a major crude exporter, so oil prices have long fed directly into its currency. When crude rises, export receipts grow and the terms of trade improve. Terms of trade is the ratio of a country’s export prices to its import prices.
Higher energy profits also support investment, jobs and government revenue, which lifts demand for Canadian dollars. Rising oil can push inflation higher as well, increasing the odds that the BoC raises rates. Higher rates tend to attract foreign capital into the currency.
Why it has weakened
Scotiabank’s April 2026 analysis found the oil-CAD relationship had weakened materially over the previous decade. The bank’s economists concluded the cause of an oil move matters more than the move itself. A demand-led rally, driven by strong global growth, tends to help CAD. A supply shock, driven by war or disruption, can hurt growth and send investors toward the US dollar instead.
| Interpretation | Oil move | Likely CAD effect | Current relevance |
|---|---|---|---|
| Commodity | Demand-led rally | Supportive | Limited; recent gains were supply-driven |
| Supply shock | War-driven rally | Subdued or negative | High; Middle East risk premium remains |
| Rate | Oil lifts Fed expectations more than BoC | Negative | Relevant ahead of 28 October |
| Risk sentiment | Geopolitical escalation | Negative as USD gains safe-haven demand | Relevant if post-election strikes return |
Apply that to today. Reuters put Brent at $114.51, down 1.89%, and WTI at $101.04, down 2.16%, on 26 October. FXStreet cited Brent near $110.30. The gap likely reflects different timestamps or contracts, but both sources show a fall of roughly 2% on the day.
The driver is diplomacy. Qatari negotiators reached Tehran on 25 October, and President Trump reportedly ruled out new strikes before the 3 November midterms, though post-election options remain under consideration. Houthi attacks on Saudi infrastructure keep a risk premium in crude.
The old link has not vanished. In July 2026, CAD weakened as oil fell, and RBC chief technical strategist George Davis attributed part of that move to crude. The read for you is narrower, though: when oil falls on diplomacy rather than weak demand, expect only a modest CAD reaction, and do not over-weight crude headlines.
The oil-CAD correlation has fallen from roughly 0.88 before 2018 to near zero over 2025-2026, which is why a 2% slide in crude produces only a muted loonie response and why investors should weight rate signals more heavily.
What do the Fed and Bank of Canada decisions mean for the pair?
If oil’s pull is fading, rate expectations fill the gap. Wednesday delivers both sides of that equation at once.
The Fed’s target range sits at 3.75%-4.00% after a unanimous 25 basis point hike in September. A basis point is one hundredth of a percentage point. CME FedWatch data, via Mitrade, shows about 90.6% odds of a pause this week and about 79.7% odds of a hike in December.
A Reuters poll lines up closely: 94 of 100 economists expect an October hold, and all 100 expect a December hike. US headline consumer price inflation reached 3.7% year on year in September, with core at 2.6%.
Forward guidance from the New York Fed John Williams, President of the Federal Reserve Bank of New York, said in late September that one further increase “may be appropriate late this year,” depending on incoming data.
North of the border, the split is sharper. The BoC holds its overnight rate at 2.25%, while Canadian inflation rose to 3.1% in September, just above the bank’s 1%-3% control range. Reuters reported markets pricing a hold, yet economists it polled expect a hike to 2.50%.
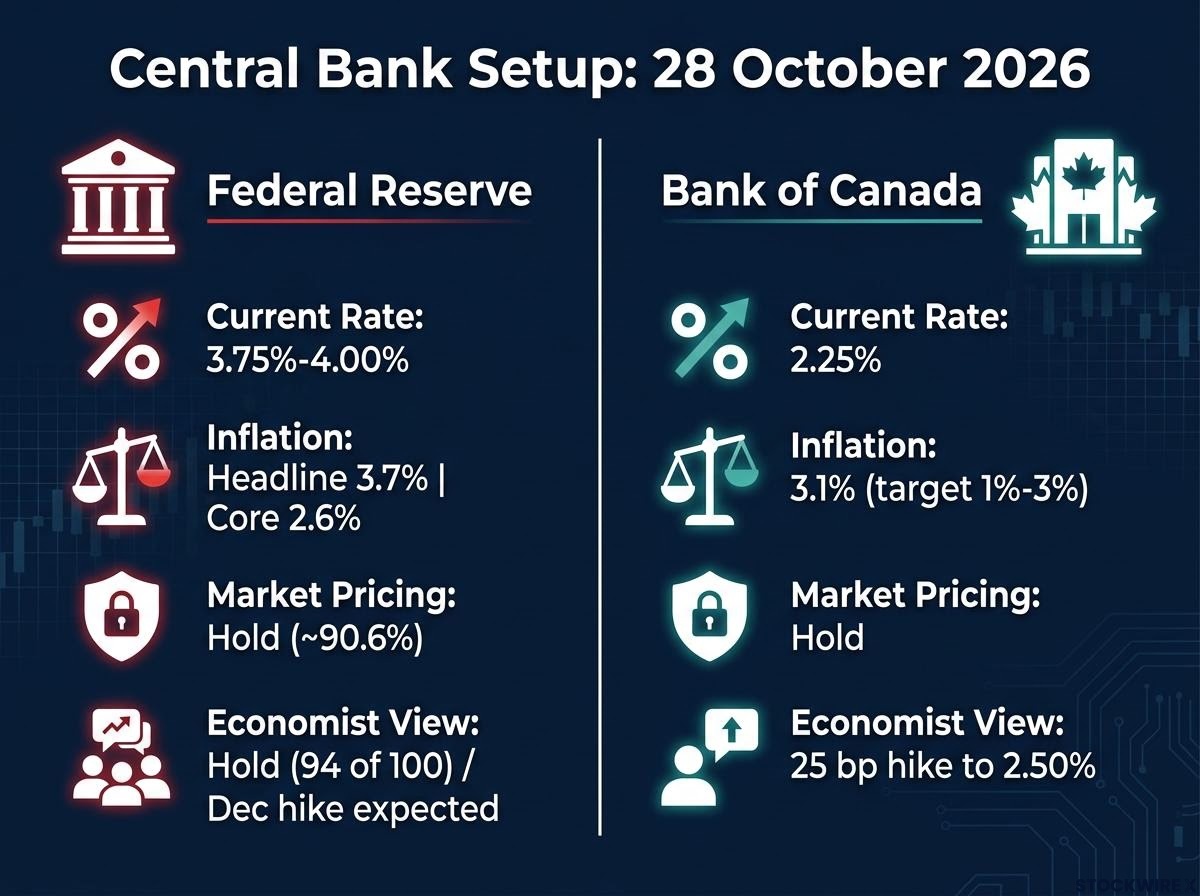
| Central bank | Current rate | Market pricing for 28 Oct | Economist view |
|---|---|---|---|
| Federal Reserve | 3.75%-4.00% | Hold (about 90.6%) | Hold; December hike expected |
| Bank of Canada | 2.25% | Hold | 25 bp hike to 2.50% |
What moves USD/CAD is the gap between the two rates, not either bank alone. A BoC hike paired with a Fed hold narrows that gap and favours CAD. A BoC hold paired with hawkish Fed language widens it.
The two-year US-Canada yield spread has narrowed from 158 bps to about 152 bps since the 18-month high near 1.4295, and the pair has eased in step, which shows how closely USD/CAD tracks rate differentials.
Either outcome is plausible. Because a Fed hold is almost fully priced, you should watch the statement’s tone on December rather than the headline decision. The BoC’s next meeting is not until 9 December.
Which USD/CAD levels are traders watching?
Rate outcomes set direction; chart levels show where that direction might stall. FXStreet’s AI-assisted technical read maps the range from the top down.
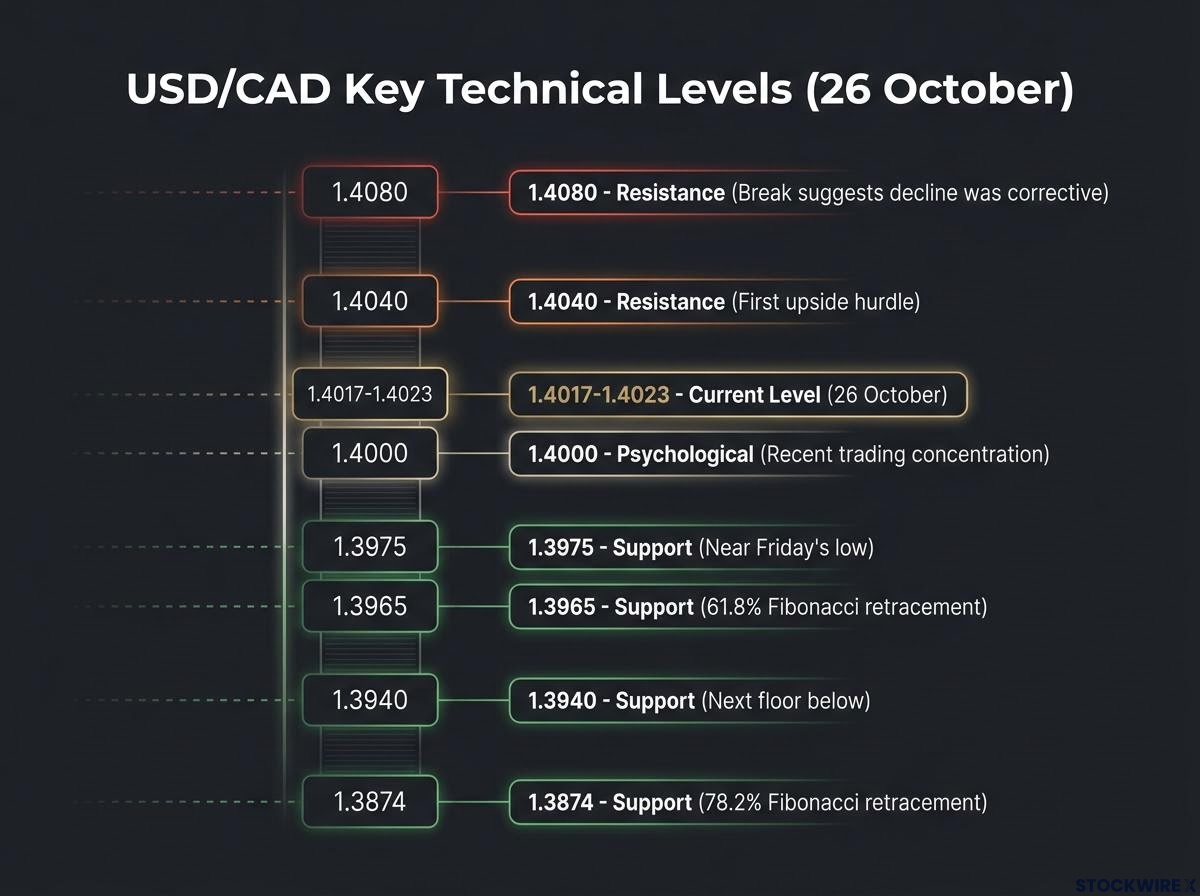
| Level | Type | Why it matters |
|---|---|---|
| About 1.4080 | Resistance | A break suggests the two-week decline was corrective |
| About 1.4040 | Resistance | First upside hurdle |
| 1.4000 | Psychological | Where recent trading has concentrated |
| About 1.3975 | Support | Near Friday’s low |
| 1.3965 | Support | 61.8% Fibonacci retracement |
| About 1.3940 | Support | Next floor below |
| 1.3874 | Support | 78.2% Fibonacci retracement |
A Fibonacci retracement measures how much of a prior move has been reversed, using set ratios that traders watch as potential turning points. Here, 1.3965 marks a 61.8% pullback of the September-October rally. Other October coverage cited 1.4030 as a 50% Fibonacci support; that figure likely reflects a different swing measurement.
A sustained break below 1.3965 would favour a deeper CAD recovery. A move above 1.4080 would suggest the slide was a correction within a larger dollar uptrend.
The signals disagree. Friday printed a hammer candle, a pattern with a long lower wick that can hint at buyers stepping in. Momentum tells a different story:
- RSI (14): below 40. The Relative Strength Index gauges the speed of recent price moves; readings under 40 lean bearish.
- MACD: deep in negative territory. The moving average convergence divergence indicator tracks trend momentum.
Those readings suggest rallies may stay shallow unless 1.4080 gives way. Treat the bounce as a test of resistance, and expect false breaks around Wednesday’s announcements.
Bull-CAD or bear-CAD: the scenarios that decide the next move
Step back from the daily chart and the institutional view leans towards CAD strength. Scotiabank forecasts USD/CAD at 1.37 for Q4 2026 and 1.33 for Q4 2027, citing narrowing rate differentials and eventual Fed easing. Deutsche Bank, ING and MUFG sit around 1.32-1.34, while Canadian banks span a wider 1.37-1.45.
Near-term risks pull the other way. The bull-CAD case rests on the Fed nearing the end of its cycle while Canadian inflation pushes the BoC to tighten. The bear-CAD case relies on a December Fed hike, firm US data, a geopolitical shock or tariff pressure.
Tariff-driven structural pressure is a further reason crude gains fail to translate into CAD strength, since 50% US duties on about $20 billion of Canadian goods erode the trade-balance benefit oil would normally provide.
| Scenario | Trigger | USD/CAD effect | Level to watch |
|---|---|---|---|
| Bull-CAD | BoC hikes, Fed signals caution | Lower | 1.3965 |
| Bear-CAD | Hawkish Fed guidance, BoC holds | Higher | 1.4080 |
| Geopolitical shock | Post-election US strike options revived | Higher on safe-haven demand | 1.4080 |
| Trade pressure | US-Canada tariffs | Higher | Above 1.40 |
The gap between those bank targets and a 1.40 handle tells you the market is pricing near-term dollar support. A forecast for late 2026 is not a timeline for this week. Key dates include 3 November and 9 December.
Past performance does not guarantee future results. Financial projections are subject to market conditions and various risk factors.
CAD against the other majors, in context
FXStreet’s currency heat map for 26 October shows how relative a currency’s strength is:
- CAD +0.29% vs JPY
- CAD +0.26% vs NZD
- CAD +0.12% vs GBP
- CAD +0.10% vs CHF
- CAD +0.04% vs AUD
- CAD +0.03% vs EUR
- USD +0.10% vs CAD
CAD edged up against every major except the US dollar. Its biggest gain came against the yen, which has tended to underperform in this environment. The lesson for forex learners: a falling USD/CAD print reflects US dollar strength as much as Canadian dollar weakness.
What to watch after Wednesday’s double decision
The bounce is real, but it sits inside a downtrend. Oil’s influence on CAD is weaker than headlines imply, and rate guidance now outweighs the rate decisions themselves.
Three variables will shape the next move:
- Fed guidance on December: a firm signal for a hike would support the dollar.
- The BoC decision against economist expectations: a hike narrows the rate gap in CAD’s favour.
- A break of 1.3965 or 1.4080: either would show which side of the range has won.
If the BoC hikes and the Fed sounds cautious, the downtrend has room to resume. If the reverse happens, the two-week slide may prove corrective.
This article is for informational purposes only and should not be considered financial advice. Investors should conduct their own research and consult with financial professionals before making investment decisions.