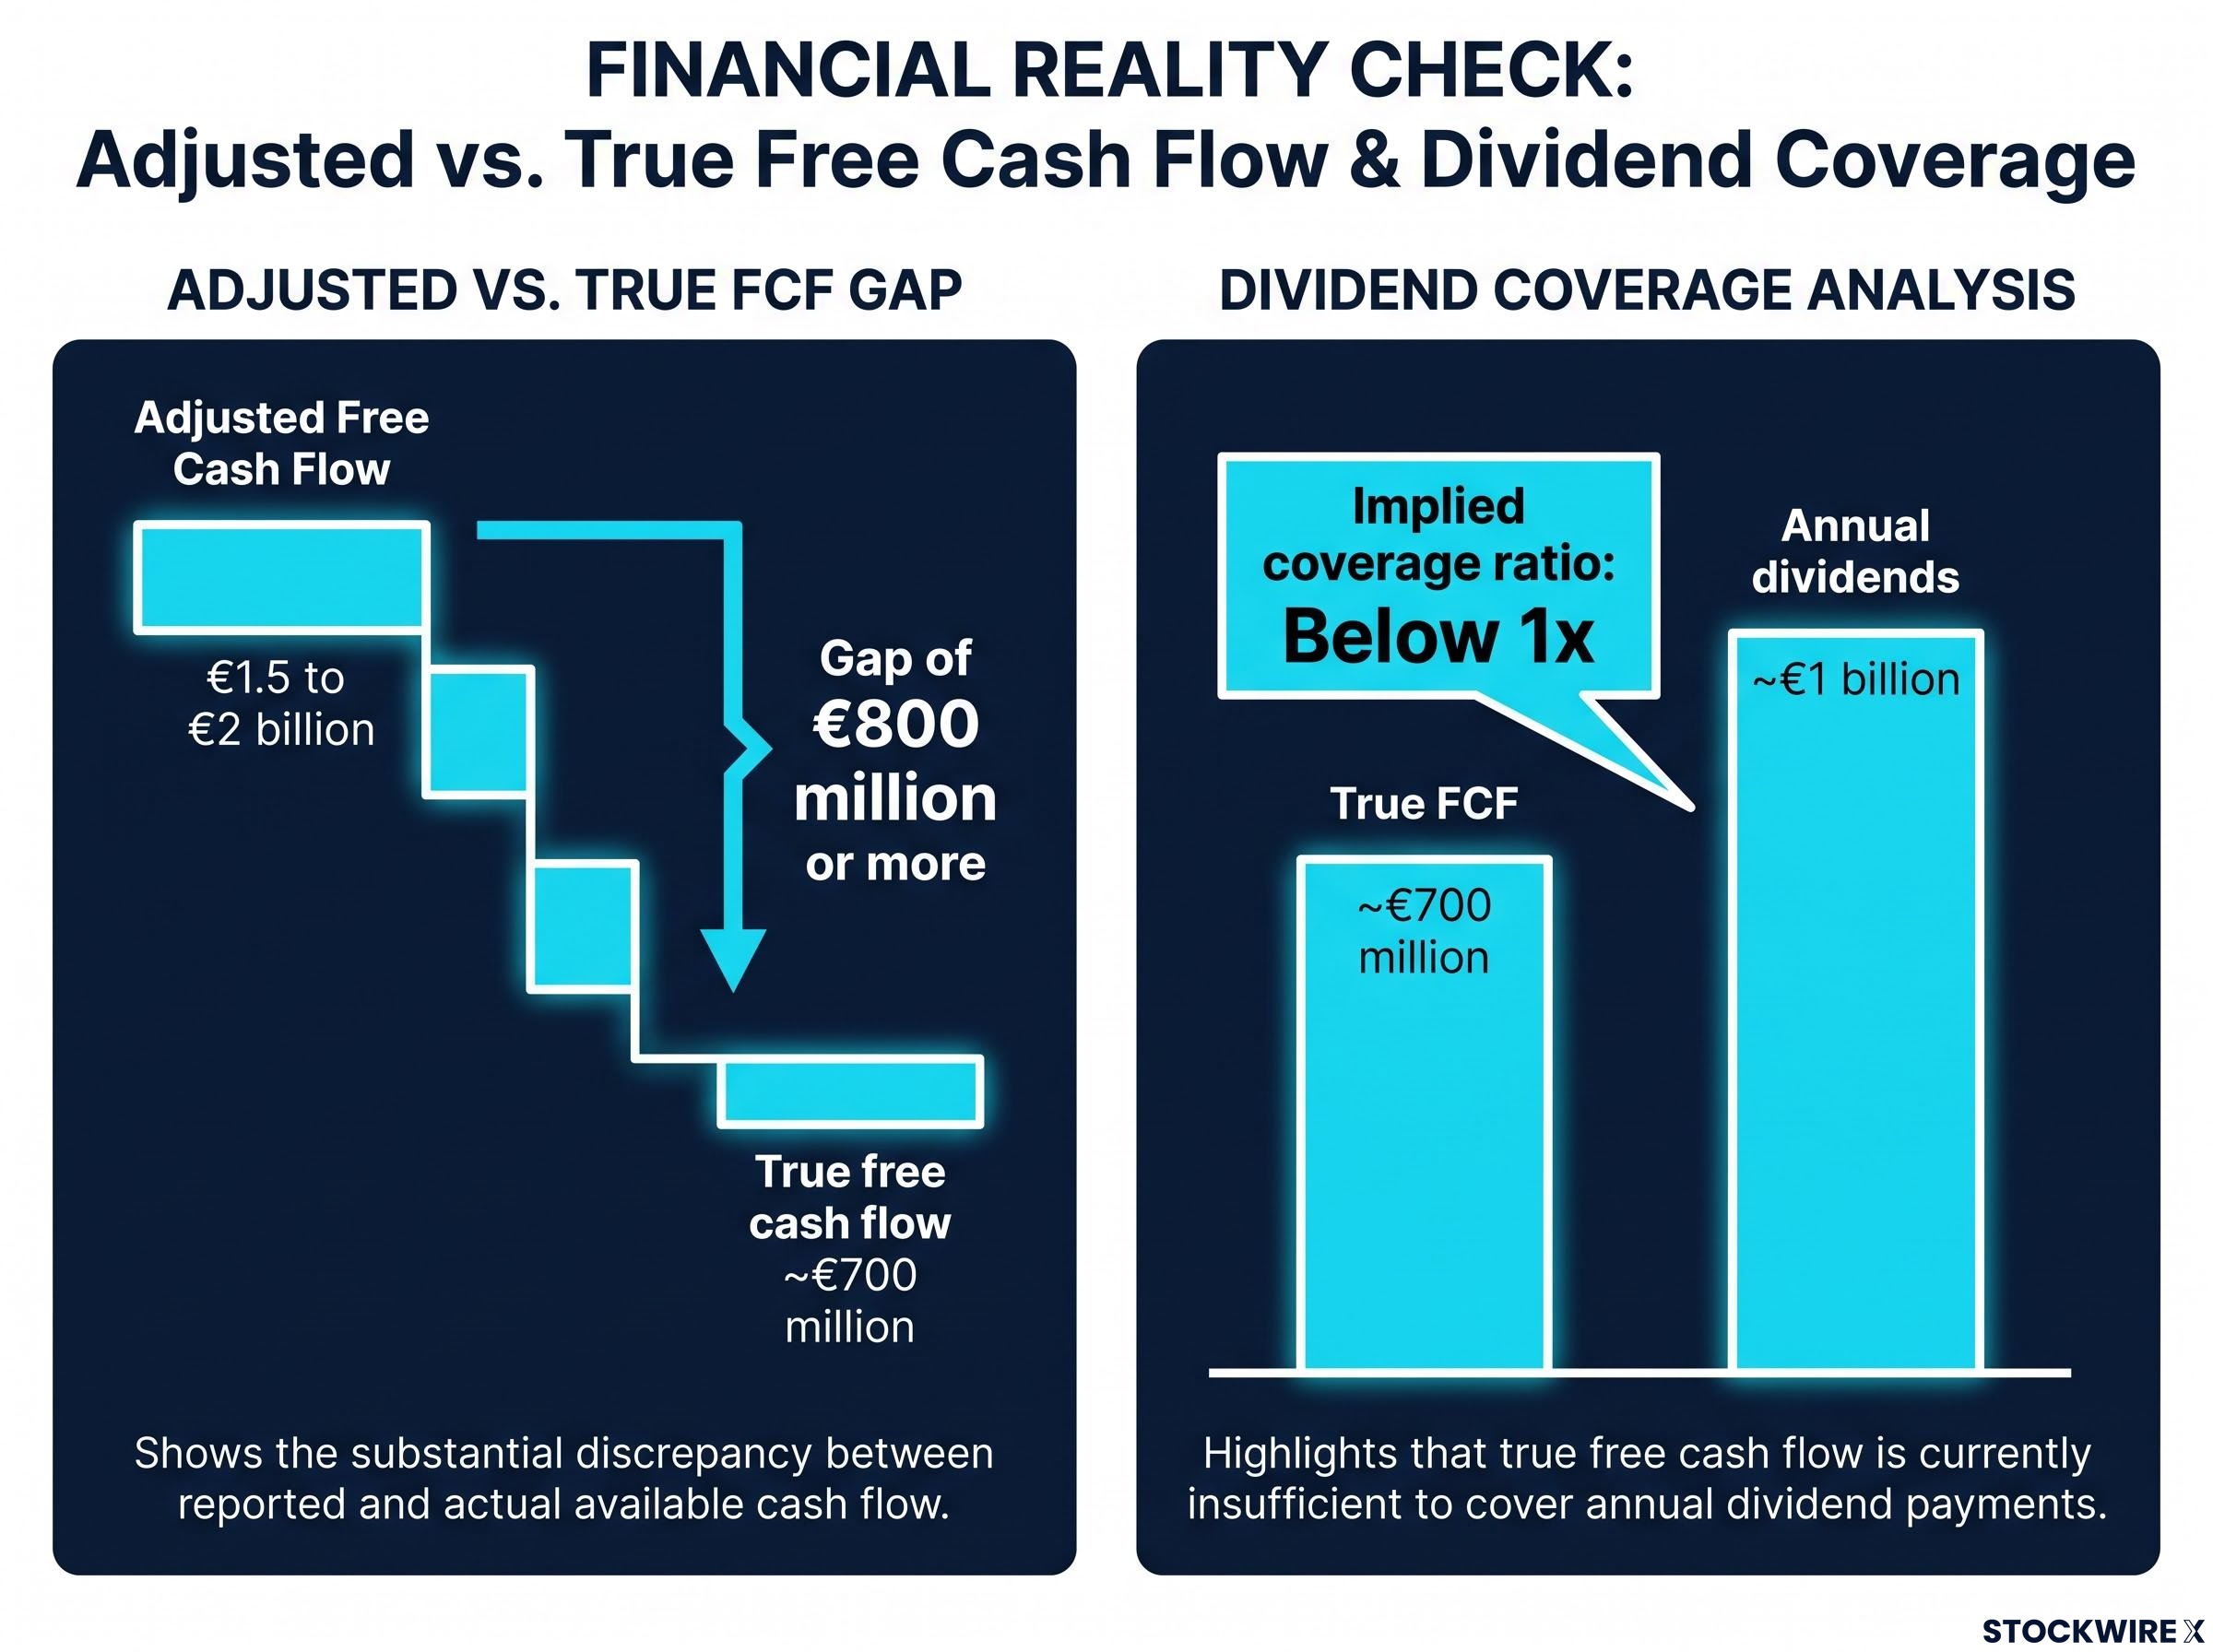
Universal Music Group tells you it generated adjusted free cash flow of roughly €1.5 to €2 billion a year. The cash that actually left after strategic investments was closer to €700 million. That is not a rounding error; it is a gap of €800 million or more, and it changes how you read the dividend, the balance sheet, and the stock entirely.
This matters even if you never buy a single UMG share. As one of the largest music rights businesses in the world, UMG pays around €1 billion in annual dividends and recently completed a $775 million acquisition. The distance between what it reports and what it genuinely generates is an object lesson in how asset-heavy, acquisition-driven companies build their own financial narratives. The same mechanics show up at film studios, streaming platforms, and any business that treats content spending as something other than a core cost of staying in business.
Here is the practical skill you will walk away with: the three questions to ask about any company’s free cash flow figure before you accept it as a signal of financial health. UMG is the case study. The framework is the point.
What UMG actually reports, and where the gap appears
Start with the number as UMG presents it, and it looks orderly enough. The company reported free cash flow of €1,082 million for FY2023, then €523 million for FY2024, a decline of roughly 52% year on year. The 2024 Annual Report attributes the drop to two things: a €130 million fall in net cash from operating activities, and €429 million in higher investing outflows from greater strategic investment. Nothing about that framing raises an alarm on its own.
Then the restatement arrives.
On its Q2 FY2026 earnings call, UMG disclosed first-half 2026 free cash flow of just €24 million under a revised definition, down from €163 million in the restated first half of the prior year. Here is the detail that should stop you: the first-half 2025 figure was originally reported as an outflow of €179 million. Under the new definition, that same period became an inflow of €163 million. One definitional change flipped a cash outflow into a cash inflow, a swing of more than €340 million, on the same underlying business.
| Period | Reported free cash flow | Definition in use |
|---|---|---|
| FY2023 | €1,082 million | Prior definition |
| FY2024 | €523 million | Prior definition |
| 1H 2025 (original) | Outflow of €179 million | Prior definition |
| 1H 2025 (restated) | Inflow of €163 million | New definition |
| 1H 2026 | €24 million | New definition |
UMG did not frame this as a voluntary transparency upgrade. It changed the definition, in its own words, in response to shareholder feedback.
Rigorous earnings report analysis goes beyond the headline metrics: management authors press releases without auditor sign-off, strong figures lead, and guidance cuts are frequently buried in footnotes, the same structural bias that shapes how UMG’s free cash flow revision appeared in its Q2 FY2026 materials.
“In response to shareholder feedback” This is the phrase UMG used in its earnings materials to describe why it revised the free cash flow metric. Read plainly, it means investors had concluded the old figure overstated the cash genuinely available for dividends and buybacks.
That admission is the whole point. If a definition change can convert a €179 million outflow into a €163 million inflow in a single restatement, then the metric you were previously using to judge this company was measuring something materially different from what you assumed. Anyone who tracked UMG’s free cash flow across 2023 to 2025 was working with a number management has now effectively conceded misrepresented distributable cash.
When big ASX news breaks, our subscribers know first
How acquisition spending hides inside the free cash flow figure
The gap is not an accident, and it is not fraud. It is the predictable result of how these companies book their spending. Once you see the mechanism, you understand why the gap is structurally built in rather than occasionally slipping through.
Work through it in four layers.
- Acquisitions get classified as investing, not operating. Catalog purchases and corporate deals sit in the investing section of the cash flow statement. That lets a company report healthy operating cash flow while committing hundreds of millions to acquisitions that quietly reduce the net cash left for shareholders.
- Adjusted definitions carve strategic spending out of the headline. Non-IFRS free cash flow measures can treat acquisitions as separate strategic investments. The result is a strong adjusted figure sitting next to a far smaller true surplus.
- Amortisation gets added back. Acquisitions are capitalised as intangible assets and amortised over years. That amortisation depresses reported earnings but flatters cash flow, because most free cash flow calculations add the non-cash charge back, even though the cash left the business in full, upfront, on day one.
- The dividend inherits the risk. When a company explicitly links free cash flow to dividend capacity, a generous definition risks promising a payout the true cash generation cannot comfortably support.
UMG’s own definition is already broader than a simple operating-cash-flow-minus-capex calculation. Per its 2024 Annual Report, it takes net cash from operating activities, adds net cash from investing activities, then subtracts lease repayments, net interest paid, and other financing items. That construction matters, because the original source analysis reconstructed headline adjusted free cash flow at roughly €1.5 to €2 billion a year against an estimated true figure of about €700 million after all investments, a recurring gap of €800 million or more.
So when UMG reports adjusted free cash flow, you are looking at a figure engineered to display recurring earning power while the largest cash outflows sit in a column most headlines never quote.
What the conversion target does not tell you
On the Q2 FY2026 call, management reaffirmed a targeted free cash flow conversion range of 60 to 70%. That sounds precise. It is only meaningful if you know what it converts from.
The denominator is adjusted EBITDA, and “adjusted” is doing heavy lifting there. Adjusted EBITDA typically strips out share-based compensation, amortisation of acquired intangibles, and restructuring charges.
The median non-GAAP EPS already exceeds its GAAP counterpart by 25-30% across the S&P 500, and non-GAAP adjustments that exclude the same cost category year after year stop being one-time items and become a permanent filter on reported performance, exactly the dynamic at work when adjusted EBITDA strips out amortisation of acquired intangibles every quarter.
If both the numerator (free cash flow) and the denominator (adjusted EBITDA) are constructed figures, the conversion ratio describes a relationship between two adjusted metrics. It is not a window onto cash the company physically holds. Treat it as a management benchmark, not proof of dividend safety.
The Downtown deal as a live stress test of capital discipline
Now put the mechanics to work. The Downtown Music Holdings acquisition is not just a news item; it is a diagnostic you can run yourself, and it arrives at a sceptical conclusion on its own numbers.
Here are the facts to work from.
- Price: $775 million in cash, roughly €737 million
- Structure: Acquired via UMG’s independent division, Virgin Music Group
- Announced: 16 December 2024
- Completed: 20 February 2026, following EU conditional approval on 13 February 2026
- EU condition: UMG required to divest Downtown’s royalty-services platform
- Post-close contribution: No EBITDA or revenue figures disclosed
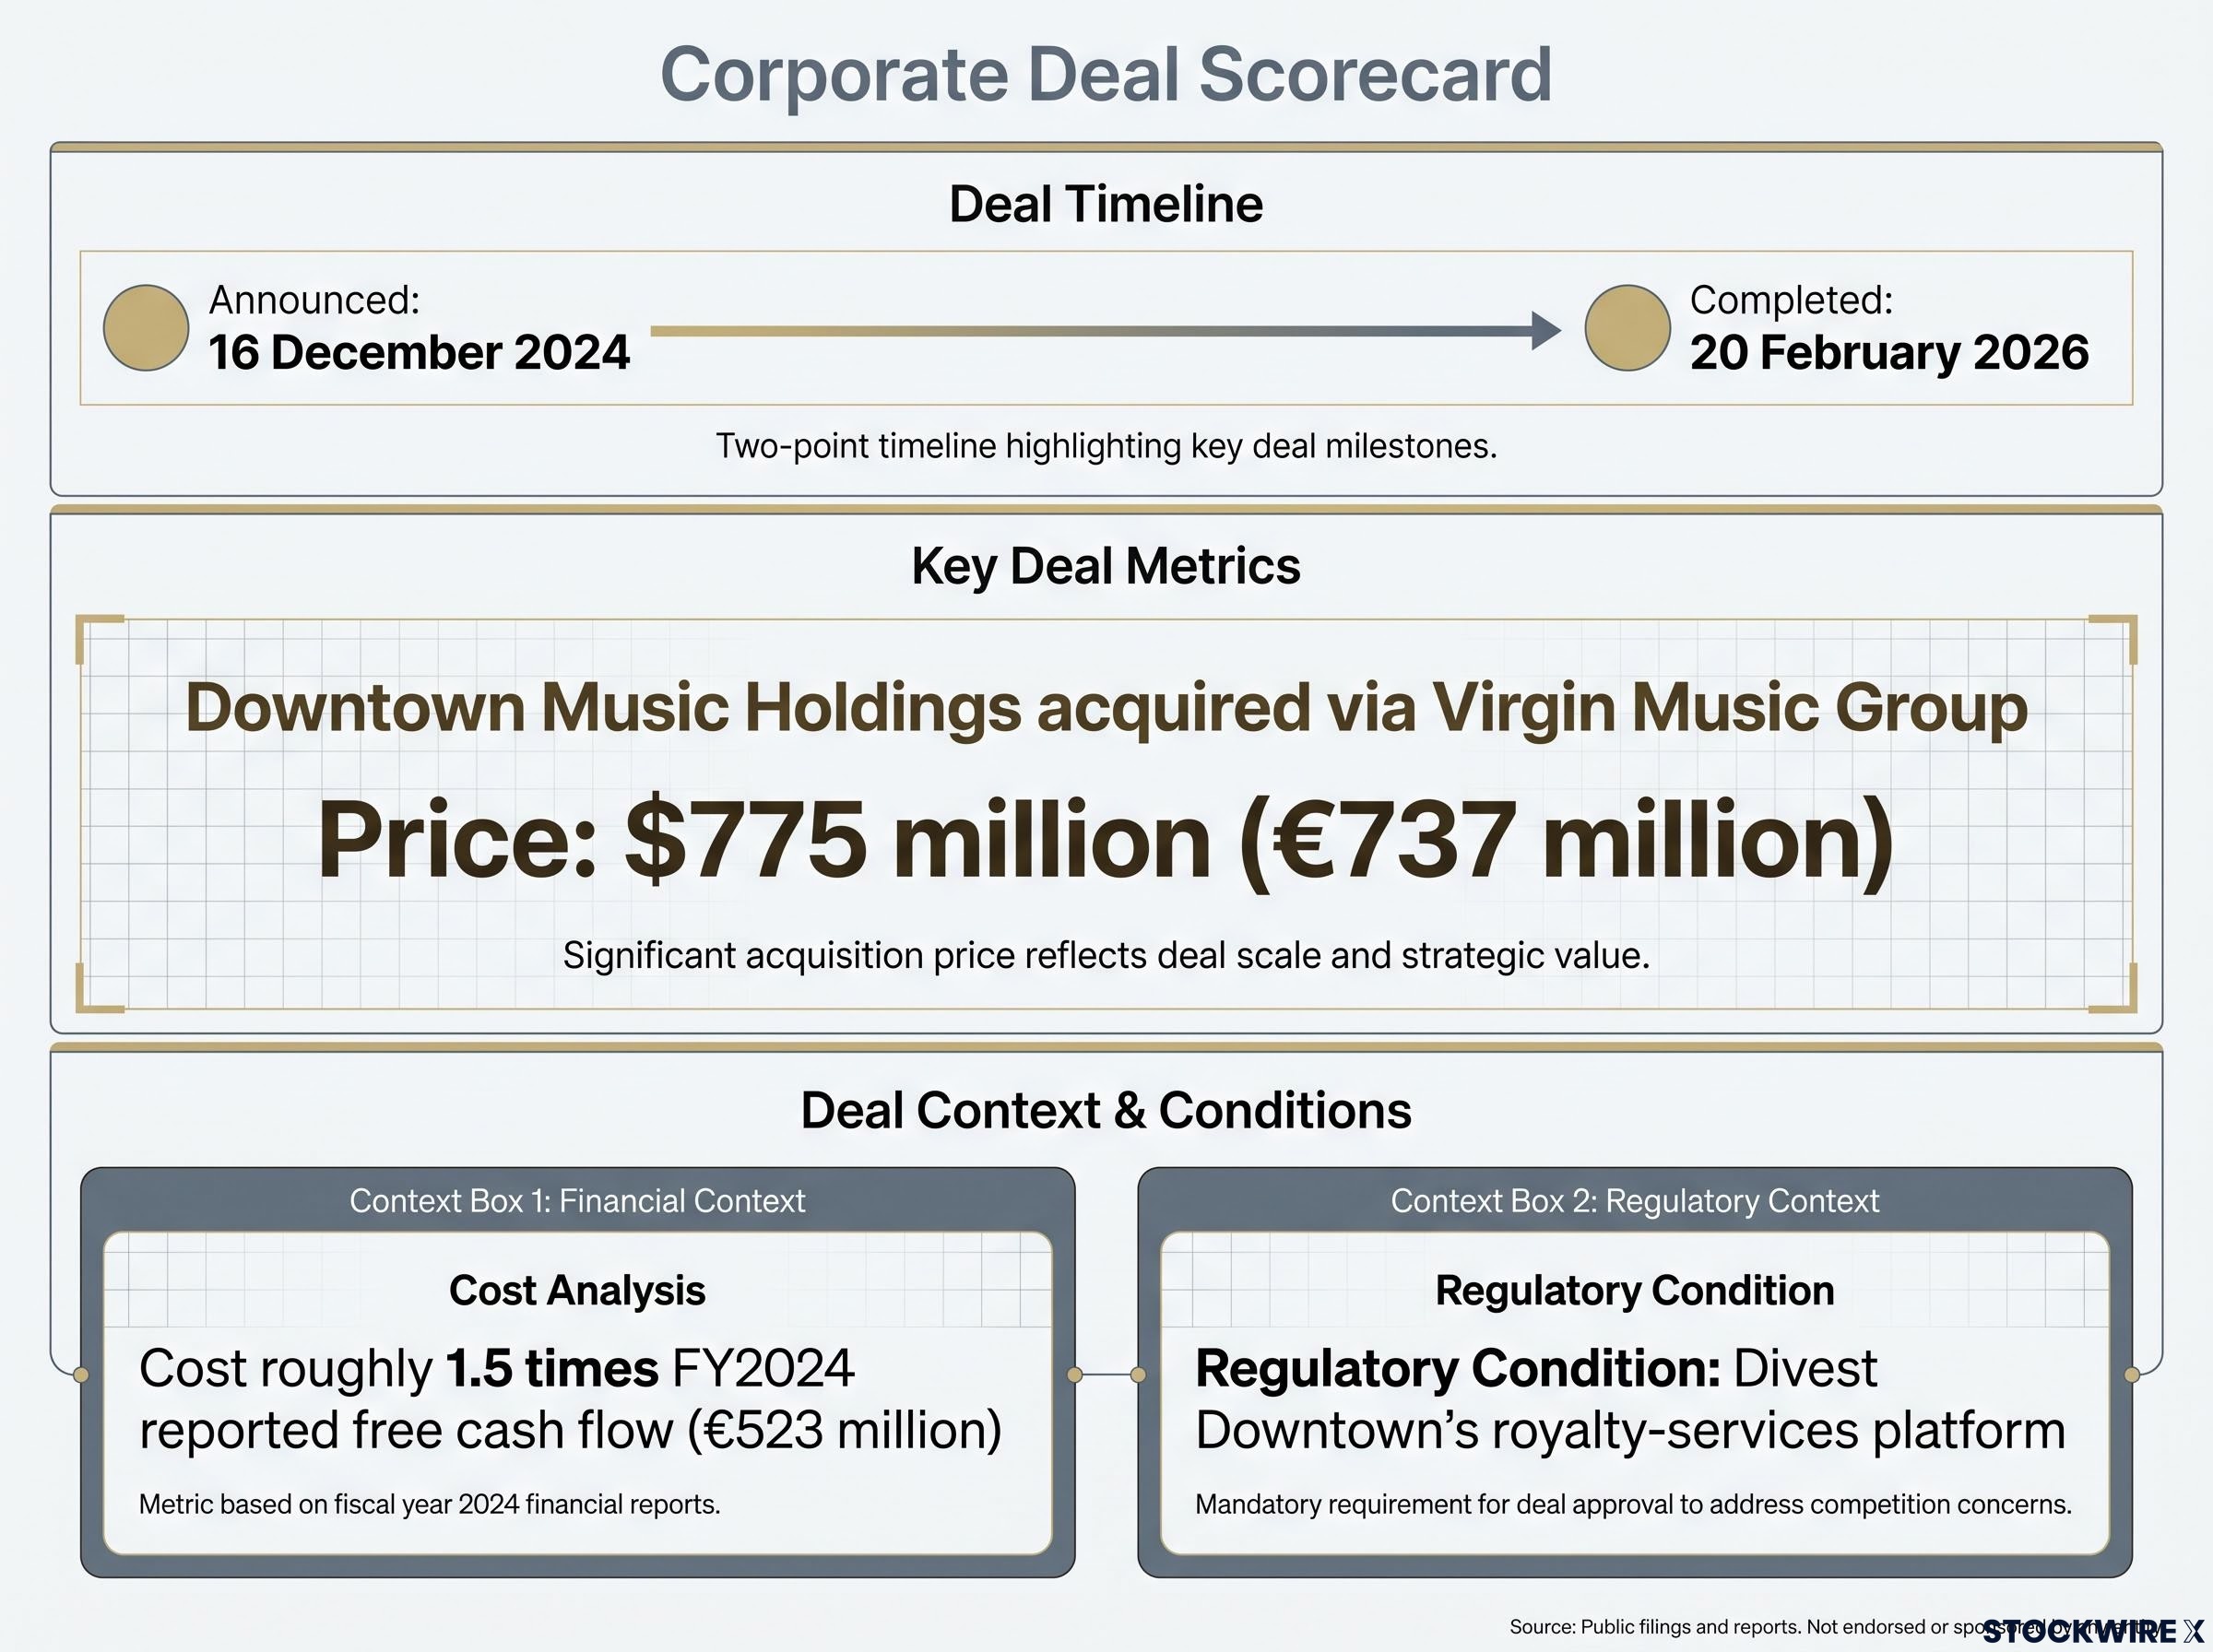
Set the price against UMG’s own cash generation. At $775 million (about €737 million), the deal cost roughly 1.5 times the company’s entire FY2024 reported free cash flow of €523 million. And the original source analysis noted Downtown was bought against a very low EBITDA base, meaning UMG paid a high multiple for limited near-term earnings, precisely when its own reported free cash flow was falling sharply.
The regulatory condition tightens the case further. The European Commission required UMG to sell Downtown’s royalty-services platform, the exact component most relevant to independent-label concerns about market power. That divestiture narrows the deal’s scope and may temper the synergies UMG can capture.
From €5.4 billion to nearly €13 billion The original source analysis found UMG’s total liabilities grew from approximately €5.4 billion to nearly €13 billion over the period preceding the analysis. That expansion happened while the company continued paying around €1 billion a year in dividends.
Paying roughly 1.5 times a full year’s reported free cash flow for a low-EBITDA asset, during a period when that free cash flow was both declining and under definitional revision, is exactly the sort of capital allocation call that rewards scrutiny over headline acceptance. Worth flagging plainly: no post-close earnings contribution has been disclosed, so the return on that price remains an open question. The same three-part test, deal price against reported and true free cash flow, multiple against near-term earnings, and regulatory limits on synergy, applies to any future UMG deal or any comparable acquisition elsewhere.
Reading UMG’s dividend and return profile against the true cash position
None of this makes UMG a value trap. It also does not make it a clean income stock. The honest read sits in between, and the numbers let you calibrate rather than pick a side.
The original source analysis estimated a total annual return of roughly 8%: about 3.7% dividend yield plus roughly 4% dividend growth. That is reasonable, not exceptional, for a business whose true cash coverage of its own dividend needs watching.
The coverage question is the one to hold firmly. If true free cash flow after all investments is around €700 million and annual dividends run near €1 billion, the coverage ratio sits below 1x. Alongside estimated annual share repurchases of roughly €1 billion, part-funded by Spotify stake sale proceeds, that is a lot of capital return leaning on cash the stricter measure does not fully generate.
| Component | Estimate |
|---|---|
| Dividend yield | ~3.7% |
| Dividend growth | ~4% |
| Total estimated return | ~8% |
| True FCF after all investments | ~€700 million |
| Annual dividends | ~€1 billion |
| Implied coverage ratio | Below 1x |
Sub-1x coverage is not automatically unsustainable. It does mean you have to hold management to account on acquisition discipline and operating cash flow growth, rather than treating the 60 to 70% conversion range as a proxy for dividend safety.
The FCF payout ratio, calculated as dividends divided by free cash flow rather than reported earnings, is the primary dividend sustainability signal a four-pillar screening framework applies: ratios persistently near or above 100% are a red flag even when the income statement looks healthy, which is precisely the condition the UMG numbers describe.
Three developments would genuinely shift the case.
- A lower price. The original source analysis flagged a dividend yield near 10% as the threshold at which UMG would represent compelling absolute value, a meaningful step below current levels.
- A US listing and potential S&P 500 inclusion. This could broaden the investor base and support a re-rating.
- A genuinely improving metric. Evidence that the definition change is followed by real improvement in underlying cash generation, not just a cleaner presentation of the same economics.
The distinction between those last two matters. A re-rating catalyst lifts sentiment. Only the third condition tells you the actual cash has improved.
Past performance does not guarantee future results. Financial projections are subject to market conditions and various risk factors, and the return estimates above are drawn from a single source analysis rather than company guidance.
Three questions to ask before trusting any company’s free cash flow figure
Everything above distils into three questions you can carry to any asset-heavy, acquisition-driven, or IP-focused business you analyse.
- Does the free cash flow definition include or exclude material acquisition spending? If large deals sit outside the headline, the figure overstates what is left for you as a shareholder.
- Are there non-IFRS adjustments that carve recurring strategic investment out of the headline? Recurring spend dressed as one-off strategic investment inflates the number you are meant to trust.
- Does the dividend or buyback require coverage above 1x against the stricter figure, not the adjusted one? If it does not, the payout is leaning on cash the business may not reliably generate.
A company that clears all three offers a free cash flow figure you can provisionally trust. A company that fails one or more requires you to rebuild “owner earnings” from first principles before forming any view on income safety or capital discipline. These questions apply just as well to film studios, streaming platforms, and any business that capitalises significant content or catalog spend.
Applied to UMG: a worked example
- Question one: UMG’s broader definition still leaves major catalog and deal spending in a separate column, so the headline overstates distributable cash. Fails.
- Question two: Adjusted free cash flow of €1.5 to €2 billion versus true free cash flow near €700 million shows strategic spend carved out. Fails.
- Question three: True free cash flow of roughly €700 million against dividends of about €1 billion puts coverage below 1x. Fails.
What should change before UMG’s headline figures earn more trust
You do not need a buy or sell verdict here. You need a watch list, because UMG is three stories at once, and they pull in different directions.
It is a dividend-paying income stock, an acquisition-driven growth story, and a company mid-revision of its primary cash flow metric. Do not default to whichever narrative management leads with in a given quarter. Hold all three.
Metric omissions are a distinct signal worth tracking separately from restatements: when a company quietly stops disclosing a KPI that appeared in prior earnings releases, the absence itself is data, and cross-referencing cash flow against the income statement over consecutive quarters often surfaces deterioration before it enters the headline numbers.
Three observable conditions would shift the current assessment.
- Acquisition spending moderating relative to operating cash flow growth. Restraint here would ease the sub-1x coverage tension directly.
- The new definition improving across multiple reporting periods. A genuine upward trend, not just a restated historical baseline, would signal real cash generation.
- Post-close disclosure on Downtown’s EBITDA contribution. That figure, when it lands, will clarify whether the deal economics justify the price paid.
Two ongoing risks belong on the same list: the EU-mandated divestiture of Downtown’s royalty-services platform, which threatens integration synergies, and the 60 to 70% conversion target, which is only reassuring if its adjusted EBITDA denominator is stable or improving.
The 10% yield marker The original source analysis identified a dividend yield near 10% as the level at which UMG’s valuation would adequately compensate for the cash flow uncertainty. Keep it as a personal reference point.
A US listing and possible S&P 500 inclusion could support the share price regardless of any cash flow improvement. That is a sentiment catalyst, not a fundamental one, and conflating the two is how investors talk themselves into a story the numbers do not yet support. The reader who tracks these signals is watching the right things. The one who accepts the next headline figure without checking the definition and the acquisition pipeline is repeating exactly the error this piece was built to correct.
This article is for informational purposes only and should not be considered financial advice. Investors should conduct their own research and consult with financial professionals before making investment decisions.