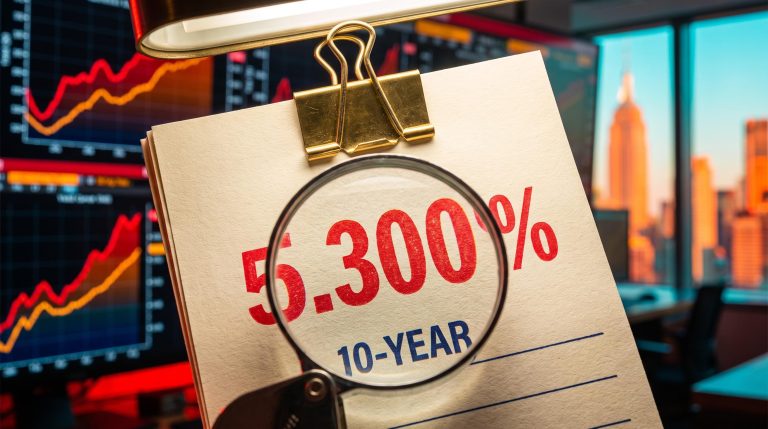
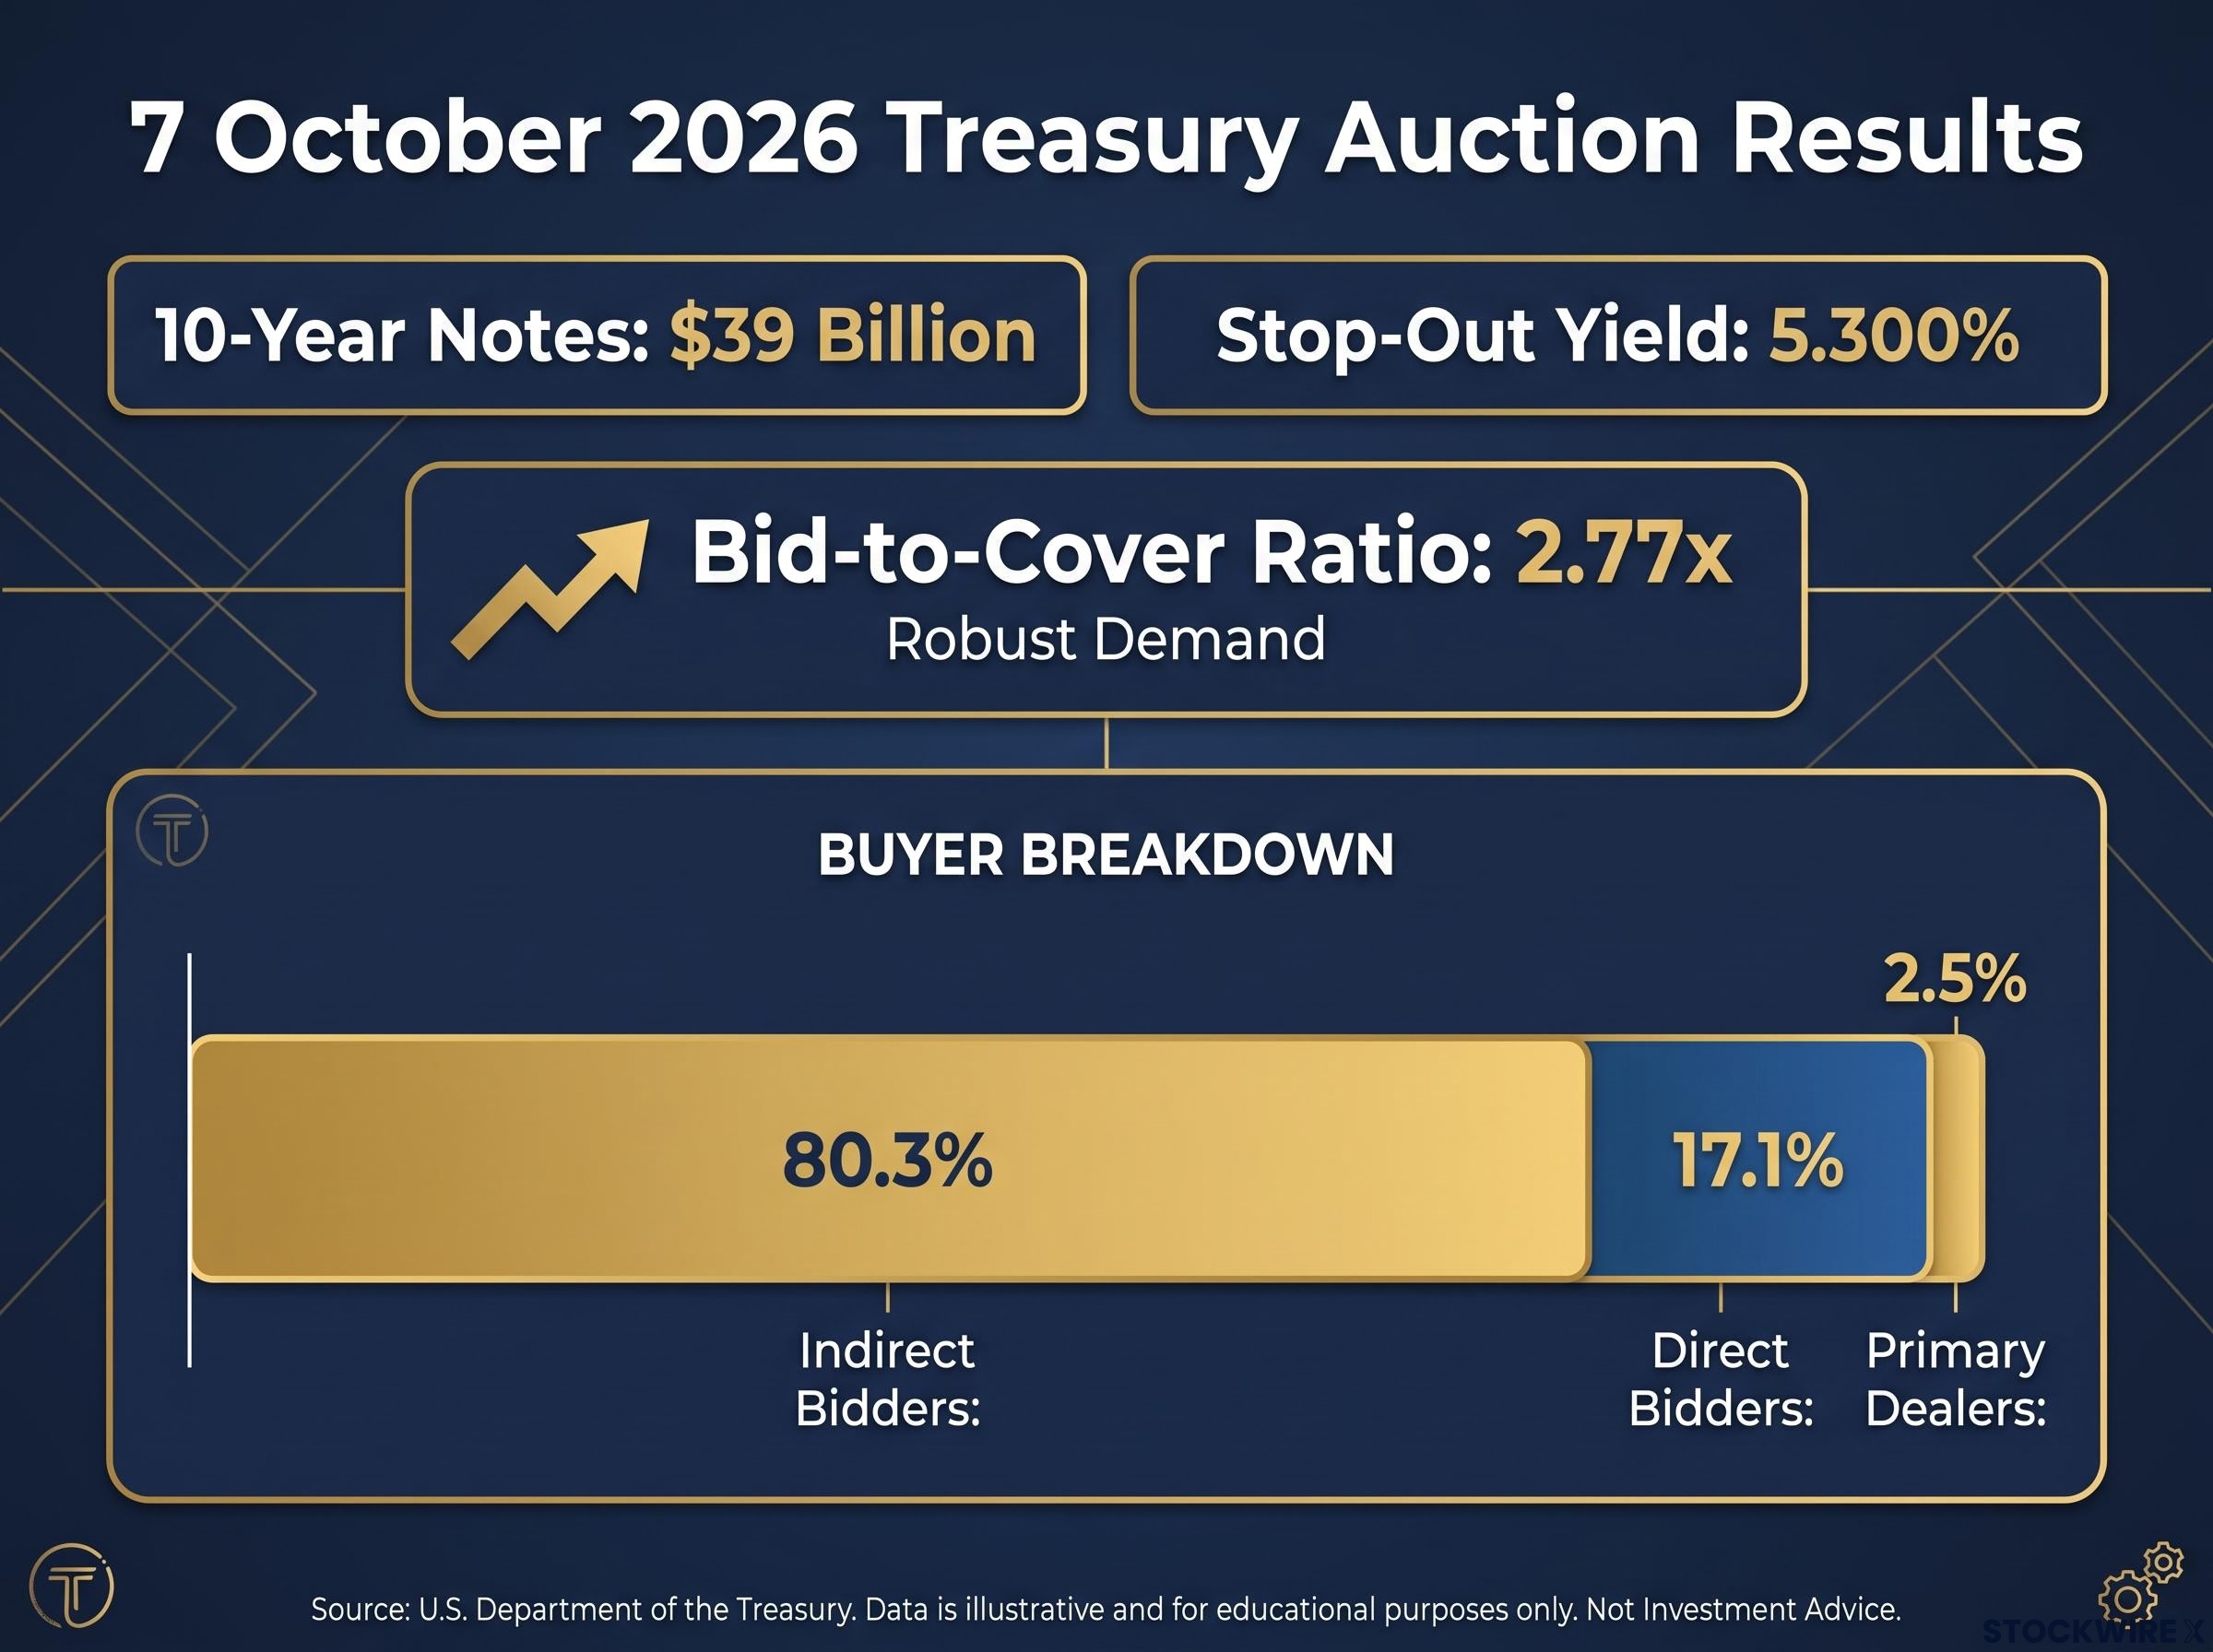
A strong Treasury auction usually reads as a sign that the bond selloff has found its floor. On 7 October 2026, the US Treasury sold $39 billion of 10-year notes at 5.300%, the highest stop-out yield since November 2000, and buyers still competed hard for the paper. This US Treasury yields analysis starts with a simple question: why are investors lining up at yields last seen in 2002, and what does that demand actually signal?
The stakes for a US portfolio are high. The 10-year yield has traded roughly between 5.28% and 5.35% in early October, the 30-year reached 5.67%, and the third quarter delivered the largest quarterly jump in 10-year yields since 1994.
The bond market is not moving alone. Brent crude sits near $101, copper supply is tight, and central banks keep buying gold, all in response to the same set of forces.
Here is a way to separate supply pressure from policy expectations, and to judge whether a 2.9% real yield is an opportunity or a warning.
Why have long-dated yields surged: supply, growth or the Fed?
The size of the move is not in dispute. CNBC reported the 10-year jumped about 7 basis points to 5.349% on 5 October, its highest since April 2002, before settling near 5.32% on 7 October. Some feeds put the intraday peak at 5.34-5.36%, a gap that reflects timing and data source rather than a different story.
The cause is the harder question, and two rival explanations compete for it.
The supply case
Crestwood Advisors argues that heavy Treasury issuance tied to the federal deficit has outrun investor demand, forcing auctions to clear at higher yields. AI hyperscalers add to the pressure. Their heavy spending on data centres has pushed corporate bond issuance higher, so companies and the government are competing for the same pool of buyers.
The fiscal arithmetic sharpens the concern. CNBC reported net interest costs of about $1.05 trillion over the first 11 months of fiscal 2026, feeding “debt spiral” fears now that yields sit above 5%. Investors respond by demanding more term premium, the extra yield required for locking money away for longer.
The growth and policy case
TD strategists, cited by CNBC, offer a different emphasis: stronger growth, expected Fed hikes, higher oil prices and fast-money repositioning. CNBC’s “no fiscal apocalypse” coverage found many strategists crediting the surge as much to a strong economy as to deficit worries.
| View | Evidence | Who argues it | Implication for term premium |
|---|---|---|---|
| Supply-driven | Deficit-led issuance, AI corporate debt, $1.05 trillion interest bill | Crestwood Advisors | Stays elevated regardless of Fed moves |
| Growth and policy-driven | Strong data, expected hikes, higher oil, repositioning | TD (via CNBC) | Could ease if growth cools |
Most analysts accept that both channels are working at once. The split still matters to you. If supply is doing most of the lifting, long yields can stay high even after the Fed pauses, so a Fed hold should not be read as automatic relief for long bonds, bond funds or rate-sensitive stocks.
A term premium driven by fiscal risk and heavy supply can tighten conditions on the Fed’s behalf, which is why long yields may stay elevated even when policymakers hold rates steady.
When big ASX news breaks, our subscribers know first
What did the 10-year auction and Fed pricing actually tell us?
That tension between supply and policy shows up clearly in the latest auction. On the surface, the result was reassuring.
| Measure | 7 October result | Versus prior six-auction average |
|---|---|---|
| Bid-to-cover ratio | 2.77x | 0.23 higher |
| Indirect bidders | 80.3% | Up 6.2 points |
| Direct bidders | 17.1% | Not reported |
| Primary dealers | 2.5% | Down 6.3 points |
The bid-to-cover ratio measures how much was bid relative to what was sold, so a higher number means deeper demand. Indirect bidders, typically foreign central banks and large asset managers, took the lion’s share, while primary dealers, the banks obliged to absorb unsold supply, were left with very little.
The bid-to-cover ratio and the stop-out yield are both products of the competitive auction process, which is also why a yield can keep rising after a strong auction: the secondary market reprices continuously.
One source also reported the auction cleared 1.7 basis points below the pre-auction when-issued yield, a “stop-through” that signals buyers paid up. That figure was not independently confirmed, so treat it as indicative.
The Fed picture is more tangled, and the key is separating time horizons:
- Next meeting: CME FedWatch priced roughly 82% odds of a hold after a lacklustre September jobs report, according to CNBC. Reuters reported on 2 October that Fed Vice Chair Philip Jefferson signalled patience following the 25 basis point hike in September.
- Next 12 months: FOMC minutes pointed to another hike without timing, and markets price three more hikes over the coming year.
Those readings are not contradictory. They describe a Fed that is slowing its pace, not stopping.
Strong indirect demand tells you large, patient buyers see 5.3% as value. That reduces the risk of a disorderly auction failure, but it does not put a ceiling on yields. Demand and rising yields can coexist when buyers simply require more compensation to step in.
Are 2.9% real yields a bargain or a warning sign?
That compensation is clearest in inflation-protected bonds. The 10-year Treasury Inflation-Protected Securities (TIPS) real yield closed at 2.92% on 7 October, touching close to 2.95% intraday.
A real yield is the return a bond pays above inflation. TIPS adjust their principal for changes in consumer prices, so the real yield is the income you lock in after inflation is accounted for.
Real yield snapshot 10-year TIPS: 2.92% on 7 October 2026, against a 52-week low of roughly 1.68%.
Value-oriented bond and multi-asset managers describe real yields of 2-3% as historically attractive compensation for inflation risk. That characterisation reflects a manager viewpoint and has not been independently confirmed.
Institutions remain divided on whether elevated real yields mark a cycle peak or structural reset, and that disagreement is itself a signal for anyone sizing duration exposure at these levels.
The case against rushing in rests on what could go wrong. A growth shock could hit equities and credit as high real yields force valuations lower. Sticky inflation could push real yields higher still, and the history of long-duration selloffs is not kind to leveraged holders.
| Episode | Trigger | What broke | Lesson |
|---|---|---|---|
| 1994 bond rout | Rapid Fed hikes, term premium repricing | Mortgage and credit markets | Policy shocks hit long duration fast |
| 2022 UK gilt crisis | Mini-budget sell-off in long gilts | Leveraged pension (LDI) strategies; Bank of England stepped in | Leverage turns a selloff into forced selling |
| 2023 US yield spike | “Higher for longer” and fiscal supply worries | Long bonds and growth stocks | Term premium can jump without a recession |
Many observers see 2026 as an amplified version of 2023, with bigger deficits and heavier issuance. The third quarter’s rise, the largest since 1994, puts that comparison in sharp relief.
For you, the trade-off is direct. Historically high real compensation is available today, but buying after a 24-year-high move in yields means accepting mark-to-market losses if yields keep climbing. A ladder of staggered maturities is one way some investors spread that timing risk. Past performance does not guarantee future results, and projections are subject to market conditions.
How are oil, copper, gold and French bonds reacting to the yield surge?
Real yields also explain why commodities look contradictory right now. Each asset is reacting to a different piece of the same story.
Oil and copper: inflation and supply
Oil rose 0.7% to near $101 a barrel, a level that matches Brent, while WTI has ranged between $88 and $96 in recent sessions. Reports that the White House asked the Pentagon for strike options against Iran keep geopolitical risk elevated. Higher oil feeds inflation expectations, which pushes nominal yields up, so oil and yields rising together is consistent rather than odd.
Copper gained 0.4% to about $6.59 per pound as a Chilean mine strike tightened supply. The structural story rests on electrification, grid expansion, EVs and AI data centres colliding with years of mine under-investment. For US investors looking abroad, Australian miners such as BHP, Sandfire, Rio Tinto and South32 carry that exposure, though the ASX 200 slipped 0.1%.
Gold and French spreads: the safe-haven pull
Gold fell overnight, which fits the textbook-free logic of opportunity cost: when inflation-protected bonds pay nearly 2.9%, a metal paying nothing looks less appealing. Yet the People’s Bank of China extended its buying to a 23rd consecutive month, though no official monthly figure has been published.
Europe adds another layer. French budget troubles widened the French-German 10-year spread by about 12 basis points, a reminder that fiscal stress is not only an American problem and a reason some buyers keep reaching for gold.
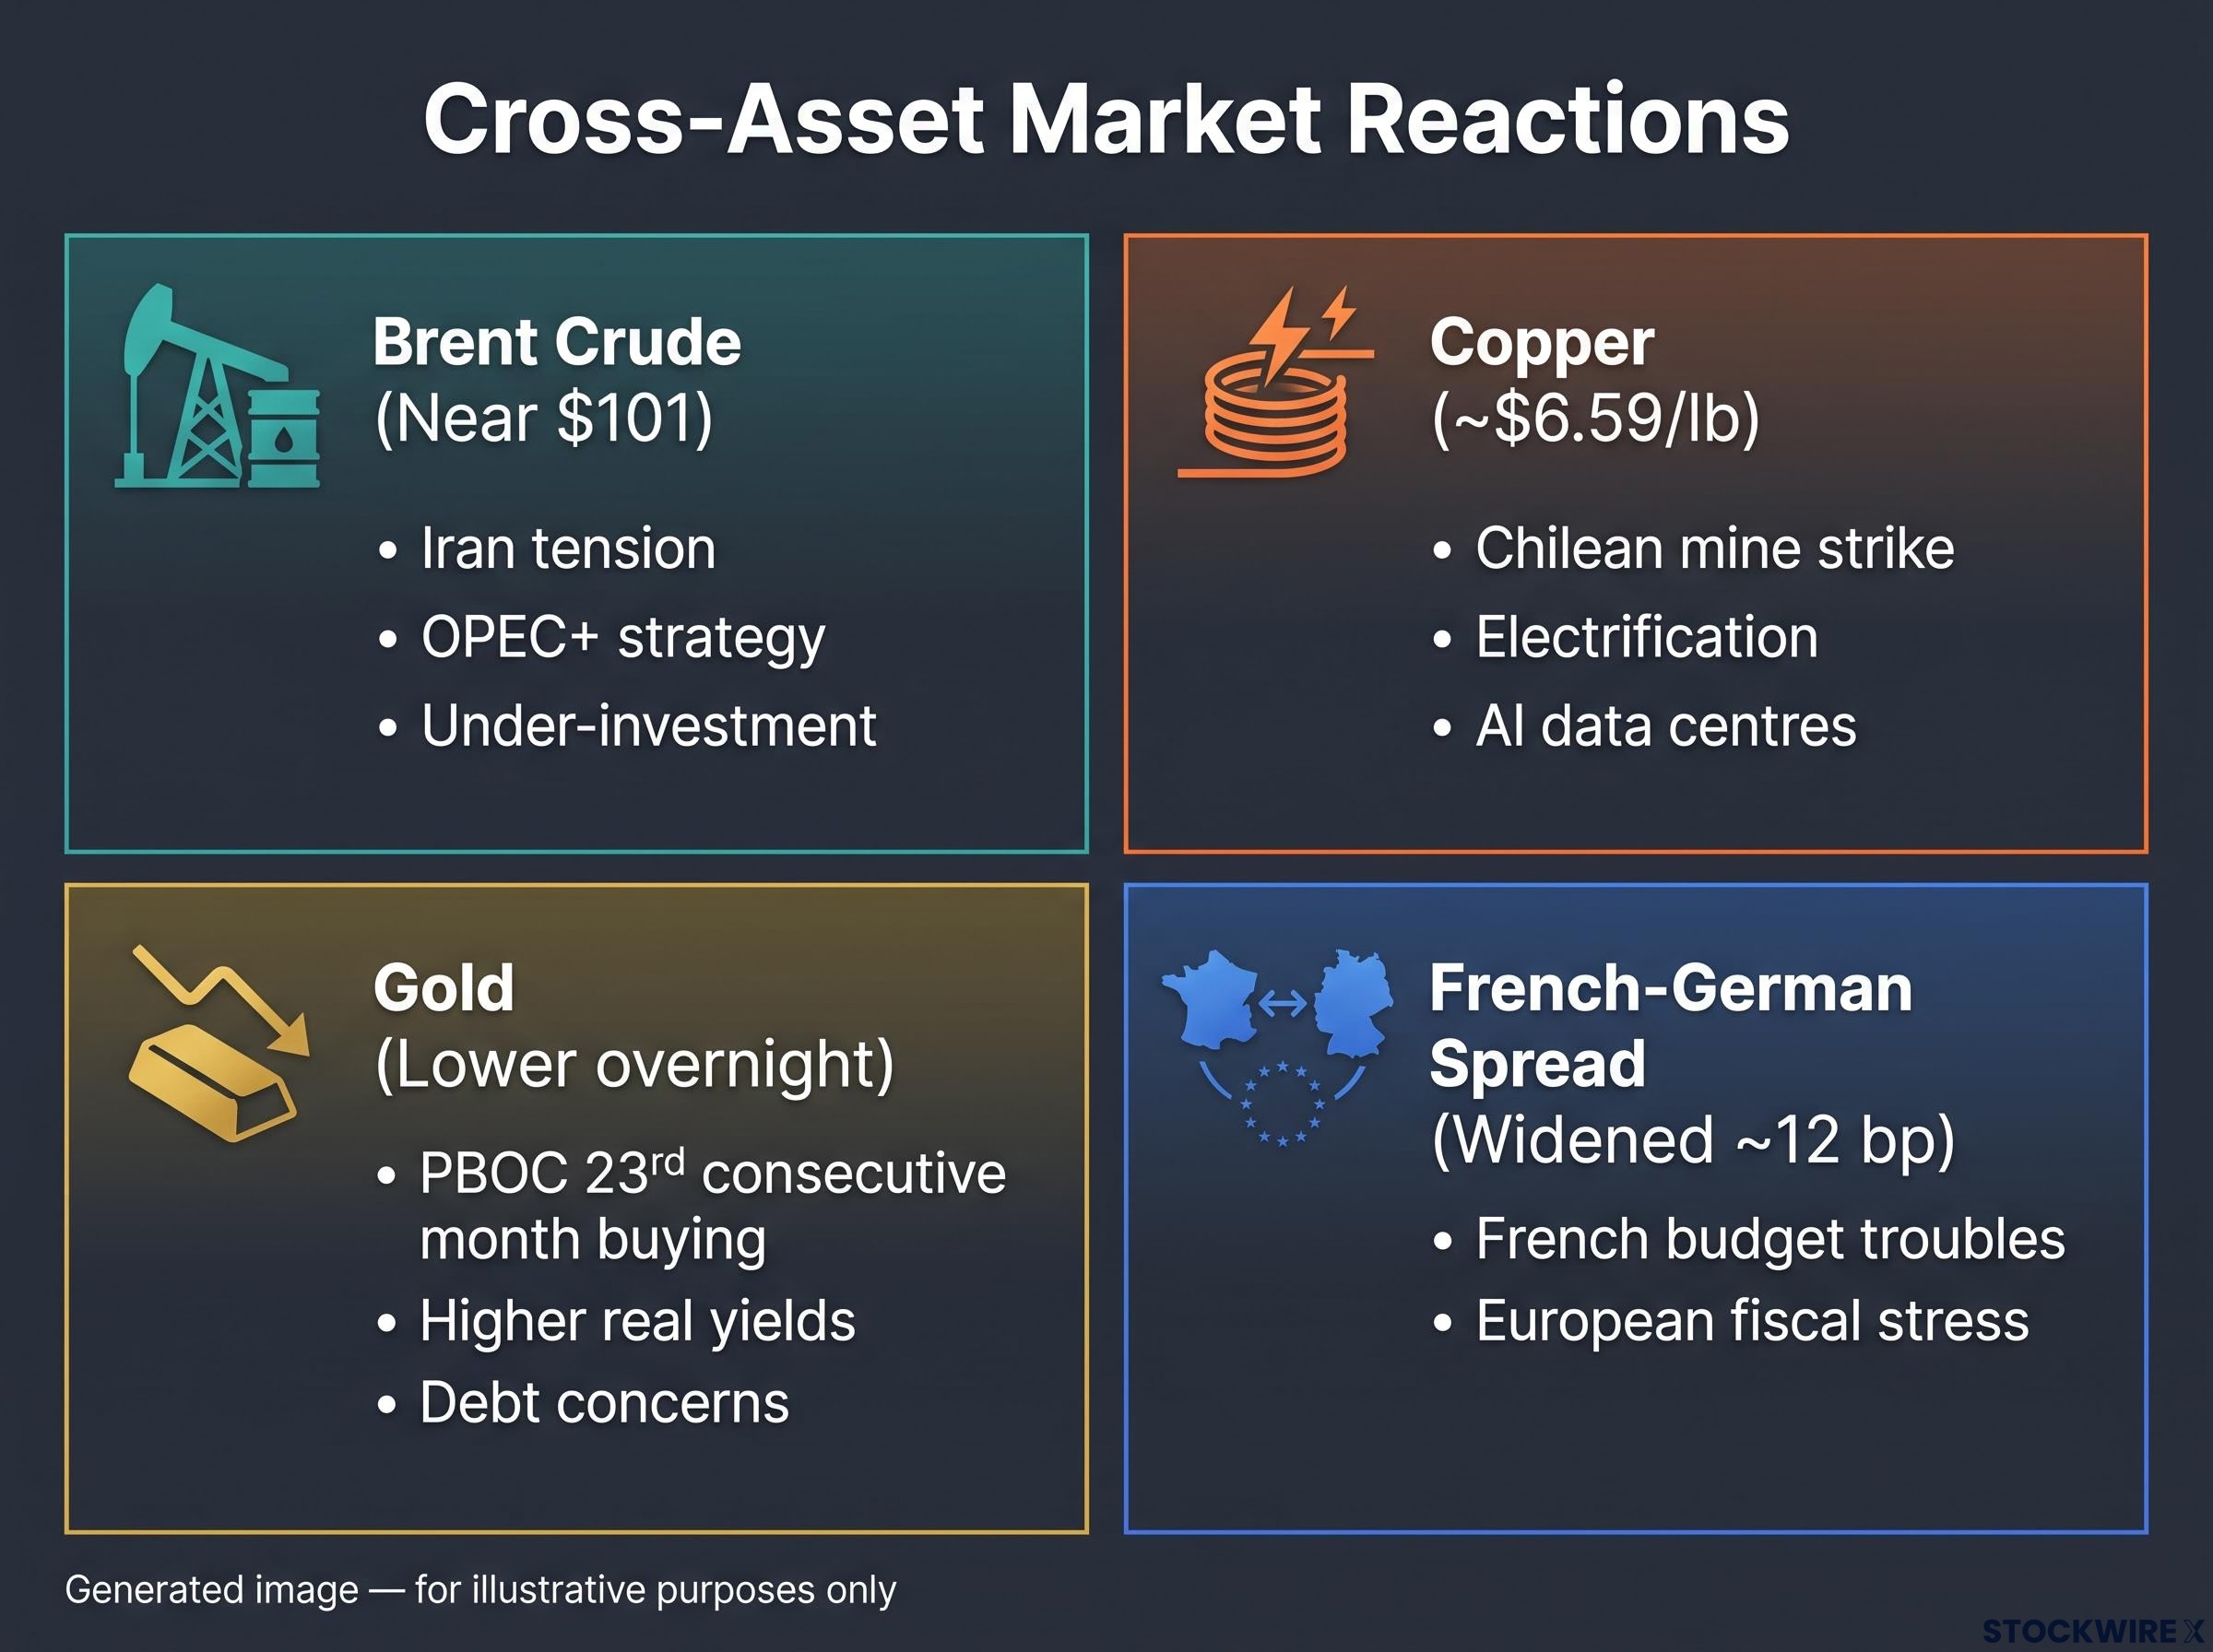
| Asset | Latest level | Near-term driver | Structural driver |
|---|---|---|---|
| Brent crude | Near $101 | Iran tension | OPEC+ strategy, under-investment |
| Copper | About $6.59/lb | Chilean mine strike | Electrification, AI data centres |
| Gold | Lower overnight | Higher real yields | Central-bank buying, debt concerns |
| French-German spread | Widened about 12 bp | French budget troubles | European fiscal stress |
Real assets are not one trade. Oil and copper reflect inflation and supply, while gold is pulled between real yields and central-bank demand, so commodity exposure may hedge part of the yield shock while adding risks of its own.
What the yield surge changes, and what it does not
Supply and policy expectations are both lifting yields. The auction shows buyers exist at 5.3%, but demand alone has not capped the move, and commodities are each responding to a different thread.
A longer historical lens offers a counterpoint to the alarm: yields near 5% sit close to pre-QE norms, which suggests part of the selloff is a return to the range that prevailed before central bank balance sheets expanded.
Three variables deserve your attention:
- The next Fed meeting: watch whether the gap between near-term hold pricing and 12-month hike pricing narrows.
- Upcoming auction demand: indirect participation and any tails will show whether buyers keep absorbing supply.
- Oil and Iran headlines: an escalation feeds straight into inflation expectations.
Through all of it, the real yield remains the anchor for weighing duration, income and risk in your portfolio.
This article is for informational purposes only and should not be considered financial advice. Investors should conduct their own research and consult with financial professionals before making investment decisions. Forward-looking statements are speculative and subject to change based on market developments.