A Democratic Congress is often treated as an automatic headwind for stocks. History suggests that view gets the timing wrong. Prediction markets give Democrats roughly a 90% chance of winning the House and better than 60% odds of sweeping both chambers, yet the market signal that has mattered most in past midterm cycles arrived after the votes were counted.
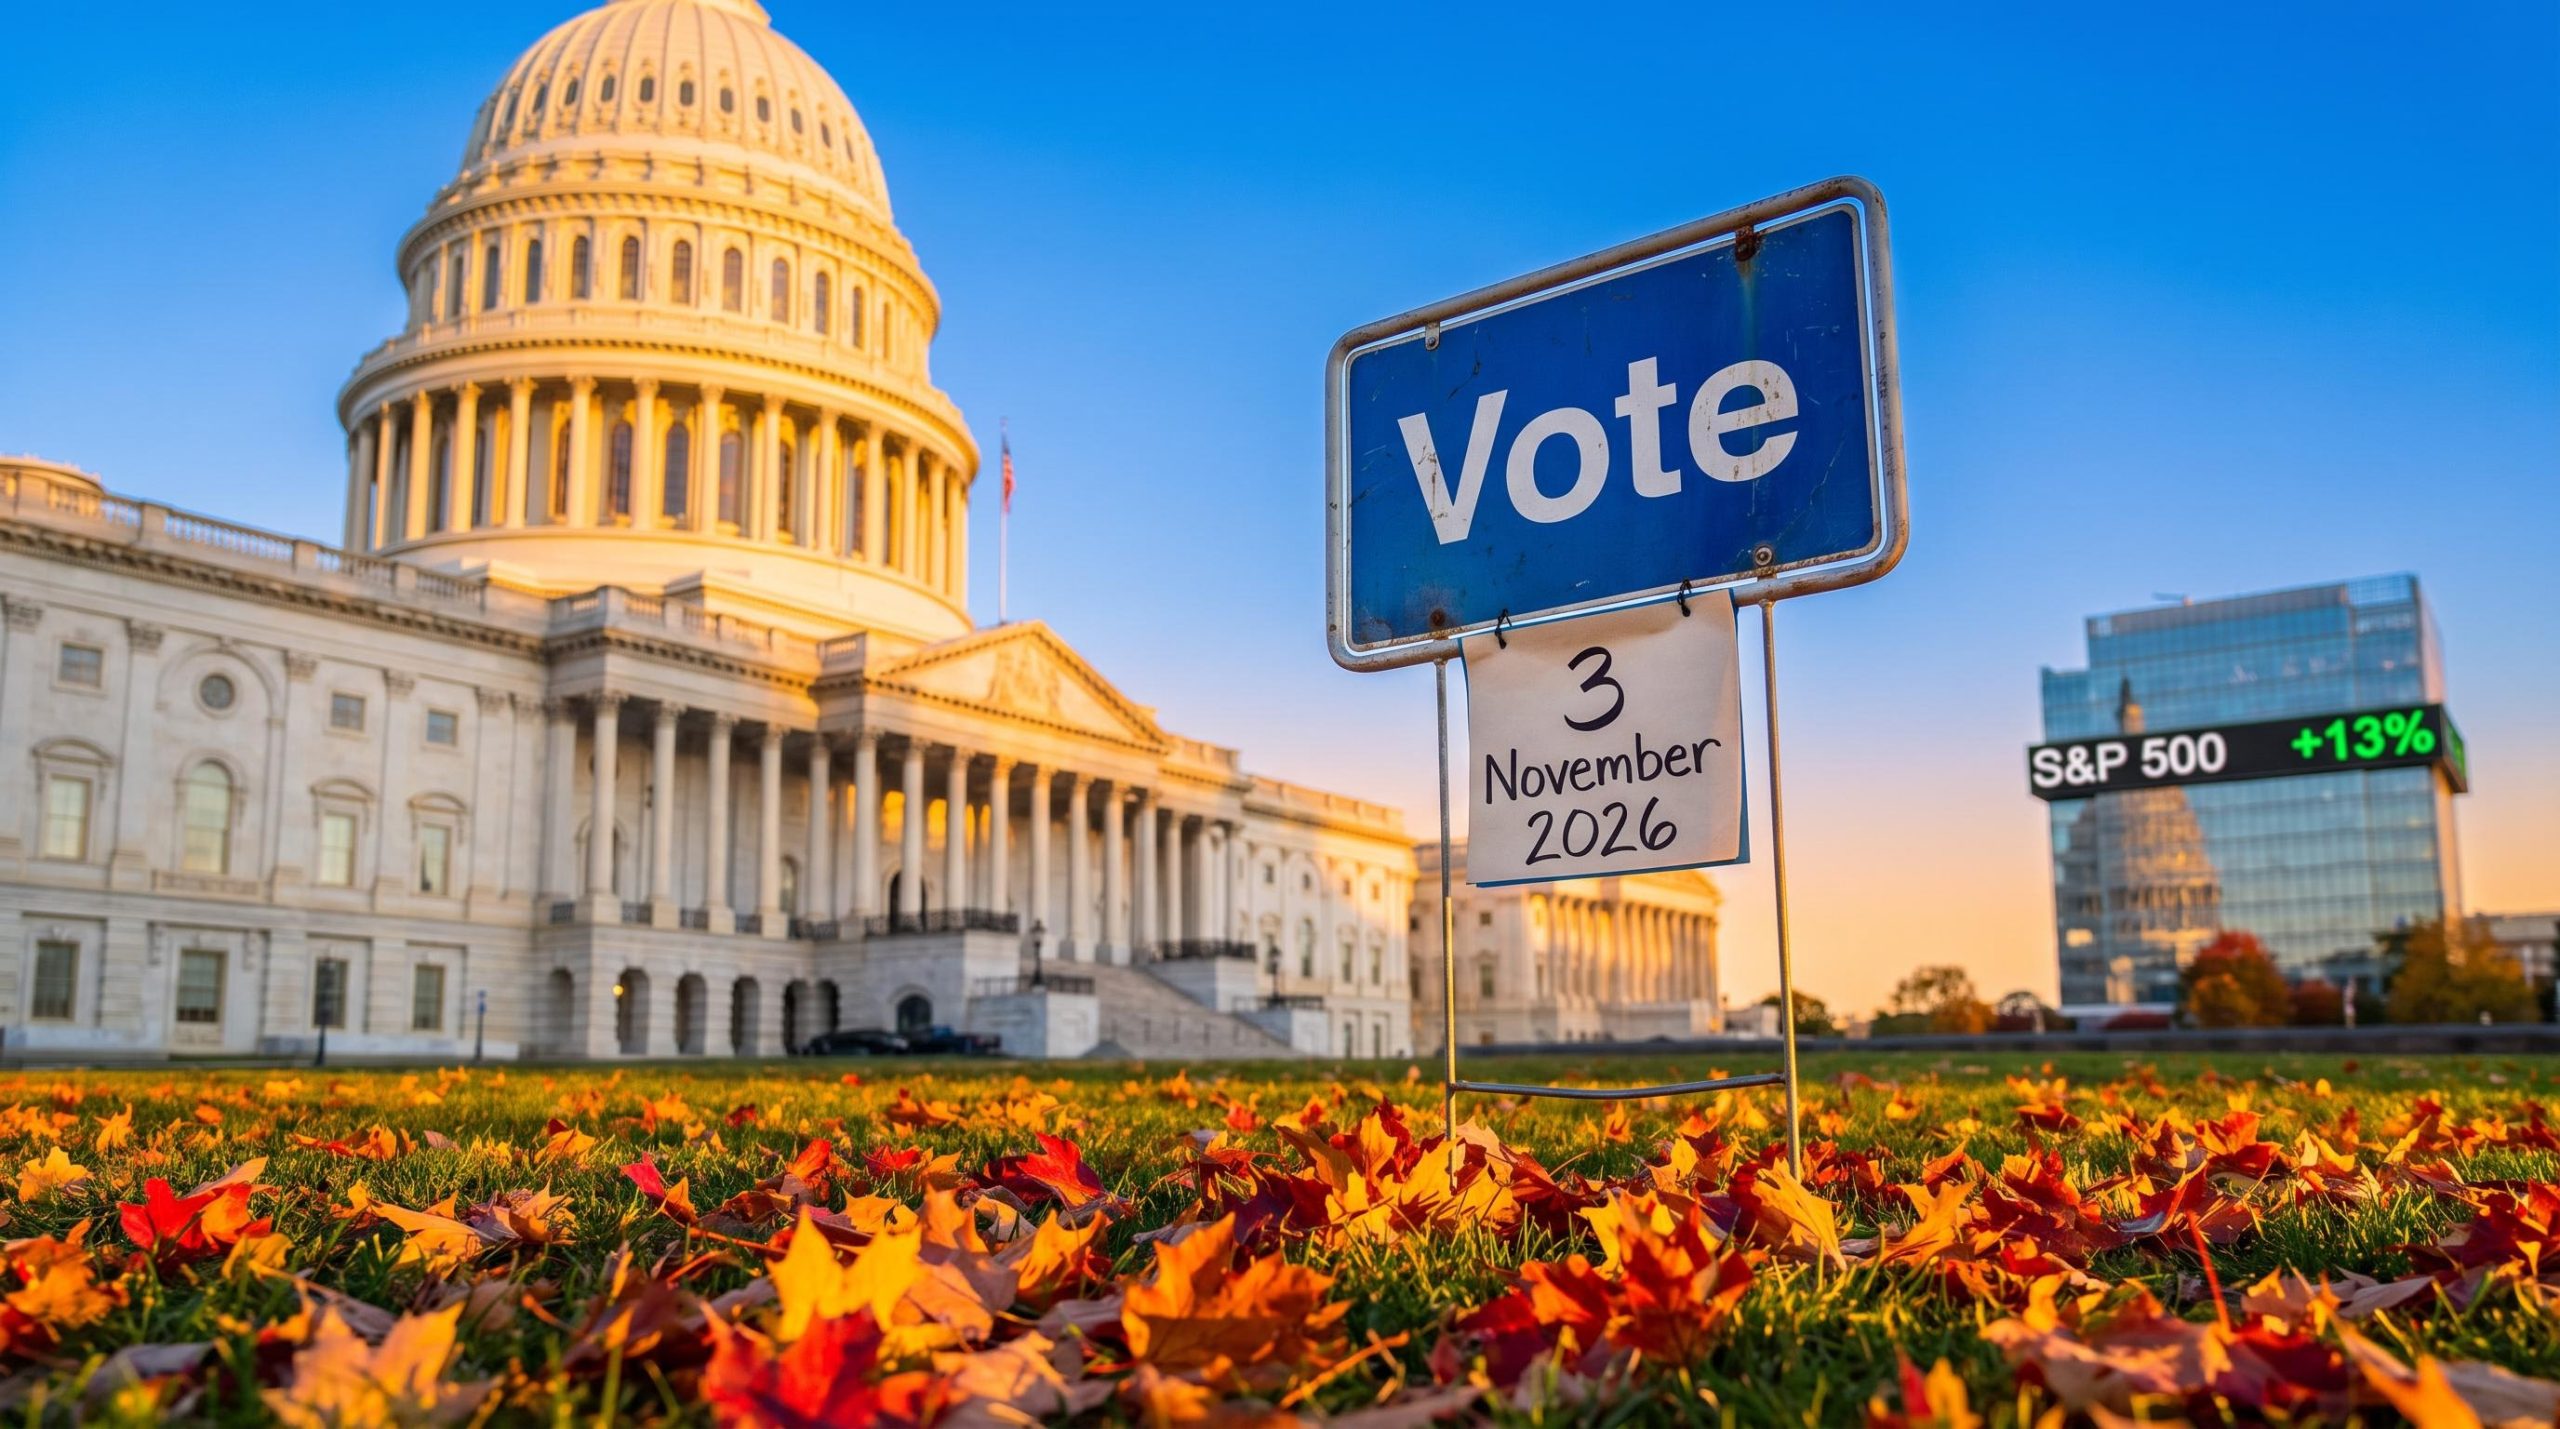
Election Day falls on 3 November 2026, 26 days from now. According to Bank of America, the S&P 500 is up about 13% so far this year, which puts it on course for its best midterm year since 2006.
You are probably weighing several things at once: the odds, voter anger over prices, and how much your sector exposure depends on who controls Congress. This explainer gives you three things. You will see what the odds actually price in, what history does and does not promise, and which areas (AI and big tech, healthcare, Treasuries) carry real policy sensitivity and which are mostly headline noise.
What do the odds say about who controls Congress, and why are voters leaning that way?
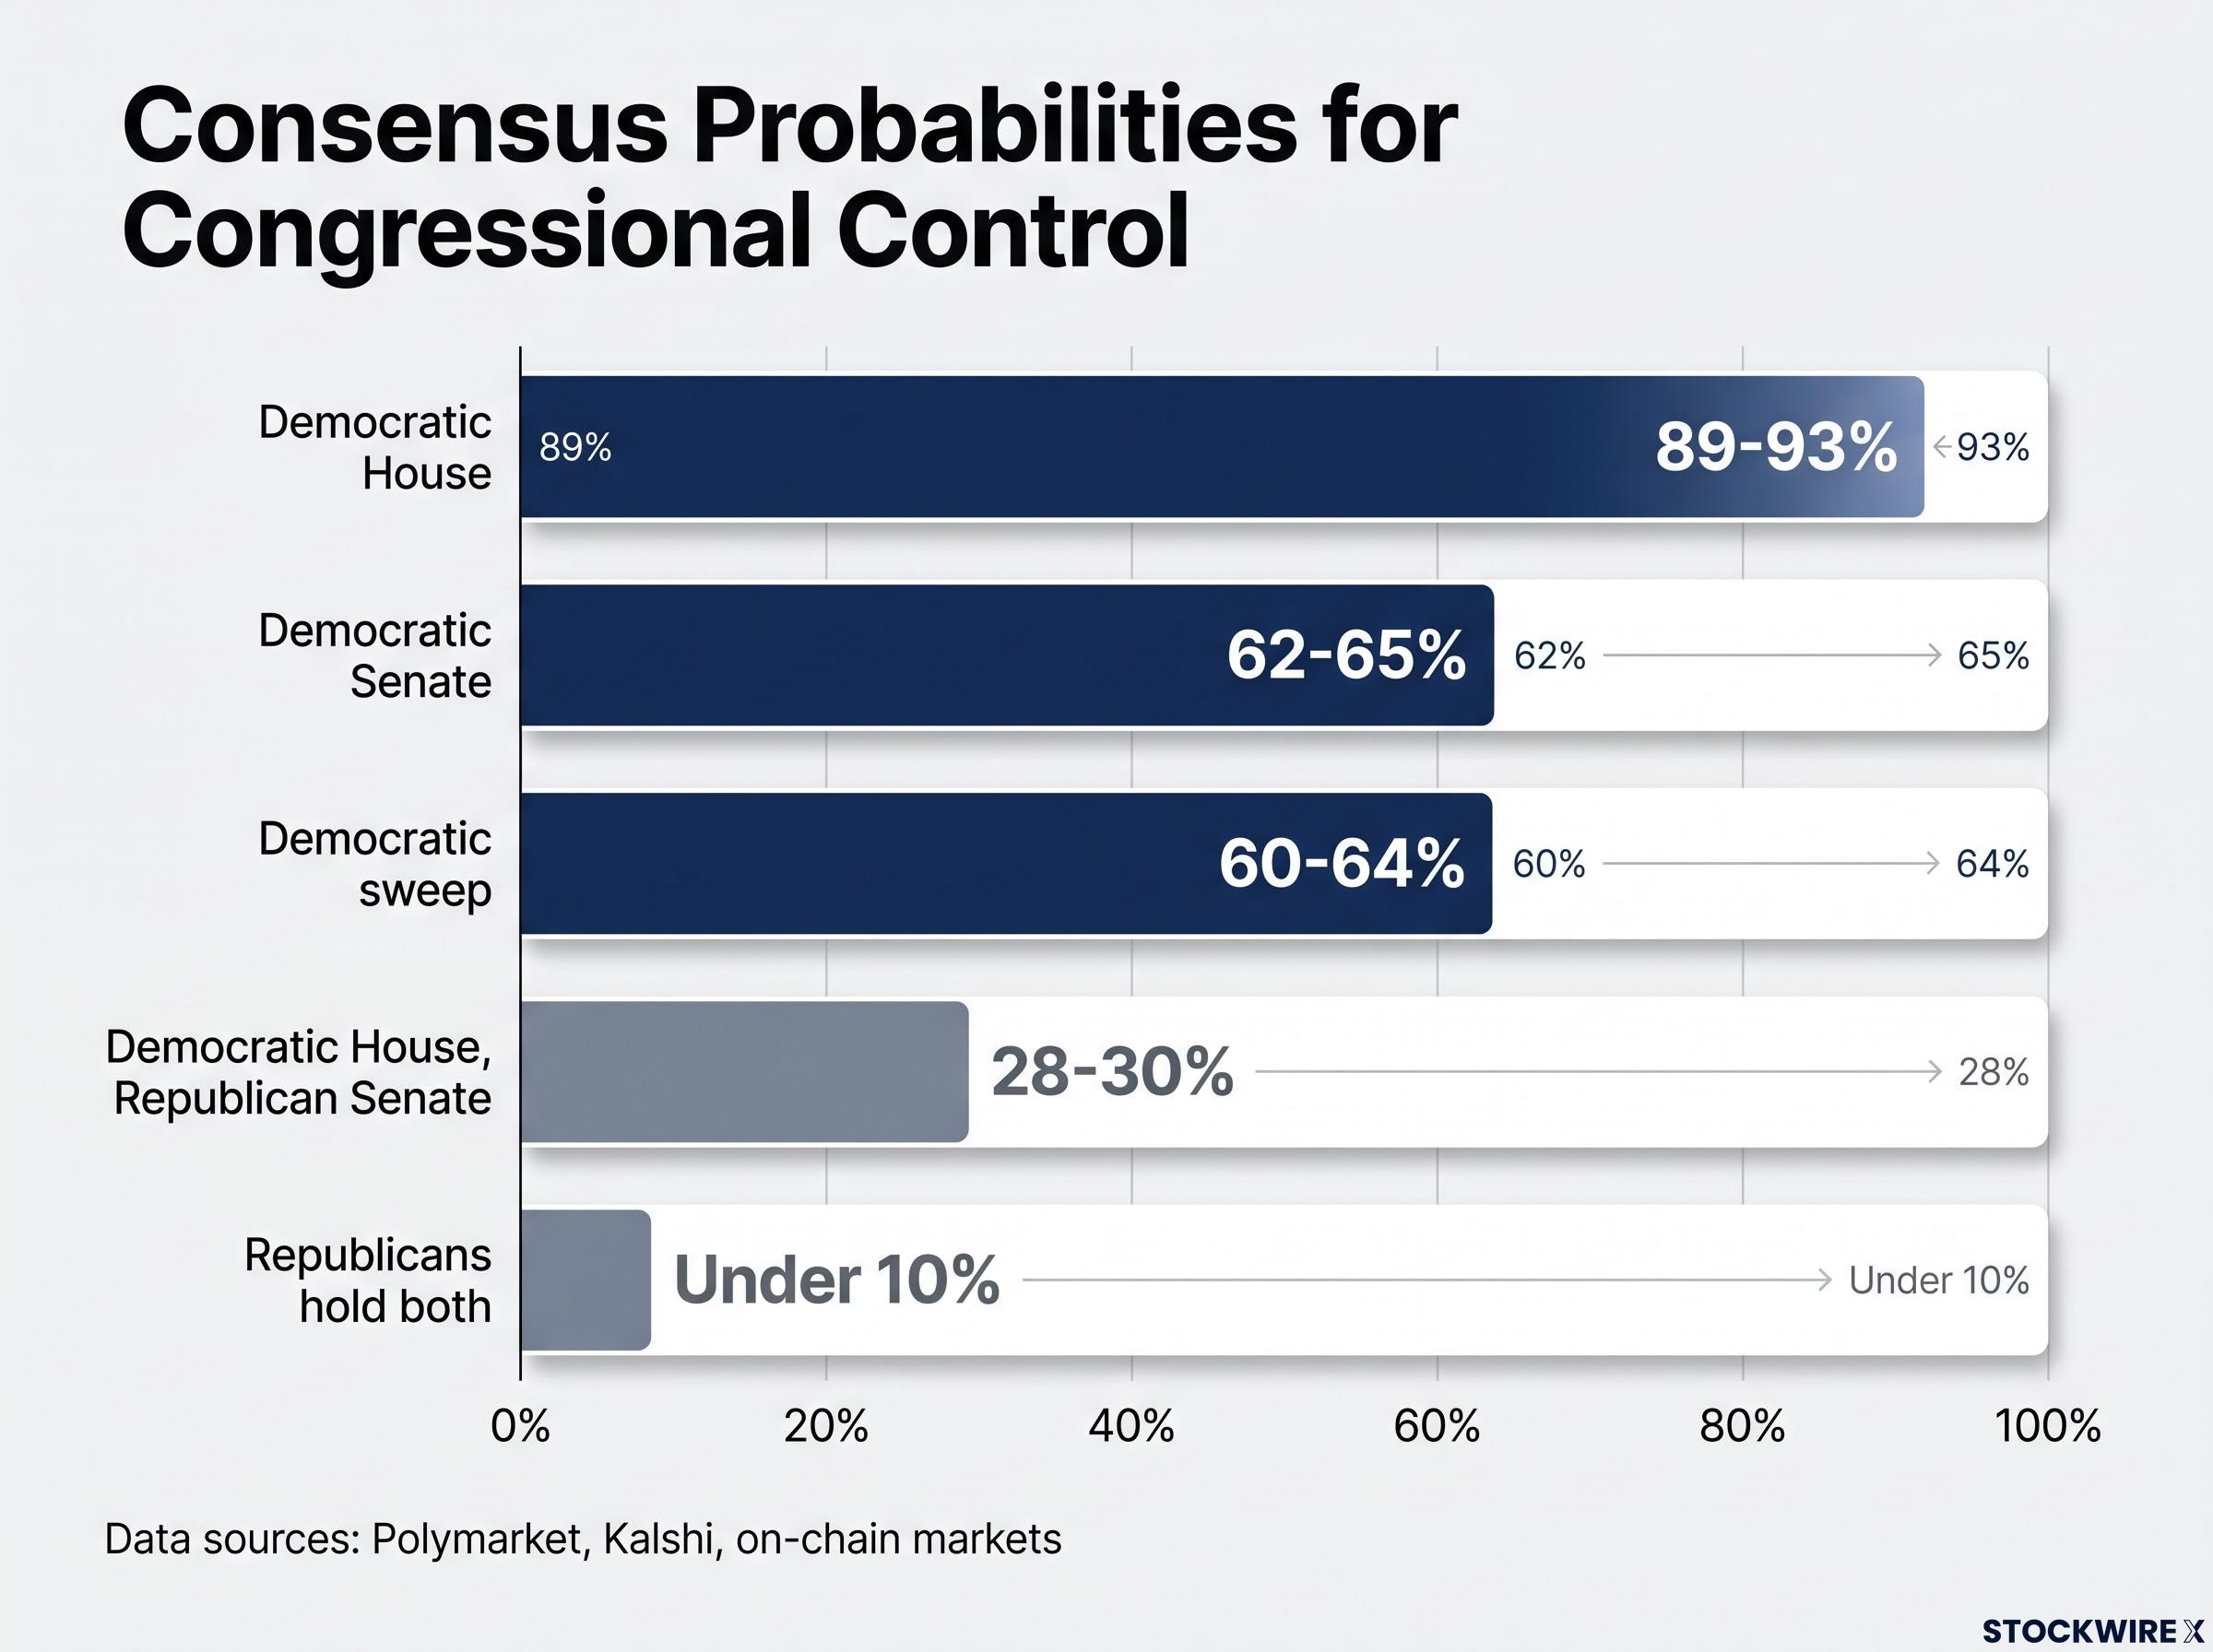
The numbers are lopsided. Polymarket priced a Democratic House at 93% on 2 October, on-chain markets tracked by DeFi Rate showed 91% on 7 October, and Kalshi sat at roughly 89-90%. The Senate is closer, but Democrats are still favoured.
The Senate result carries more new information than the House, because a Democratic House is already close to consensus; a sweep and a split Congress carry nearly identical probability weights and imply different post-election equity setups.
| Outcome | Approximate probability | Source |
|---|---|---|
| Democratic House | 89-93% | Polymarket, Kalshi, on-chain markets |
| Democratic Senate | 62-65% | Polymarket, Kalshi, on-chain markets |
| Democratic sweep | 60-64% | Polymarket, Kalshi |
| Democratic House, Republican Senate | 28-30% | Kalshi, Covers |
| Republicans hold both chambers | Under 10% | Kalshi |
These are consensus probabilities set by traders’ buy and sell orders, and they can move quickly. One offshore bookmaker line implies about a 69% chance of a Democratic Senate, but that figure has not been independently verified. The only accessible seat forecast, from Poliwave, projects a 223-212 Democratic House and a 51-49 Senate, with that Senate count including two independents who caucus with Democrats. Ratings from Cook, Sabato and 538-style aggregators could not be located.
The reason for the lean matters more than the lean itself. President Trump’s approval sits near 36-37%, which leaves a net approval of roughly -23 to -25 points.
The approval gap Net approval is about -24 now, compared with roughly -11 at a similar point before the 2018 midterms, when Republicans lost the House.
Democrats lead the generic ballot, which asks voters which party they prefer without naming candidates, by about 5-8 points. In a Fox News poll, about 34% named cost of living or inflation as their top concern without being prompted. Inflation worry runs high even among Republicans.
This looks like a vote against prices rather than a vote for a Democratic agenda. For you, that suggests budget fights and gridlock are more likely than sweeping legislation, and those fights are what would actually shape your market exposure.
When big ASX news breaks, our subscribers know first
How has the S&P 500 behaved around midterm elections?
If gridlock is the likely result, the next question is how markets have handled this point in the cycle before. The pattern comes in two parts.
The weak year
Midterm years have historically been the softest of the four-year presidential cycle. BlackRock puts the average at about 7.5%, against 12.4% in other years. RBC Wealth Management finds 3.3%, and Nasdaq Dorsey Wright calculates 3.68% across 24 midterm years since 1928, compared with 13.96% in the third year of the cycle.
The two most recent midterm years were painful: 2018 returned -4.4% and 2022 returned -18.1%. Dow Jones Market Data shows the index has averaged a fall of about 2.8% between late April and late September of midterm years.
The pre-election window is murkier. One view holds that stocks weaken in the roughly 60 days before the vote. Edward Jones, however, reports an average gain of 4.5% in the final month, positive about 79% of the time. Both can be true if the weakness tends to come earlier and the final weeks recover.
The recovery
After the vote, the record improves sharply.
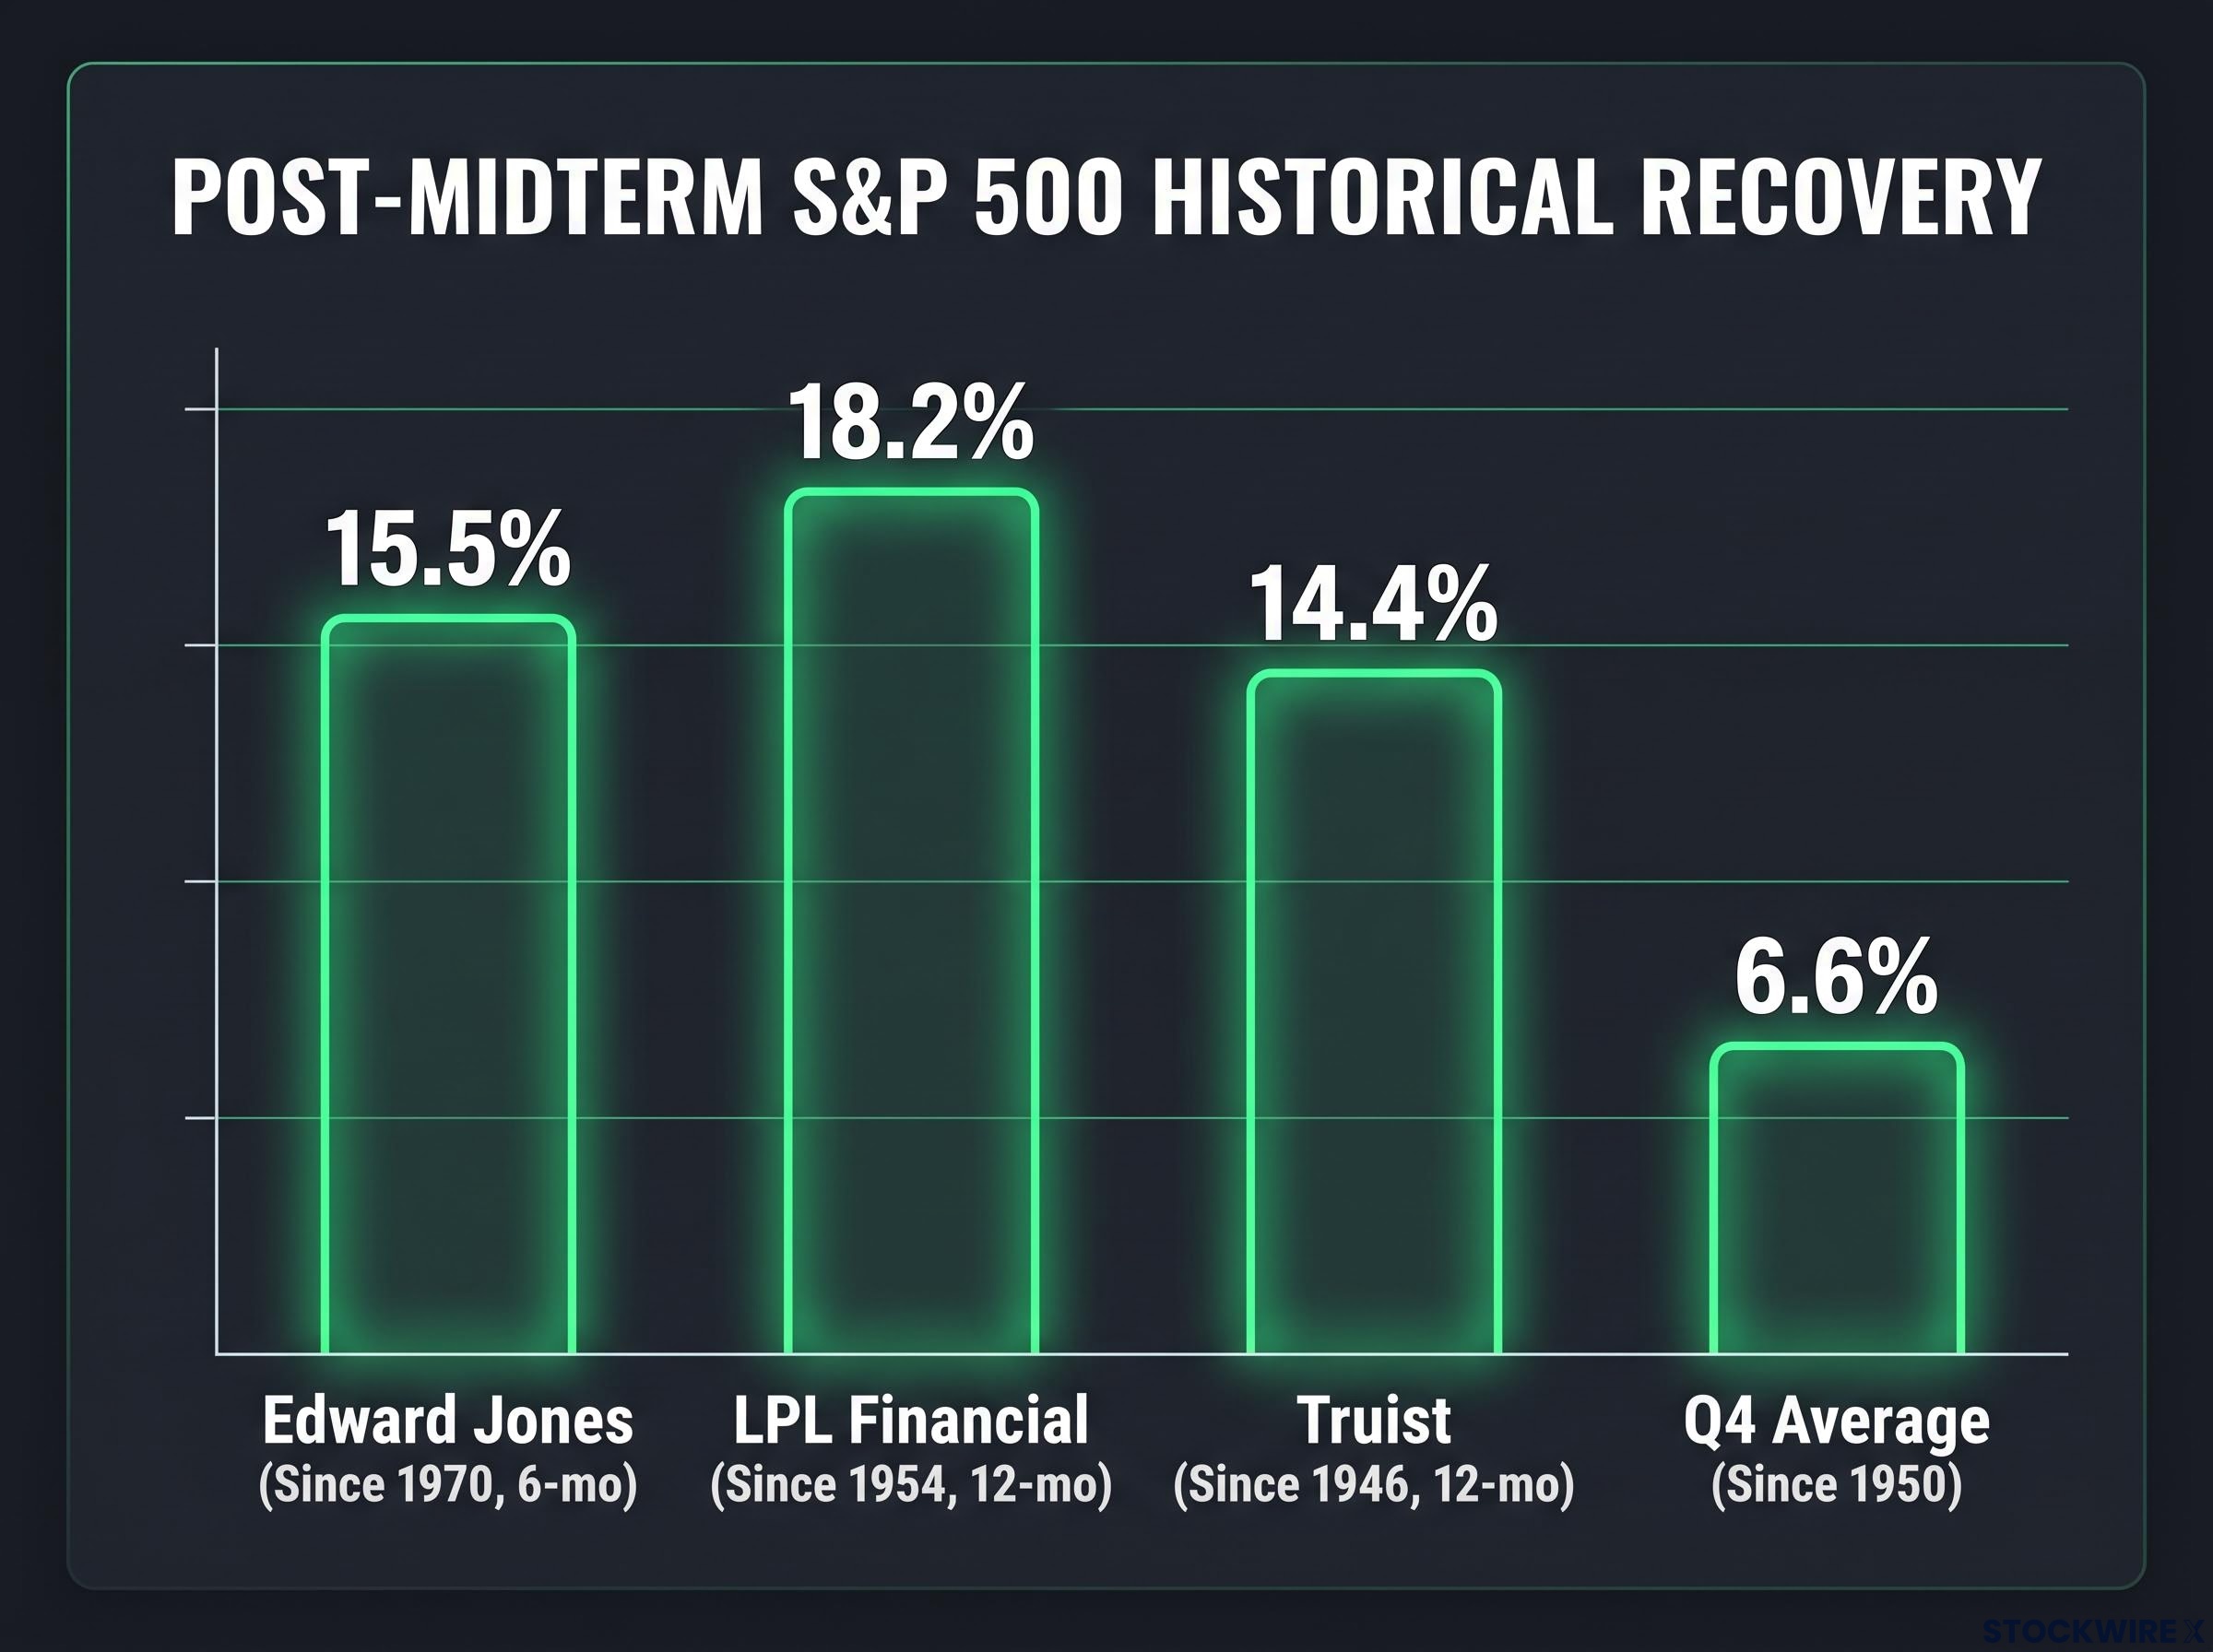
- Edward Jones: 15.5% average gain over six months, with gains after all 14 midterms since 1970
- LPL Financial: 18.2% average over 12 months, across 17 midterms since 1954
- Truist’s Keith Lerner: 14.4% average one-year return since 1946
- Q4 of midterm years: +6.6% average since 1950, up about 84% of the time
| Source | Sample period | Window | Average return |
|---|---|---|---|
| Edward Jones | Since 1970 | 6 months | 15.5% |
| LPL Financial | Since 1954 | 12 months | 18.2% |
| Truist | Since 1946 | 12 months | 14.4% |
The averages differ, ranging from about 14% to 18%, mainly because each study starts its sample in a different year. Even in good years the ride was uneven. Some post-midterm periods saw dips of up to 10% in the first 120 days before the index recovered.
For you, history suggests that election uncertainty has tended to resolve into a rally. Those early drawdowns are a reason to plan for turbulence rather than expect a smooth climb.
Part of the post-election rebound reflects a wall of worry dynamic, where pessimism built up before the vote gives way to buying once the outcome is settled and sidelined cash returns to equities.
How could a Democratic Congress touch AI, big tech, healthcare and Treasuries?
A change in Congress may matter least for the AI trade, where many investors would expect the biggest effect.
One strategist’s view Every sector view below comes from Moomoo’s market strategist. No independent institutional analysis linking the election to AI, healthcare or Treasuries could be located.
AI and big tech
AI regulation is set federally, but data centre approvals are decided by states and local authorities. That split means new data centres are likely to cluster in states that welcome them, whatever happens in Washington. Trump also governs largely through executive action on trade, tariffs and deregulation, so a shift in congressional control may not slow the AI buildout much.
Split government could leave tech regulation fragmented, which the strategist sees as supportive for enterprise AI spending. Lagging megacaps such as Meta and Amazon might expand their AI work without heavy bipartisan antitrust pressure.
Healthcare, Medicaid and SNAP
The sharper sensitivity may sit here. Democrats could alter scheduled cuts to Medicaid and the Supplemental Nutrition Assistance Program (SNAP), which could support healthcare, a sector that has trailed tech over the past year. The specifics of those cuts could not be verified.
Debt ceiling and Treasuries
Divided government has historically brought standoffs over the debt ceiling and appropriations, the annual bills that fund government. Exact deadlines could not be confirmed. The Treasury’s refunding announcement, its regular update on how much debt it will sell and in what form, lands on 4 November, the day after the election. If it leans towards short-term bills, longer-dated yields could ease, although the content of the announcement remains unconfirmed.
Treasury’s expanded buyback programme is the backdrop to the refunding update, since funding repurchases from its large cash balance can inject reserves and trim long-duration supply, which bears on where longer yields settle.
| Area | Possible effect | Evidence strength |
|---|---|---|
| AI and big tech | Little change to buildout; possible antitrust relief | Single strategist view |
| Healthcare | Support if Medicaid and SNAP cuts are altered | Single strategist view; cuts unverified |
| Treasuries | Longer yields may ease if issuance shifts to bills | Single strategist view; refunding content unconfirmed |
For you, this suggests treating the AI trade as less election-sensitive than headlines imply. Healthcare funding decisions and the refunding announcement are the nearer and more concrete catalysts to watch.
Why is a historical pattern not a forecast?
Everything above rests on averages, and an average can hide a lot. An average return blends great years and terrible ones into a single tidy number. It tells you what has tended to happen, not what will happen in your own holding period.
Tendency, not guarantee A pattern that held in most past cycles can still fail in the cycle you are living through.
The midterm record shows this clearly. Post-election gains have averaged about 14-18%, yet 2018 finished at -4.4% and 2022 at -18.1%. Three limits are worth keeping in mind:
- Sample differences: Studies that start in different years produce different averages, so no single figure is the true number.
- Macro dominance: Inflation, interest rates and earnings drive markets far more than the election calendar does.
- Early drawdowns: Even winning years have included falls of up to 10% within 120 days.
Timing makes this harder still. Silvia Insights found the S&P 500 averaged 31.8% in the 12 months after a midterm year’s lowest close, positive 19 of 19 times since 1950. The catch is that you only know where the low was afterwards.
There are also gaps in the evidence. No recent commentary was found tying the 2026 result to tariffs, Federal Reserve policy or AI valuations, and no named counter-arguments emerged on divided government and Treasury yields. A favourable pattern may support staying invested with a long horizon. It does not justify a concentrated bet on the result.
Past performance does not guarantee future results. Financial projections are subject to market conditions and various risk factors.
Reading the election without overreacting: what matters for long-term investors
You now have three layers to work with. A Democratic win looks likely, but it appears driven by frustration over prices rather than a policy mandate. History has rewarded investors after midterms, although not every year and not smoothly. The sector effects are real but uneven, and they rest on one strategist’s reading.
The useful step is to separate what is probable from what is not. Democratic House control looks highly likely. The Senate and the policy details remain uncertain. Some signals will arrive quickly.
Three variables are worth tracking:
- The Senate result, which decides whether you face a sweep or a split Congress
- Budget and appropriations talks, where healthcare funding is likely to be decided
- The 4 November Treasury refunding announcement and its mix of bills and longer debt
This article is for informational purposes only and should not be considered financial advice. Investors should conduct their own research and consult with financial professionals before making investment decisions. These statements are speculative and subject to change based on market developments and company performance.