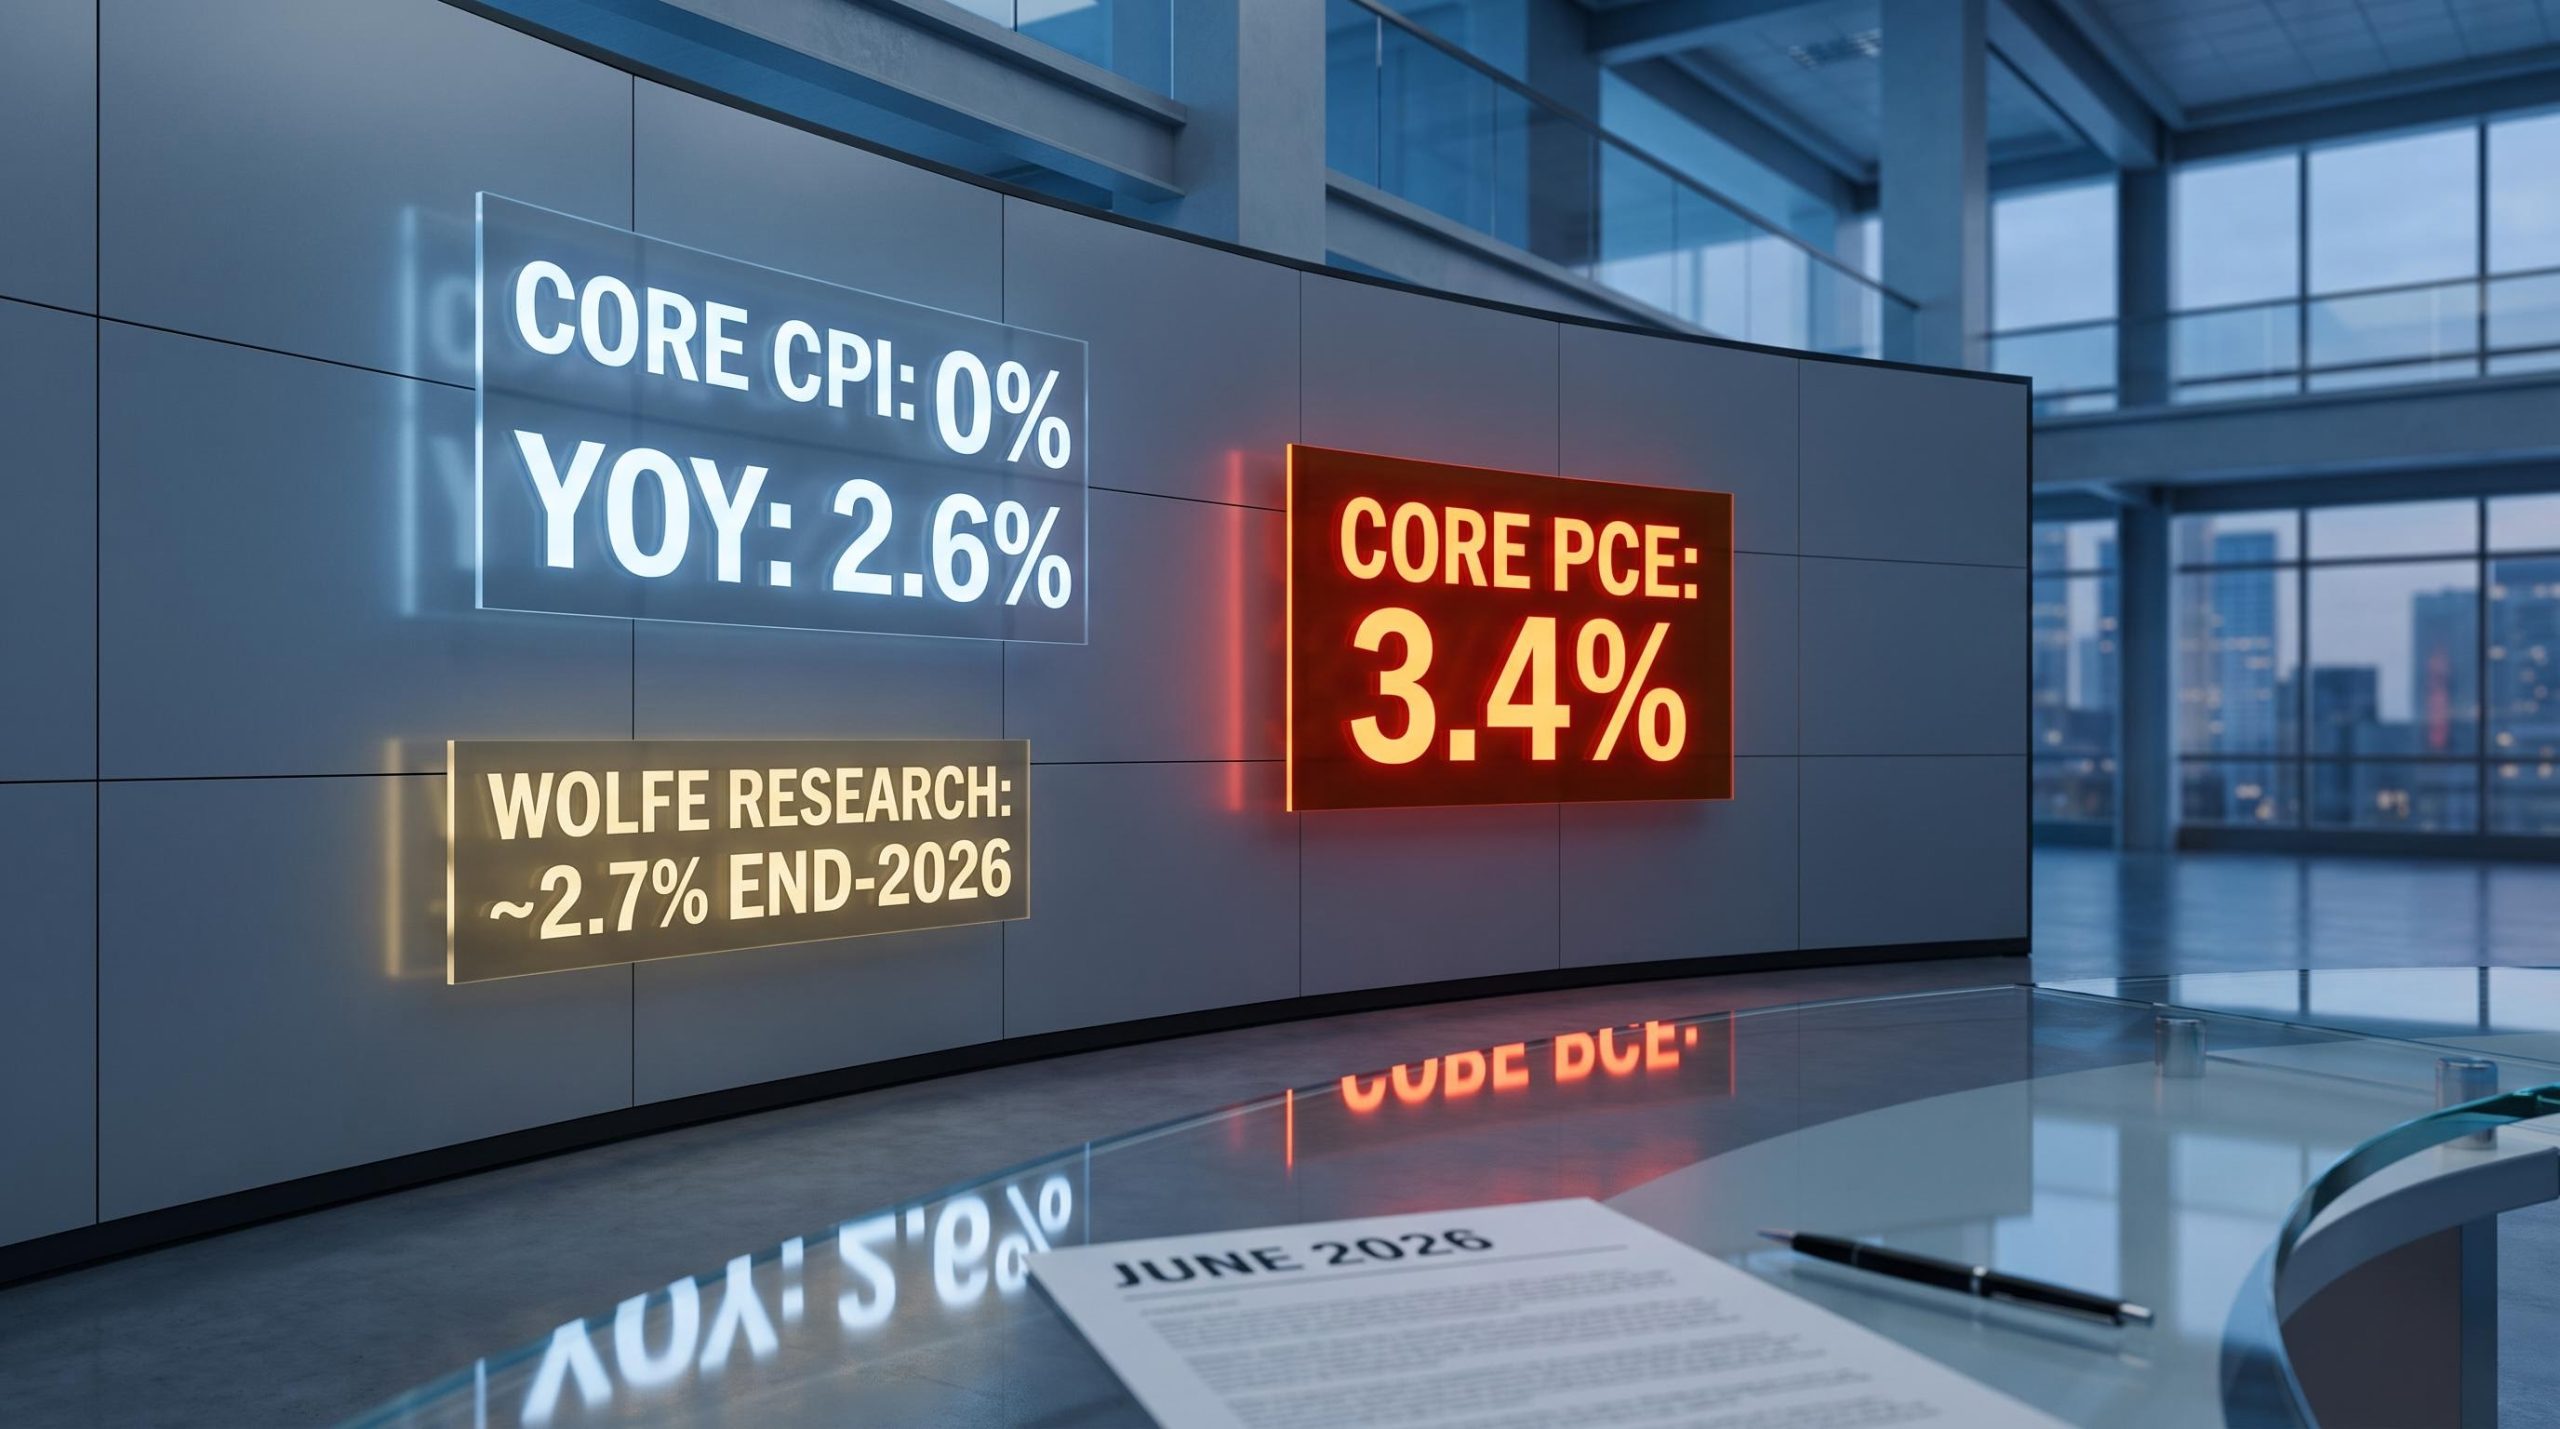
June 2026 delivered the mildest core CPI reading in months. Prices were flat on the month, and the year-over-year rate fell from 2.9% to 2.6%. The instinct to call this a turning point is understandable.
The instinct is probably wrong. The forces behind June’s soft print are real but largely temporary: a normalisation in motor vehicle insurance premiums, a quirk in wireless service pricing, seasonal corporate pricing patterns, and fading tariff maths. Wolfe Research’s macro team has mapped each of these carefully, and the picture they produce is one of meaningful near-term relief followed by a more complicated 2027. Understanding which forces are genuinely at work matters because it separates a positioning opportunity from a positioning trap.
Here is the specific breakdown: the mechanisms driving second-half moderation, the structural pressures that threaten to outlast it, what the Fed is actually signalling, and what both sides of that tension mean for your portfolio and purchasing decisions through year-end and into 2027.
What June’s flat inflation print is actually telling you
Start with the numbers, because the numbers tell a more complicated story than the headlines suggest.
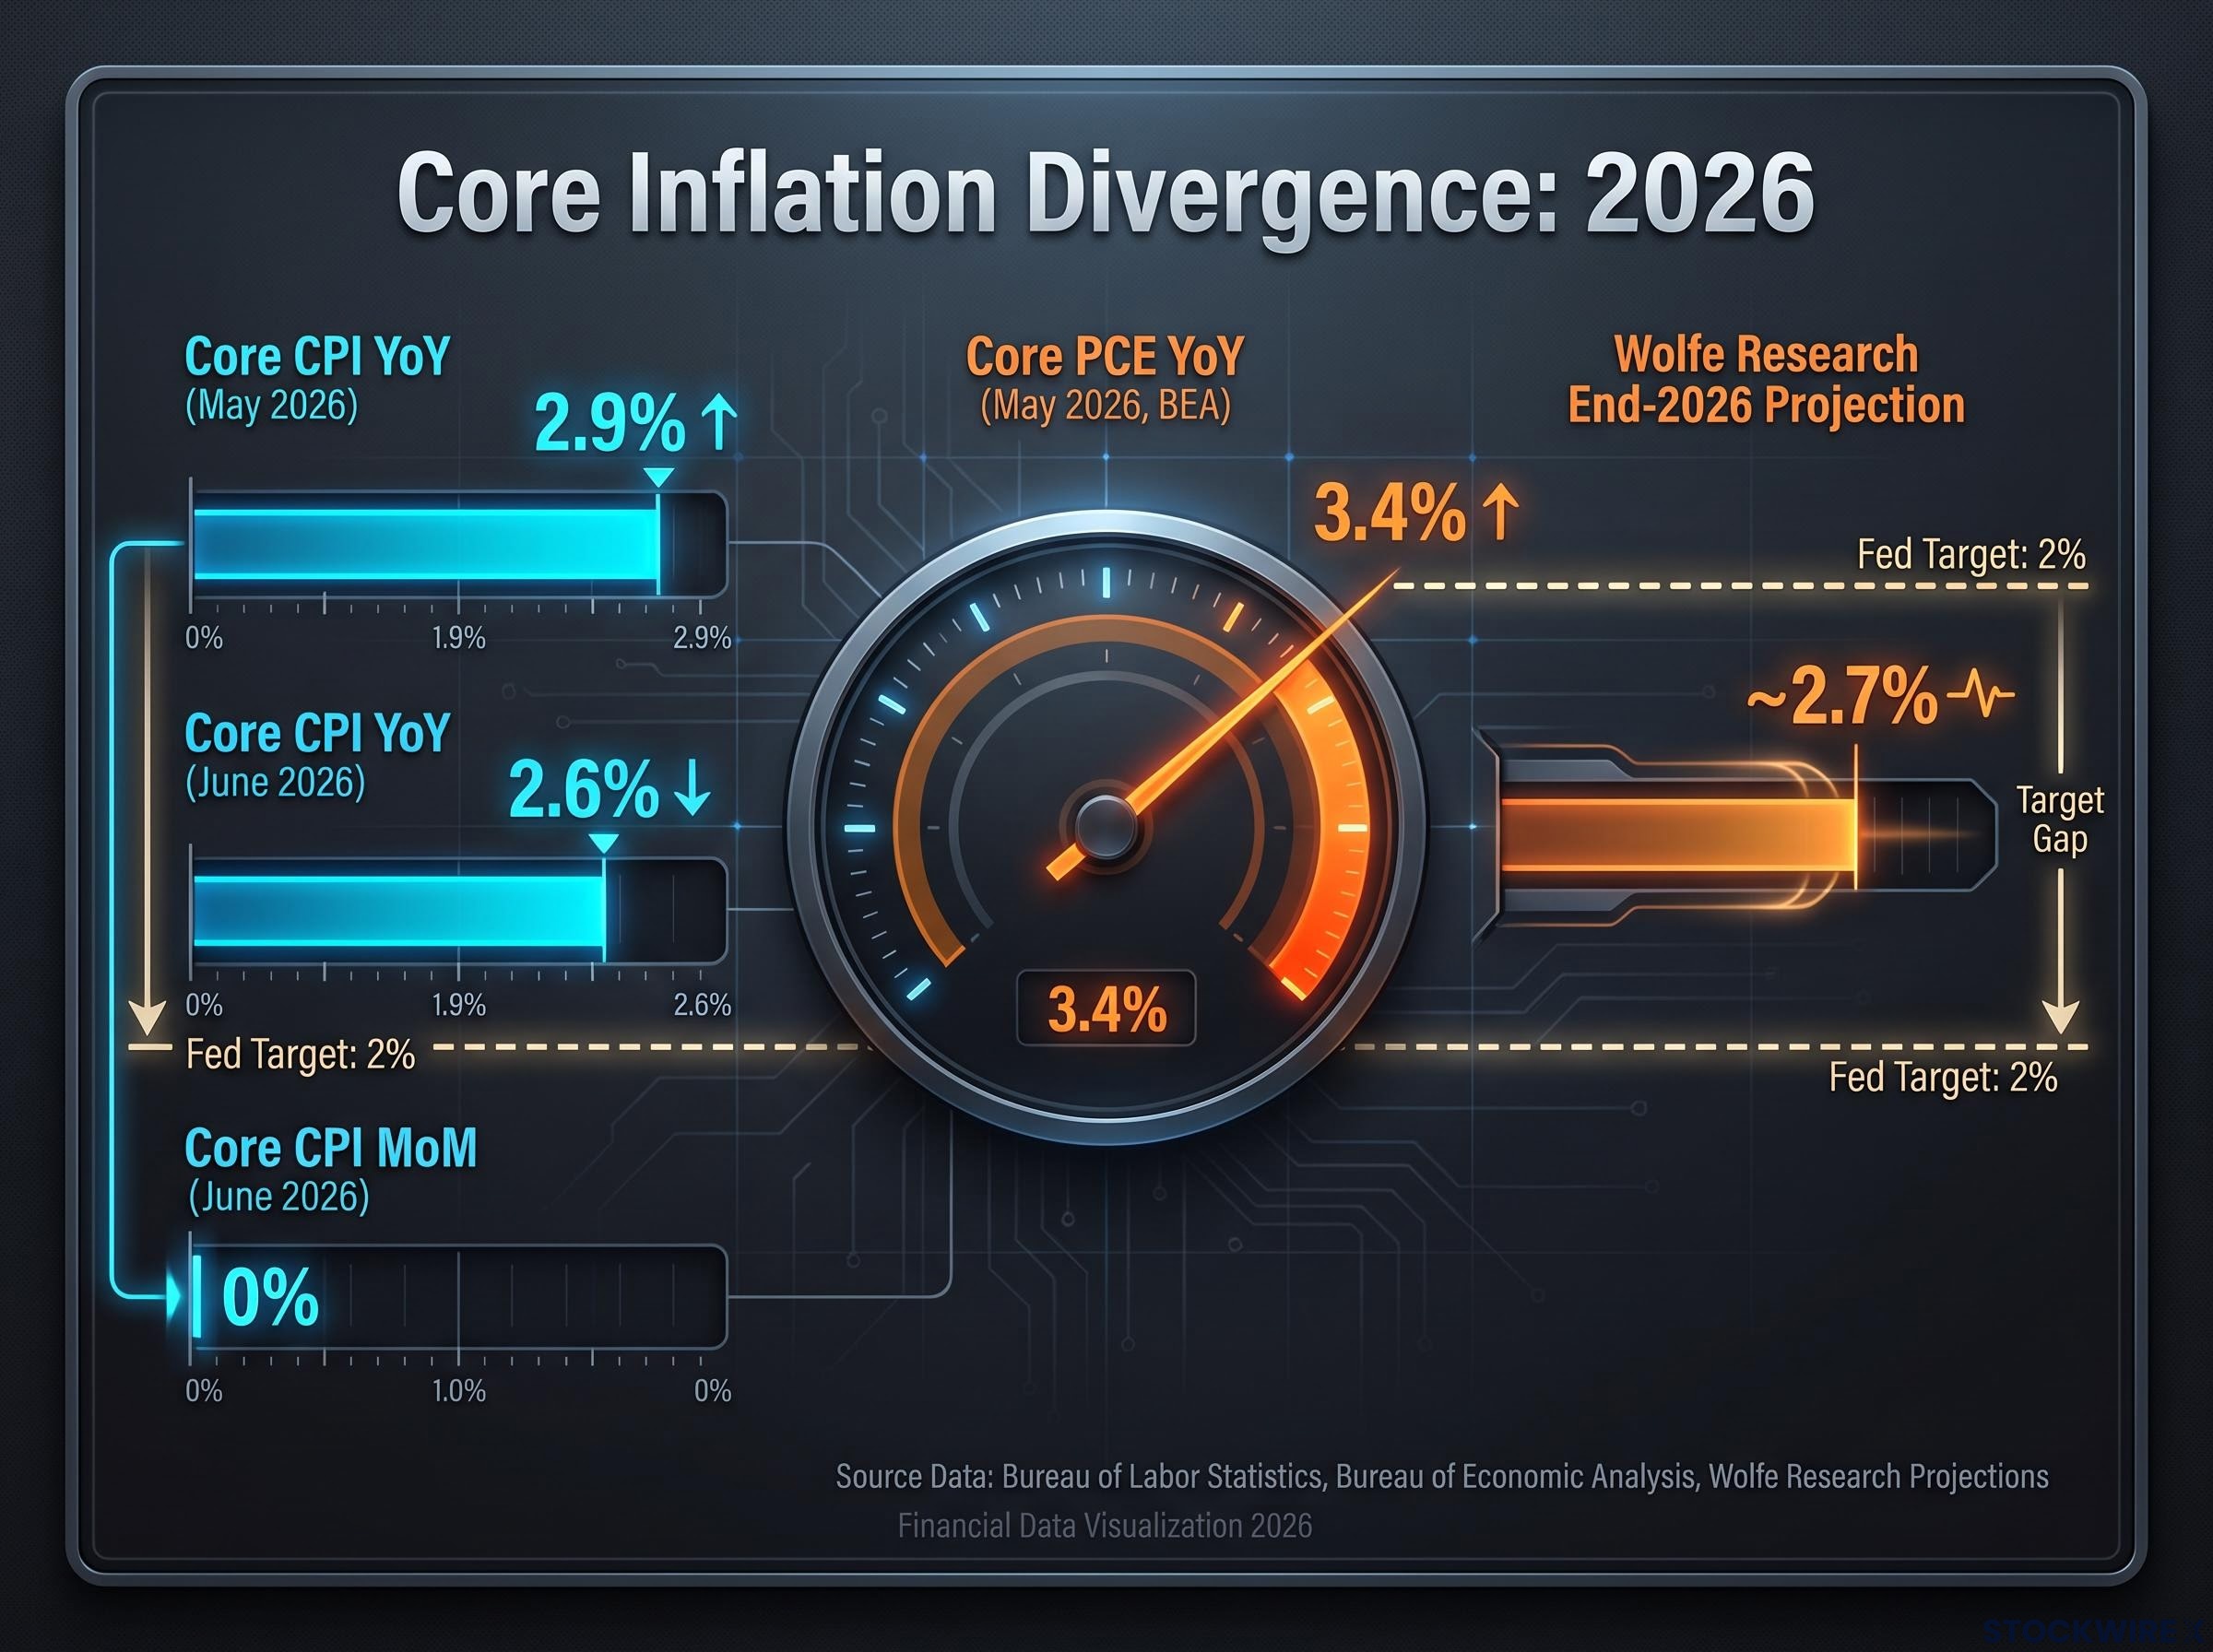
The June CPI release confirmed a 0.0% month-over-month reading and pulled the annual core rate to 2.6%, the largest downside miss relative to consensus in over a year, providing the raw data that Wolfe Research’s structural analysis is built against.
- Core CPI month-over-month: flat (0%), June 2026
- Core CPI year-over-year: 2.6% (June 2026), down from 2.9% (May 2026)
- Core PCE year-over-year: 3.4% (May 2026, Bureau of Economic Analysis)
- Wolfe Research end-2026 projection: approximately 2.7%
That gap between a flat monthly CPI print and a core PCE still running at 3.4% is the detail that matters most. The headline moderation is real, but the Fed’s preferred inflation measure, core PCE (the Personal Consumption Expenditures price index, which captures a broader basket of spending than CPI), is tracking a materially different story. One number says relief. The other says the job is not done.
Wolfe Research’s Stephanie Roth characterised June’s inflation weakness as unlikely to recur at the same magnitude, while still projecting a more moderate environment for the remainder of 2026 relative to the January-May period.
Reading one data point without the others creates false confidence. The CPI print is a signal worth decoding, not a verdict worth celebrating.
When big ASX news breaks, our subscribers know first
Four reasons inflation is set to run cooler through December
The case for a milder second half is real, and it rests on four distinct forces:
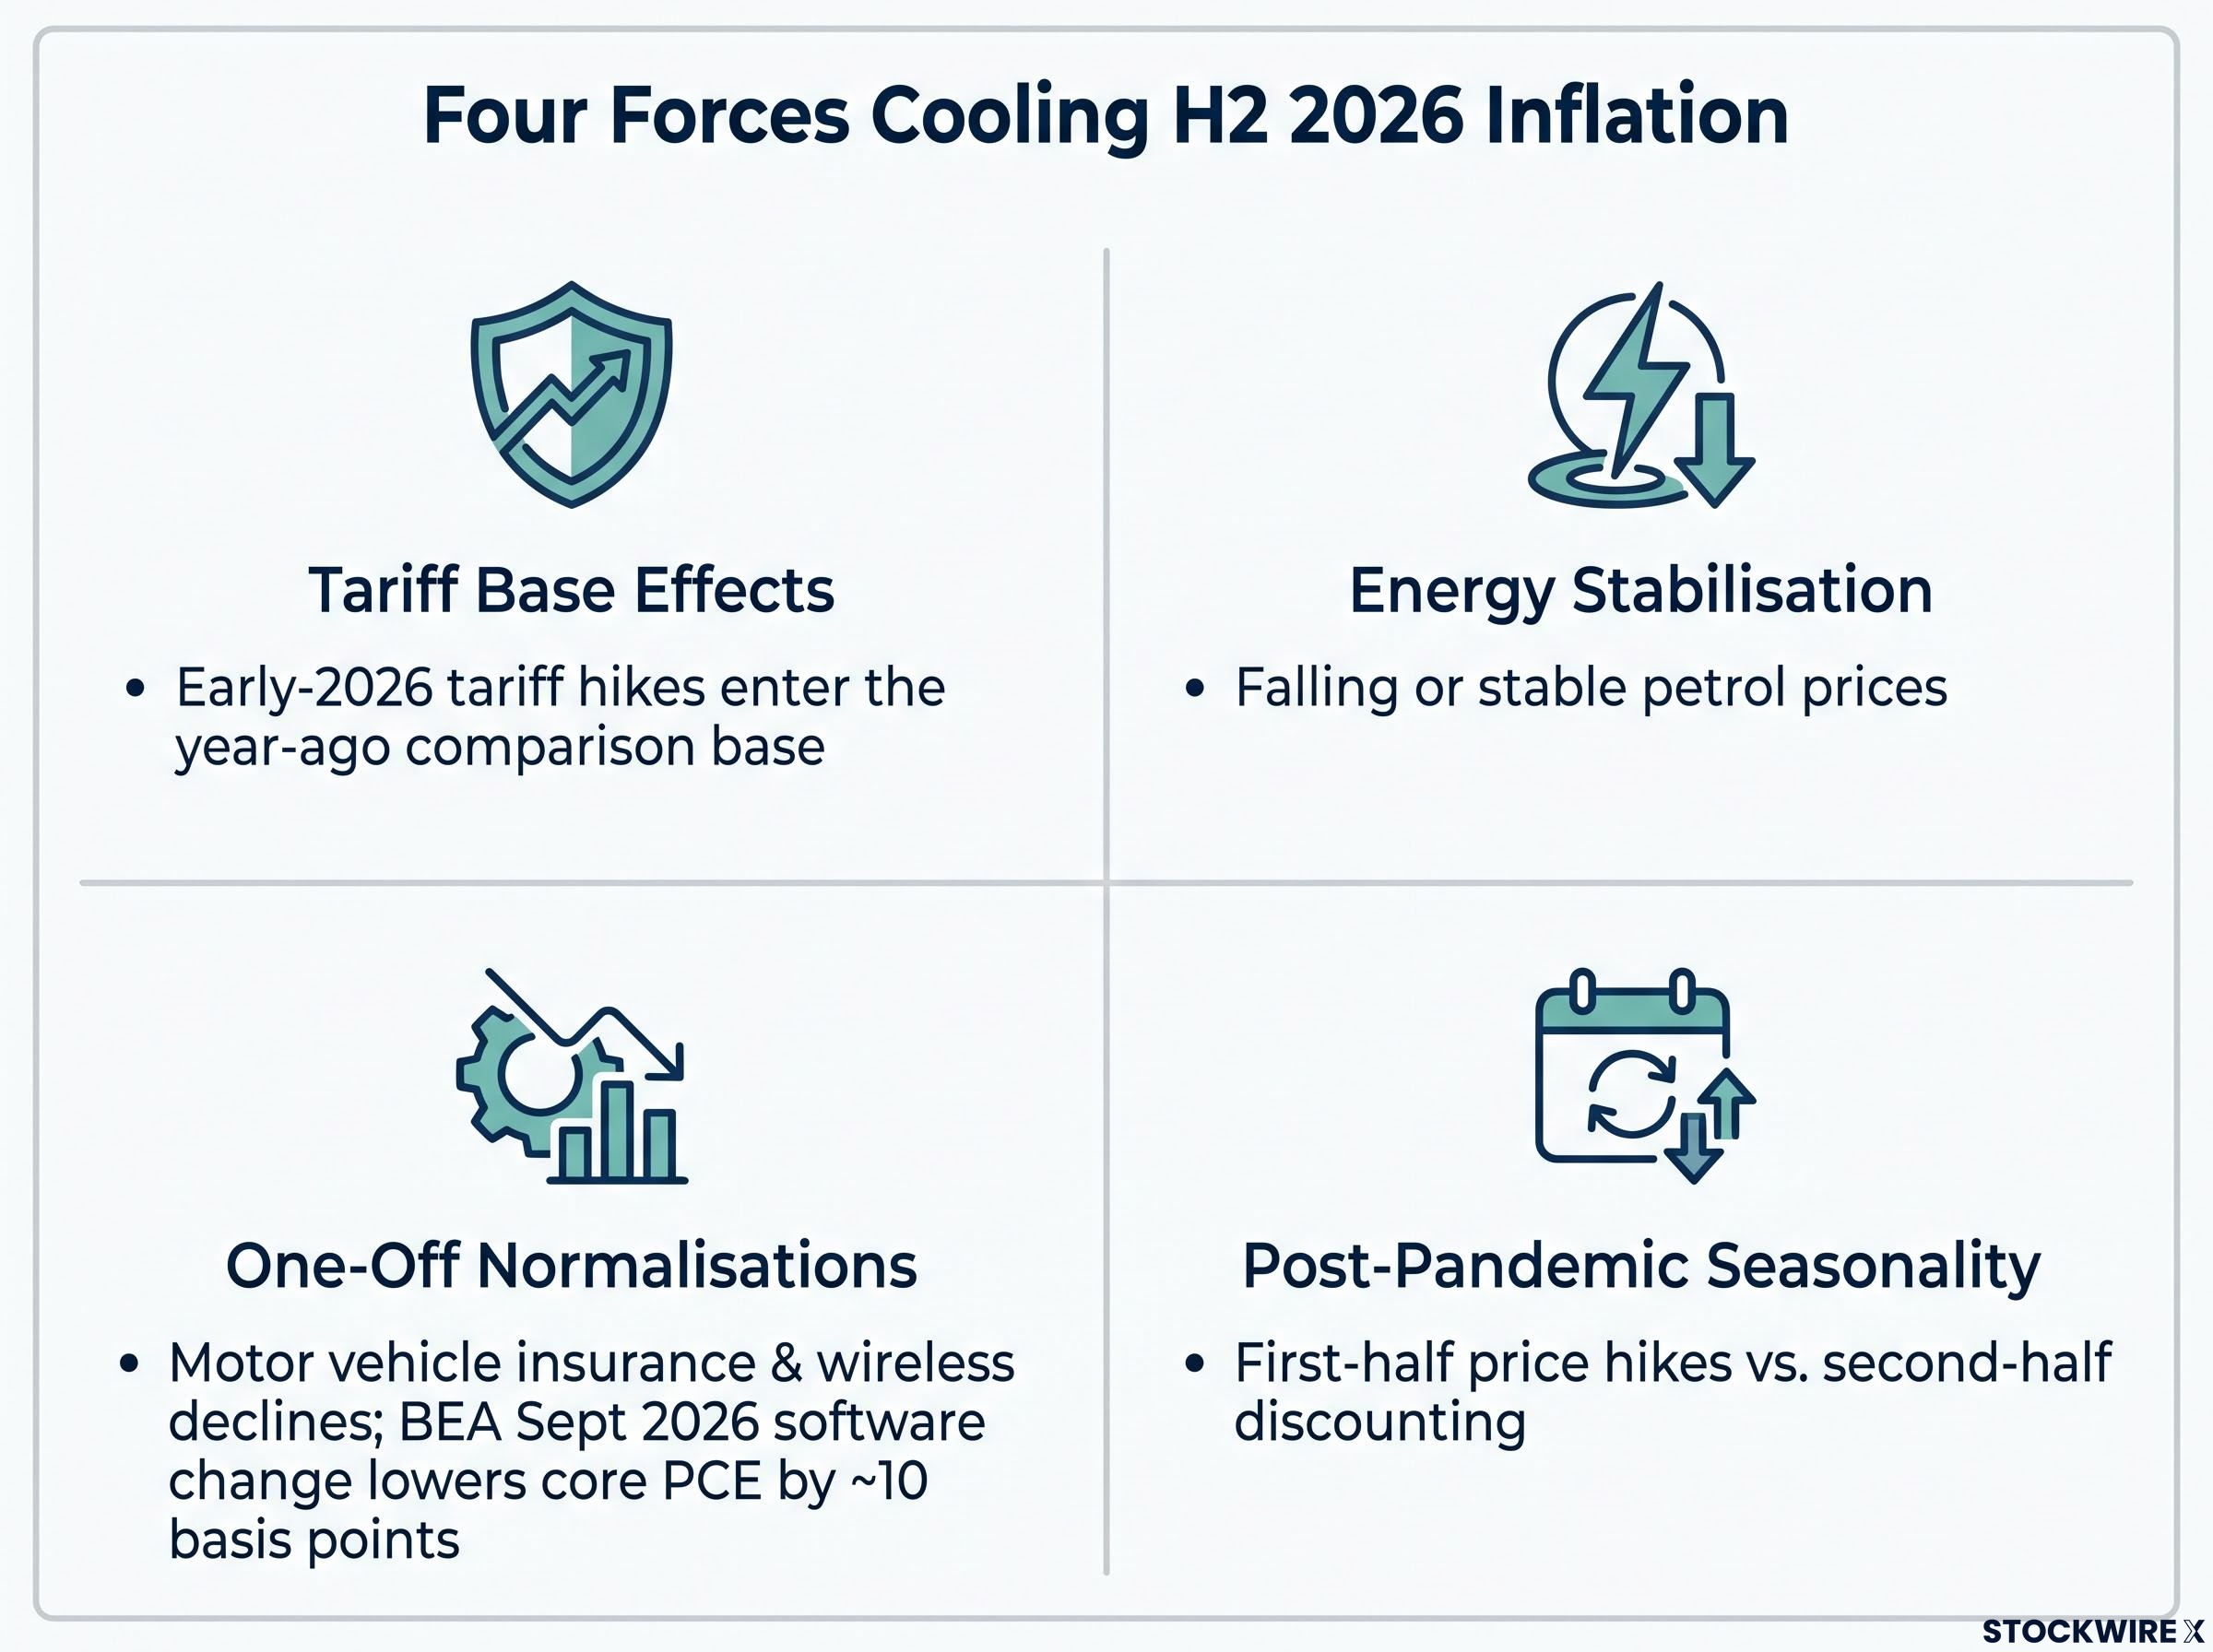
- Tariff base effects. Early-2026 tariff hikes pushed goods prices higher, but tariffs do not continuously accelerate prices. They raise the level once. Once that higher price level sits in the year-ago comparison base, year-over-year readings automatically soften, even if the tariffs themselves remain in place. This is arithmetic, not disinflation.
- Energy stabilisation. Falling or stable petrol prices remove a major source of headline volatility and spill over into lower transportation and logistics costs, reinforcing milder readings across multiple categories.
The one-offs: insurance, wireless, and a BEA measurement change
- One-off category normalisations. Motor vehicle insurance prices fell sharply in June, making this category the single heaviest downward contributor to core CPI for the month. This fits a standard insurance pricing cycle: insurers aggressively reprice to catch up with previously underpriced risk, then moderate once new premium levels are established. It is a one-time adjustment, not a sign that insurance has become structurally cheaper. Wireless phone service price declines also contributed to June’s softness, but wireless pricing is inherently noisy in CPI measurement, and small quirks can produce temporary downside surprises without signalling a lasting decline in the underlying cost burden.
On the technical side, the BEA will change how it measures the computer software component of core PCE starting in the September 2026 annual update. Estimates suggest this could lower core PCE by approximately 10 basis points, modest on its own but additive when stacked on top of everything else.
The BEA annual update methodology confirms that the September 2026 revision cycle will integrate changes to how computer software is measured within core PCE, a technical adjustment that carries real implications for how the Fed reads the second-half inflation trajectory.
- Post-pandemic seasonal patterns. Dating back to the COVID-19 pandemic, U.S. inflation has tended to run measurably stronger in the first six months of the year compared with the second six. Price increases are concentrated early in the calendar year, with promotional discounting and more competitive pricing emerging as the year progresses. This seasonal tilt makes the second half look structurally softer in measured terms, regardless of underlying demand conditions.
Each of these four factors reduces the reported inflation number. None of them necessarily reduces the underlying cost burden. Treat second-half relief as a data artefact to be aware of, not a material improvement in living standards.
Why this relief window may be shorter than it looks
Three durable upward pressures are working against the temporary moderation, and the evidence for each is specific enough to quantify.
| Structural factor | Mechanism | Estimated inflation contribution | Wolfe Research assessment |
|---|---|---|---|
| Sticky services and labour costs | Tight labour market keeps wages elevated, flowing directly into healthcare, hospitality, and personal services pricing | Persistent, not separately quantified | Unlikely to ease without meaningful labour market softening |
| Housing and shelter | Rent and owners’ equivalent rent are slow-moving, large-weight components; supply constraints keep pressure elevated | Structurally dominant share of core CPI and core PCE | Market expectation of declining rents offsetting tariff goods inflation is a bet that could fail |
| AI-driven memory component prices | Soaring DRAM and NAND memory demand from AI passes through to computers, smartphones, and devices | Approximately 0.3 percentage points added to core inflation | Computer prices rising at fastest pace in decades; could keep core inflation elevated through 2026-2027 |
The AI finding deserves particular attention. Technology has historically been a deflationary force in CPI, the category you could count on to drag the index lower. That relationship has reversed. According to Wolfe Research, AI-related demand for DRAM and NAND memory has pushed computer prices up at their fastest pace in decades, and smartphone prices are following. If you have built portfolio expectations, or personal budgeting assumptions, on the idea that technology gets cheaper over time, that assumption needs to be revisited.
The memory chip pricing cycle now running through at least 2028 is the mechanism behind Wolfe Research’s finding that technology has reversed from a deflationary to an inflationary CPI force, with DRAM and NAND capacity structurally redirected toward AI data centre customers.
Services inflation, meanwhile, is directly tethered to wages. As long as labour markets remain tight and wage growth stays firm, healthcare, hospitality, and personal services will keep rising even as goods and energy disinflate. The shelter component moves slowly but carries enormous weight, and the market’s assumption that declining rents will offset tariff-driven goods inflation is, as Wolfe Research frames it, a bet that could fail if housing supply constraints persist.
Understanding why seasonal adjustment makes H2 inflation look better than it is
Here is where the measurement system itself creates an optical illusion worth understanding.
Standard seasonal adjustment models were calibrated on pre-pandemic pricing behaviour. The post-pandemic economy behaves differently: businesses front-load price hikes early in the year, and promotional discounting clusters later. Seasonal adjustment formulas built on the old pattern may not fully capture this shift, which means they can systematically flatter second-half readings.
Seasonal adjustment models calibrated before the pandemic may understate inflation in early months and overstate it later, making July-December readings look milder than the underlying trend warrants.
Compounding this problem, a number of the components that flow into core PCE carry no seasonal adjustment whatsoever. This amplifies the measured gap between first-half and second-half inflation, making the second half look comparatively benign even when the underlying trend remains above the Fed’s 2% target.
How corporate front-loading distorts the annual inflation picture
The business logic is straightforward. Customers have less flexibility to resist price increases in January when budgets reset and contracts renew. B2B contracts and subscription services are particularly prone to this pattern, with annual repricing concentrated in Q1.
If demand holds through the second half of 2026, expect businesses to once again cluster price hikes at the start of 2027. What looks like inflation cooling in July through October may partly be the calendar doing the work, and the reader should expect renewed pressure when repricing season arrives in Q1 2027.
This is not a reason to dismiss soft prints. It is a reason to interpret them with appropriate precision.
What the Fed is actually signalling, and why it matters for the next 12 months
The Federal Reserve is not treating June’s soft print as mission accomplished. The most concrete evidence sits in the latest dot plot.
The dot plot revision from the June FOMC meeting shifted the median year-end rate projection upward, placing at least one further 25 basis point increase into the Fed’s own baseline and setting the hawkish context that now frames every subsequent inflation print.
- FOMC dot plot: at least half of the 19 participants indicated support for a minimum of one interest rate increase during 2026.
- Core PCE at 3.4% year-over-year (May 2026) is the data point motivating that caution.
- Wolfe Research’s end-2026 core inflation projection of approximately 2.7% implies above-target inflation persisting through year-end.
At least half of the 19 Federal Open Market Committee participants indicated support for a minimum of one rate increase in 2026, as reflected in the updated dot plot.
That tells you something important about how to position. Even if inflation prints run softer in the second half, the Fed has already signalled it is not ready to declare victory. The committee sees the same temporary-versus-structural distinction that Wolfe Research has mapped, and it is keeping optionality for tightening if core pressures persist.
For rate-sensitive positions, this means tail risk is higher than a soft June CPI might suggest. Front-running a dovish pivot the committee itself has not committed to carries real cost if even one hike materialises.
Portfolio and purchasing decisions for a world of slower-but-sticky inflation
The analysis built across the previous sections produces a specific decision framework. The near-term data will look friendly. The structural picture has not changed. Here is how to position around that tension.
- Bond and duration investors. The near-term backdrop, milder prints combined with a Fed inclined to hold, makes duration risk more manageable than during the early-2026 inflation flare-up. However, aggressively extending into long-duration bonds assumes inflation is solved. According to Wolfe Research, the data does not support that assumption, and one unexpected hike would reprice the long end sharply.
- Equity investors. Growth stocks, rate-sensitive financials, and real estate can benefit if the Fed keeps rates steady and inflation data stay benign. But the AI-driven memory price pressures identified by Wolfe Research are a specific watch item for technology-heavy portfolios. If those costs continue passing through, margins in hardware-adjacent sectors will compress even as the broader inflation picture moderates.
What consumers should expect at the checkout line through year-end
- Consumers. The second half of 2026 is likely to feel somewhat more comfortable than the first: more promotional pricing, softer energy costs (assuming no geopolitical spike), and a pause in fresh tariff pass-throughs. But this is not deflation, which would mean prices actually falling. Prices are still rising, just more slowly. Cumulative inflation over the past several years remains embedded, and core inflation at approximately 2.7% by year-end still means the cost of living continues to climb.
Any assumption that lower inflation equals lower prices is incorrect. The rate of increase is moderating. The price level is not coming back down.
This article is for informational purposes only and should not be considered financial advice. Investors should conduct their own research and consult with financial professionals before making investment decisions. Past performance does not guarantee future results. Financial projections are subject to market conditions and various risk factors.
The variables that will decide whether 2027 is a rerun of 2021
Three variables carry the most power to determine whether 2027 sees inflation re-accelerate or settle. Track these, and you have a monitoring framework that updates with every data release.
| Variable | Current status | Upside inflation risk | What to monitor |
|---|---|---|---|
| Housing and shelter costs | Structurally dominant in core CPI and PCE; expected rent declines not yet materialising at scale | Housing supply constraints persist, keeping rents elevated and invalidating the market’s offsetting assumption | Monthly owners’ equivalent rent readings; housing starts data; rental vacancy rates |
| AI-related memory and component pricing | Approximately 0.3 percentage points already embedded in core inflation | Sustained AI demand keeps DRAM and NAND prices elevated, turning technology from deflationary to inflationary | Quarterly memory pricing reports; computer and smartphone CPI sub-indices |
| Corporate pricing behaviour in Q1 2027 | Post-pandemic pattern of front-loaded January-March hikes well established | Strong demand gives businesses confidence to push larger Q1 price increases, erasing H2 2026 relief | ISM prices-paid surveys; corporate earnings call commentary on pricing power; January 2027 CPI release |
The current soft window is not a resting state. It is a pause between two distinct inflation episodes. Wolfe Research frames tariffs as policy-driven and therefore reversible in either direction, meaning new escalation or an energy price shock could collapse the temporary-versus-structural distinction quickly.
A forward-looking monitoring framework is more useful than a static forecast. The three variables above give you the analytical scaffolding to update your own view as new data arrives, rather than relying on any single projection.
Consumer inflation expectations across major surveys ranged from 3.5% to 6.2% for the year ahead as of late June 2026, remaining historically sensitive to policy announcements and creating a fragility in inflation psychology that could amplify any Q1 2027 repricing episode beyond what the underlying data alone would warrant.