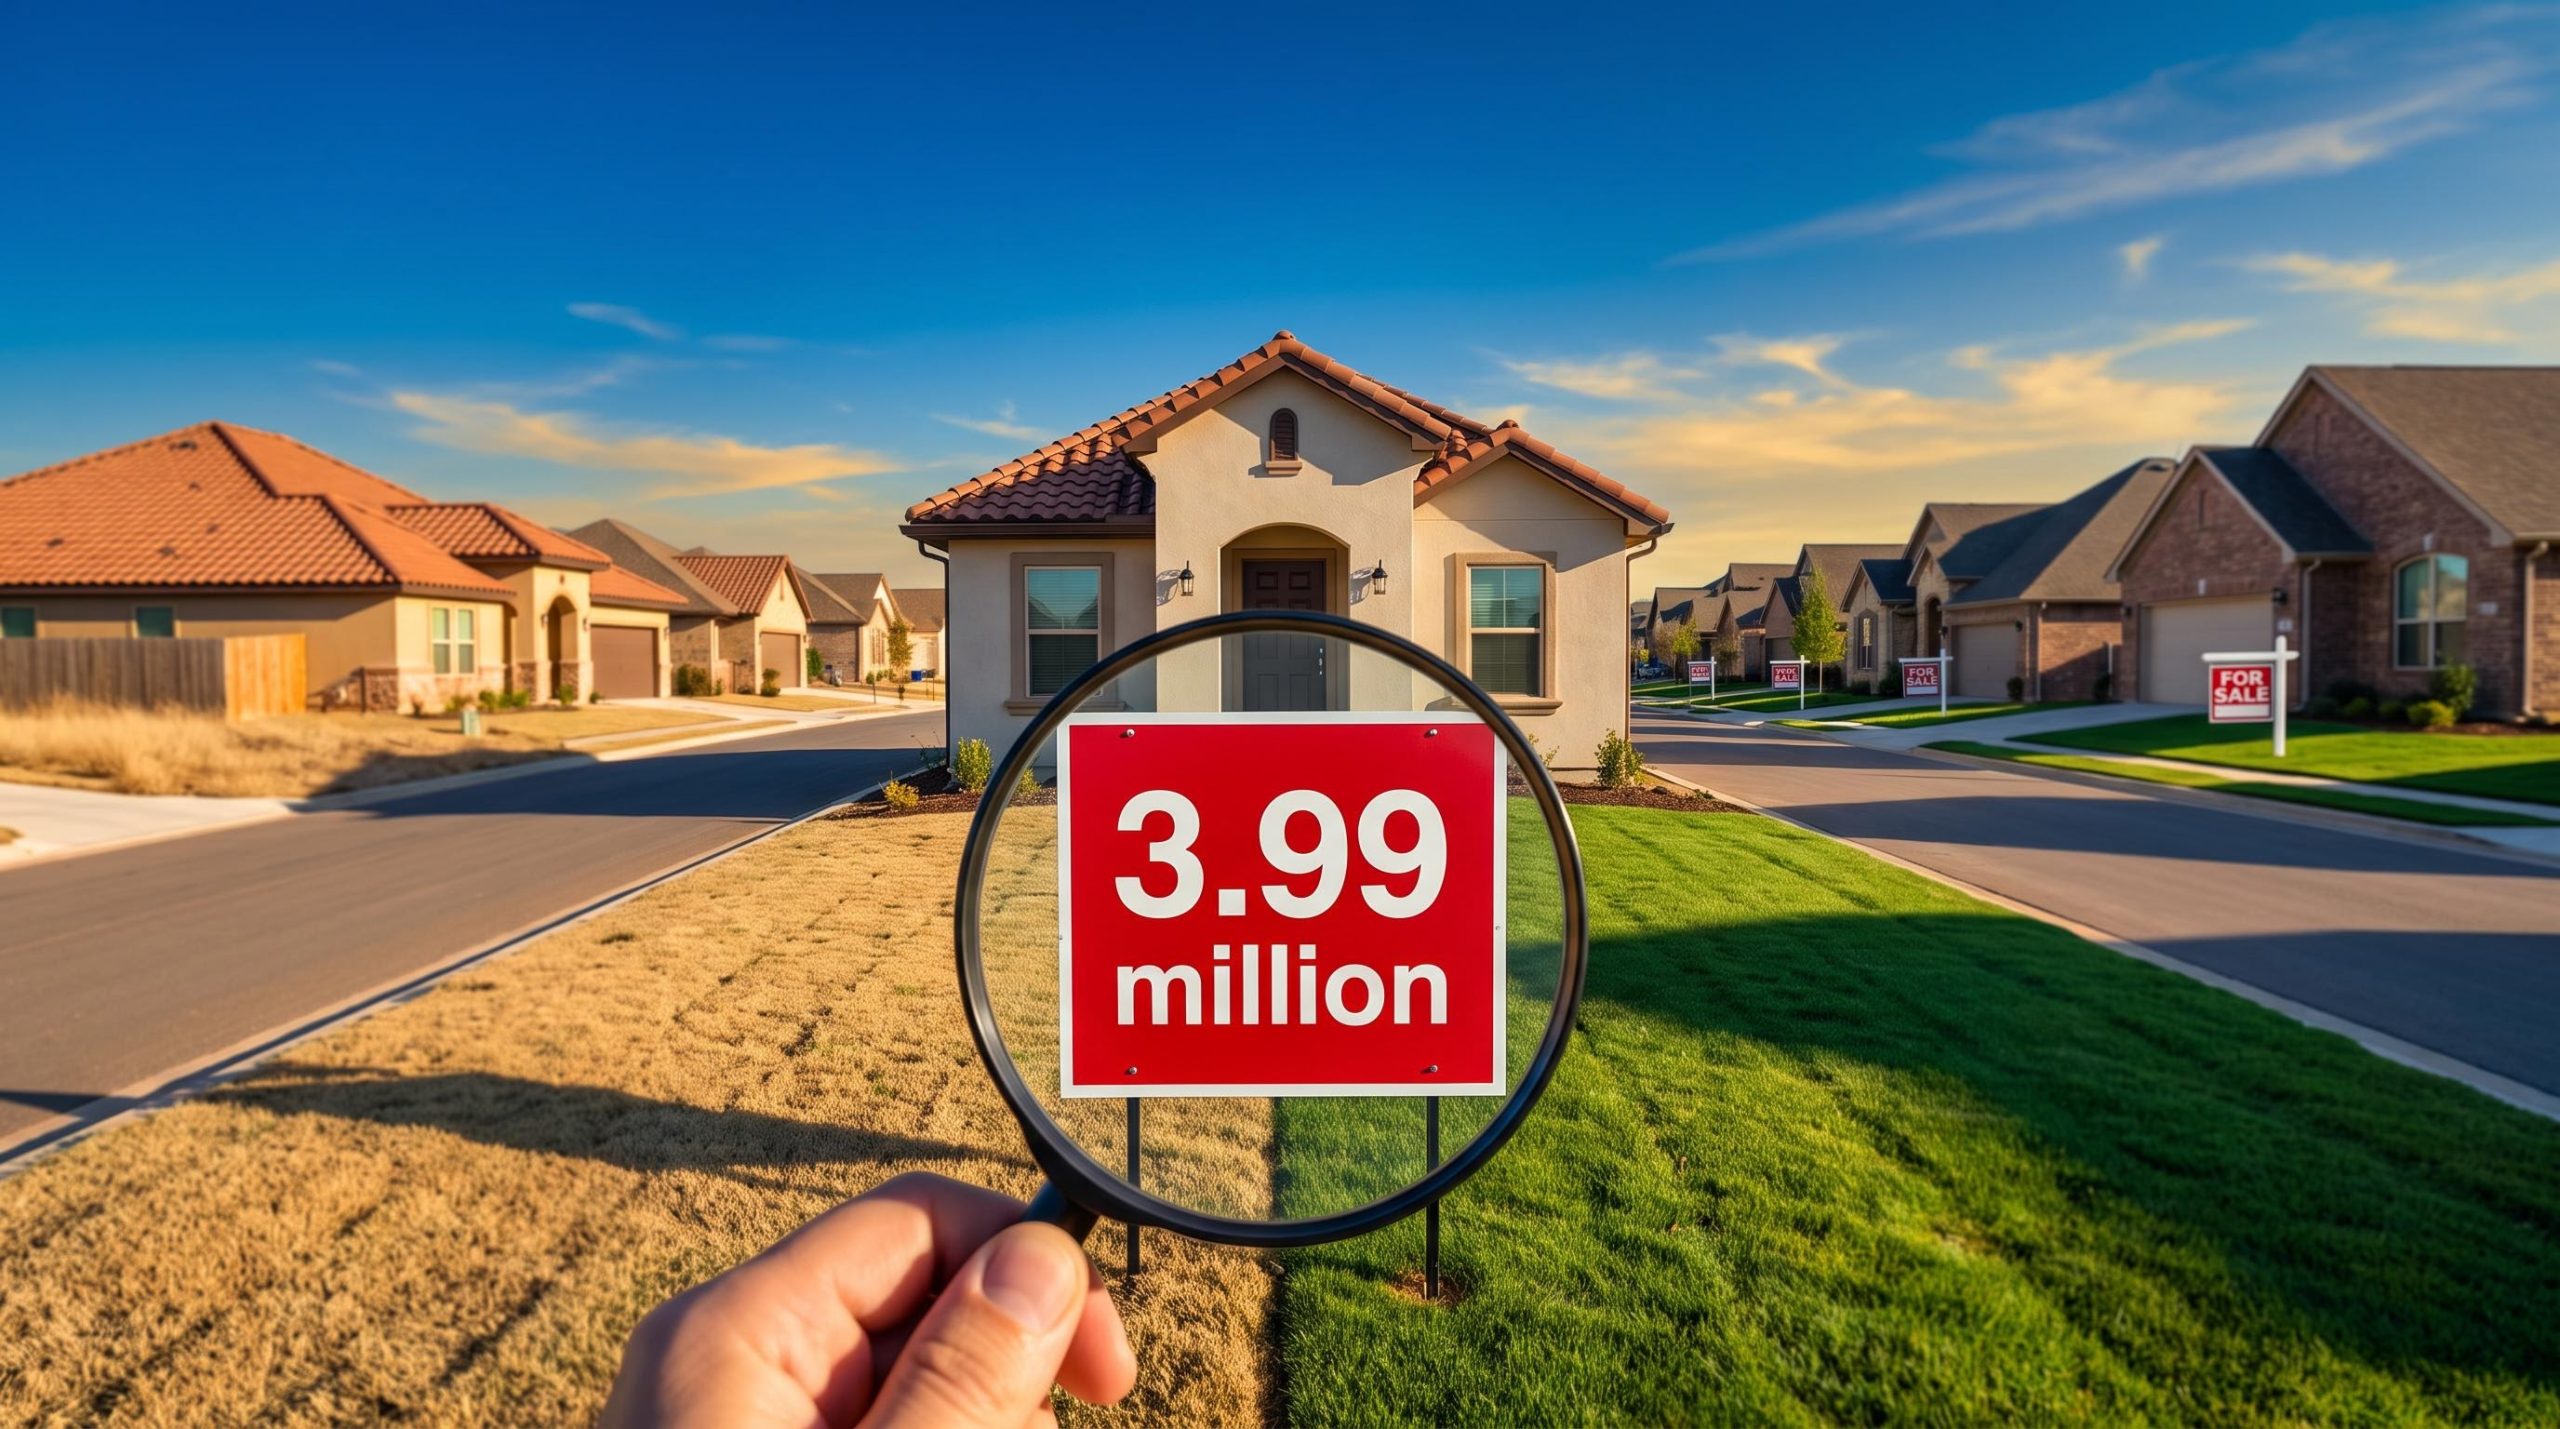
September’s existing-home sales ran at an annualised 3.99 million, a pace last seen around 2009. Yet the national median price still rose 1.3% year over year to $417,500. If you have been waiting for a US housing market crash to show up in the price headlines, that gap is the signal you may be missing.
Buyers, sellers and investors are asking whether a 2008-style collapse is coming. The data points somewhere different, and far more uneven.
The pressure behind it is plain enough. Freddie Mac put the average 30-year fixed rate at 7.40% for the week ending 8 October 2026, high enough to freeze buyers and owners alike.
Here is where the weakness is real, where it is not, and which signals deserve your attention before you buy, sell or invest.
Is this a crash or a slow grind? What the national numbers actually show
The sales figure is alarming. The National Association of Realtors (NAR) reported yesterday that September existing-home sales edged up 1.5% from August’s 3.98 million, which had slipped below the 4 million mark. Nick, a housing analyst at Reventure, argues that relative to the size of the housing stock, demand is the weakest in about 40 years.
Then the price data complicates the story.
| Metric | Latest figure | Comparison | Source |
|---|---|---|---|
| Existing-home sales | 3.99M annualised | Up 1.5% month over month | NAR, 13 October 2026 |
| Median price | $417,500 | Up 1.3% year over year | NAR, 13 October 2026 |
| Inventory | 1.60M homes | Up 4.6% year over year | NAR, 13 October 2026 |
| Months’ supply | 4.8 | 4.5 a year earlier | NAR, 13 October 2026 |
| 30-year fixed rate | 7.40% | Week ending 8 October | Freddie Mac |
Supply is building, but slowly. Redfin describes a correction likely to take years, and Zillow now expects national values to fall 0.2% by December 2026, down from an earlier forecast of a 1.2% gain.
Sellers outnumber buyers Redfin’s August measure found homeowners listing properties outnumbered buyers by 58%.
What defines this market is low turnover, not forced selling. For you, the pain shows up as being unable to transact at a price that works, rather than as a headline crash, so timing and local conditions matter far more than the national average.
The 7.40% rate is also reshaping the lending side, where mortgage industry consolidation is accelerating as lower volumes and thinner margins push many lenders to seek buyers while home prices stay supported by scarcity.
When big ASX news breaks, our subscribers know first
Why the market is K-shaped: a tight Northeast and Midwest, a resetting Sunbelt
What the K-shape means
A K-shaped market is one where two parts move in opposite directions. One arm rises because supply is scarce; the other falls because supply is plentiful. The national average sits between them and describes neither.
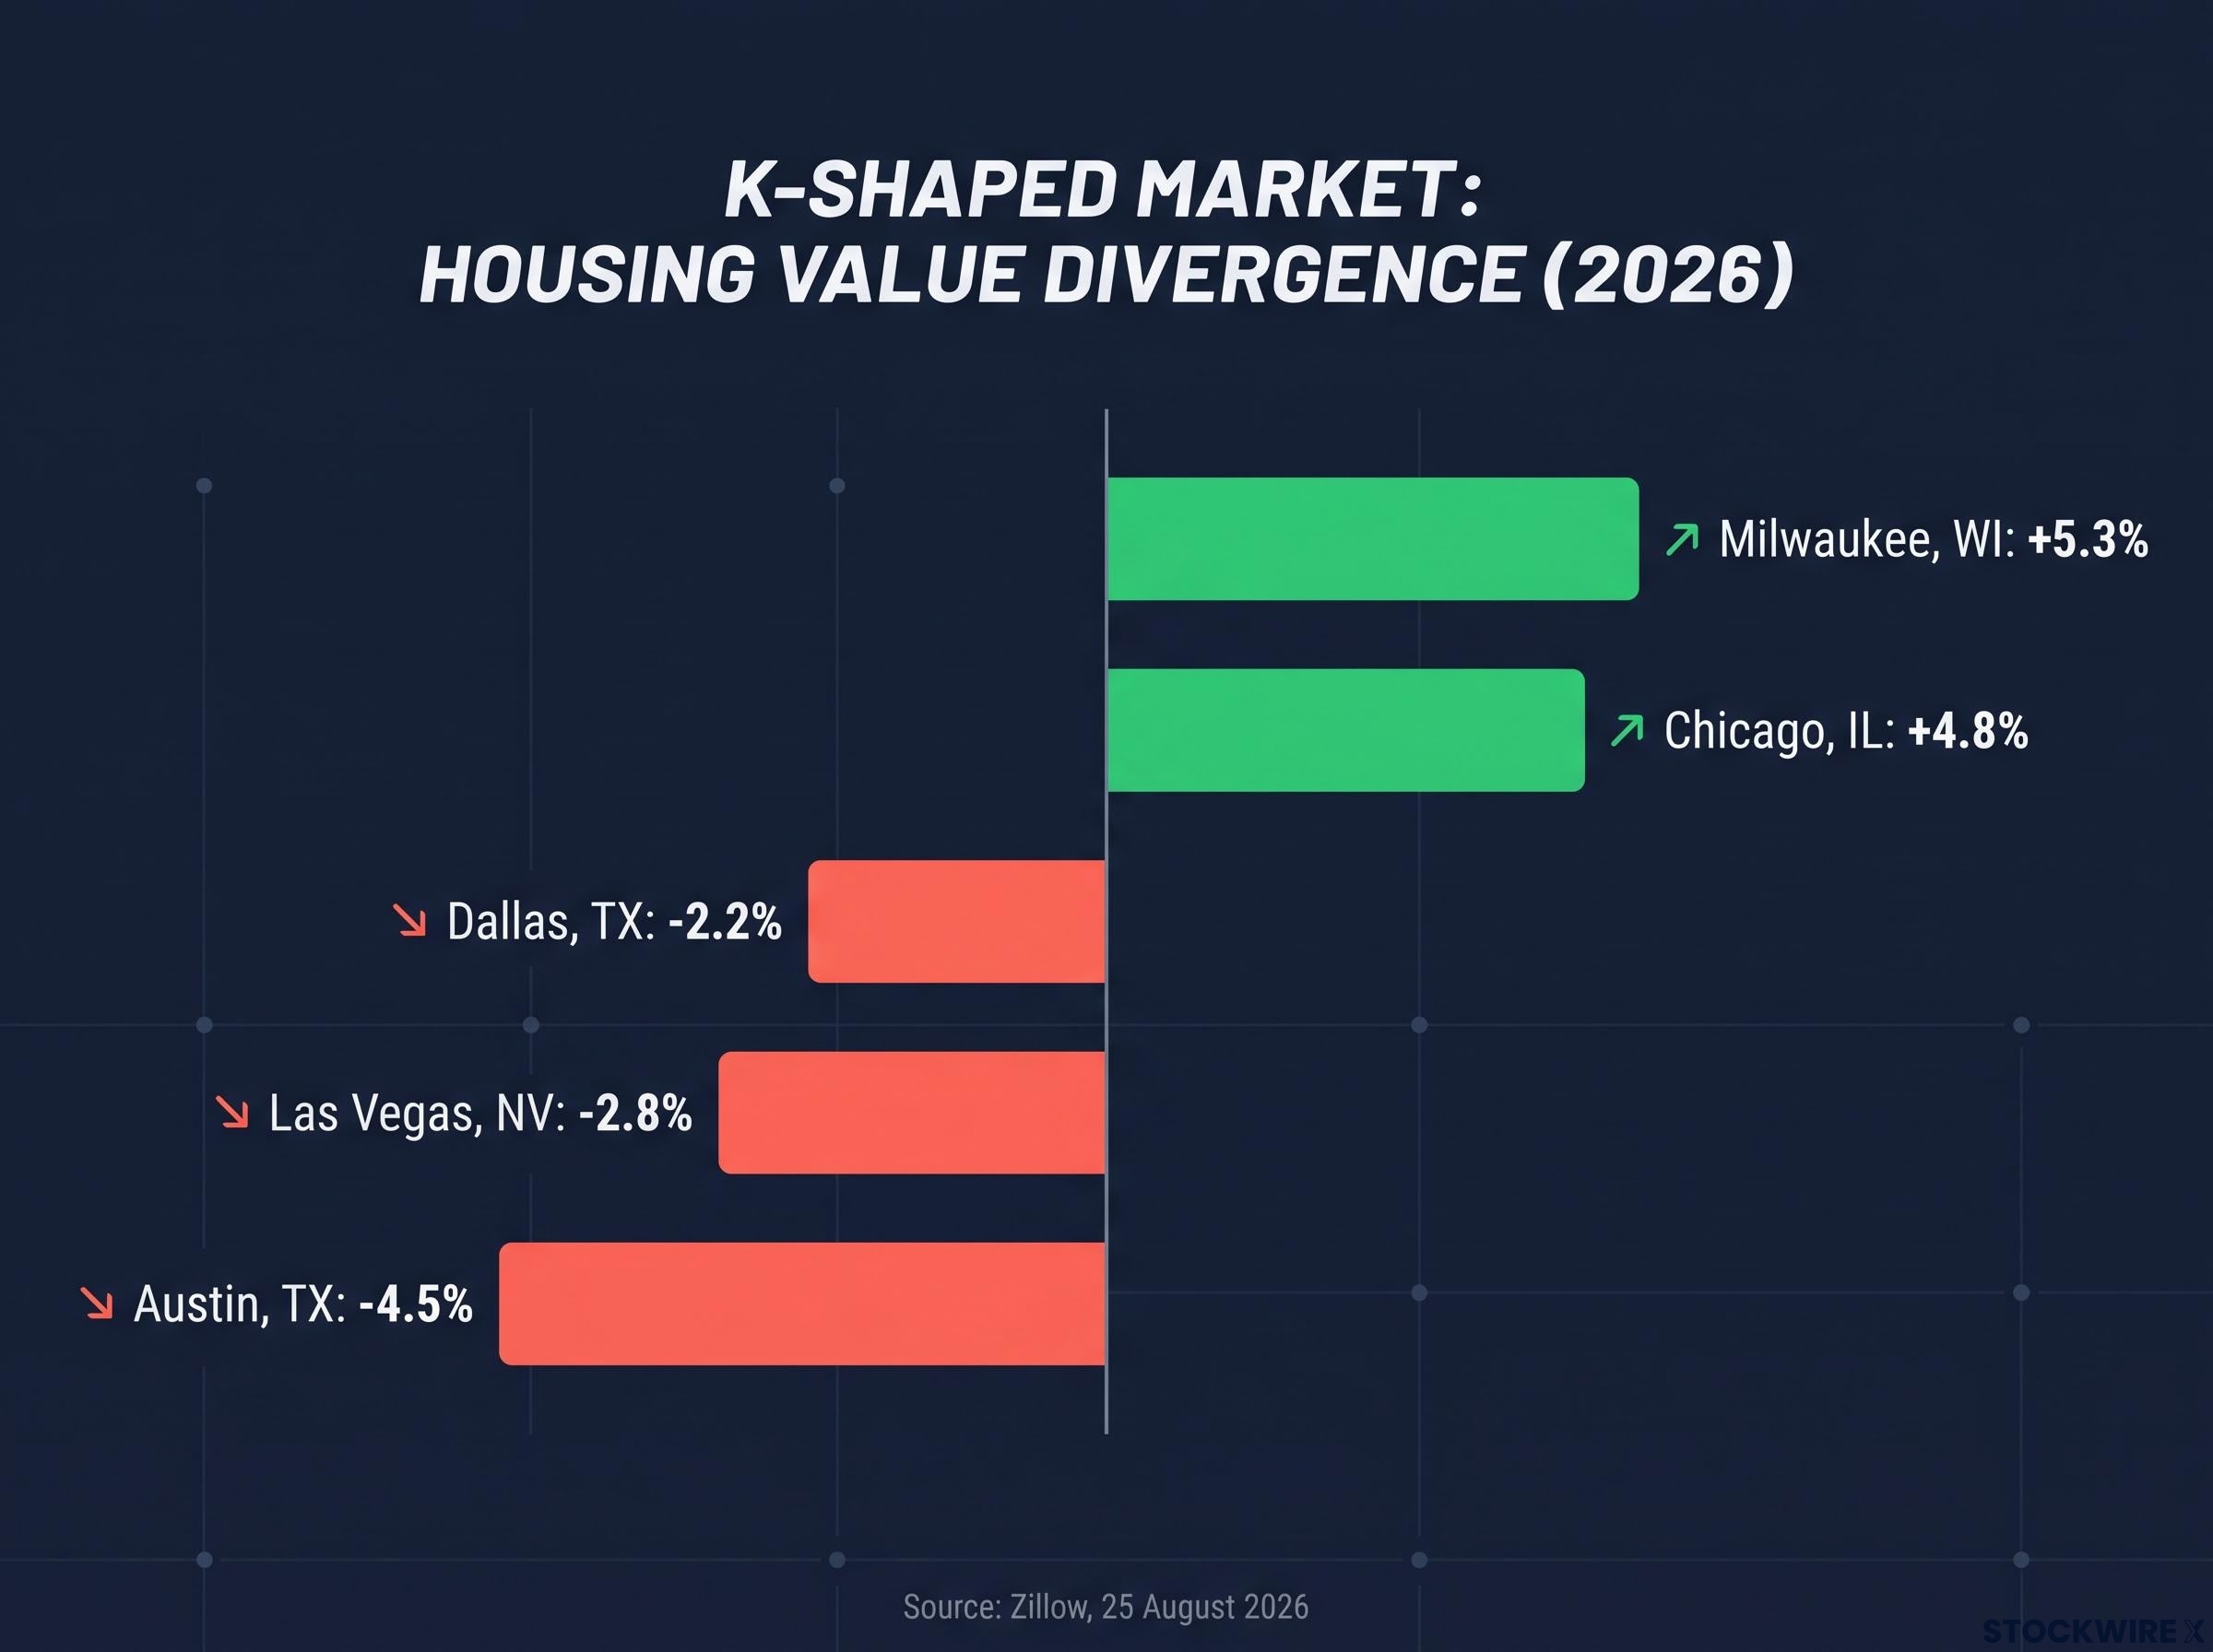
In housing, the rising arm is the Northeast and Midwest; the falling arm is the South and West. Reventure’s Nick argues that even the widely cited national shortage of 3-5 million homes is really a regional phenomenon.
| Metro | Year-over-year change | Source and date |
|---|---|---|
| Austin, TX | -4.5% | Zillow, 25 August 2026 |
| Las Vegas, NV | -2.8% | Zillow, 25 August 2026 |
| Dallas, TX | -2.2% | Zillow, 25 August 2026 |
| Chicago, IL | +4.8% | Zillow, 25 August 2026 |
| Milwaukee, WI | +5.3% | Zillow, 25 August 2026 |
Measurement matters too. Redfin had Florida roughly flat (-0.027%) in September, while Zillow showed -0.9%, a gap explained by different methods, coverage and dates. Over longer windows the picture sharpens: Nick puts Austin down 27% cumulatively over four years, not in one year.
Why the Sunbelt is resetting
The drivers, roughly in order of weight:
- Post-pandemic overbuilding as 2021-23 supply arrived into cooling demand (one analysis also cites softer tech jobs, though this is lightly supported)
- Insurance and HOA costs, which shrink what buyers can pay for the house itself
- Normalising migration, with net migration to some Sunbelt markets down 60-80%, per Nick
- Apartment deliveries creating a rental overhang
- Rate lock-in, where owners holding cheap mortgages refuse to sell into 7% rates
Rates and the current inventory wave are cyclical; insurance, the migration cycle and apartment oversupply are structural. Meanwhile, Nick says New Jersey suburbs are rising about 5-8%. Some Florida condos and townhomes are down 40-50% from peak, and half of Atlanta’s map is down 15-25% over four years while the other half rises. “The housing market” is the wrong unit of analysis: your zip code, property type and price tier will decide your outcome.
The wider structural correction running through 2028 reflects Treasury yields near 5%, which keep mortgage rates elevated even after Fed cuts and leave real prices drifting lower for years.
The affordability math keeping buyers on the sidelines
The squeeze is easiest to see in a household budget:
- A typical monthly payment, including taxes and insurance, runs about $2,850.
- Over a year, that is roughly $35,000-36,000.
- Median household income is about $87,000.
- The payment absorbs around 40% of gross income.
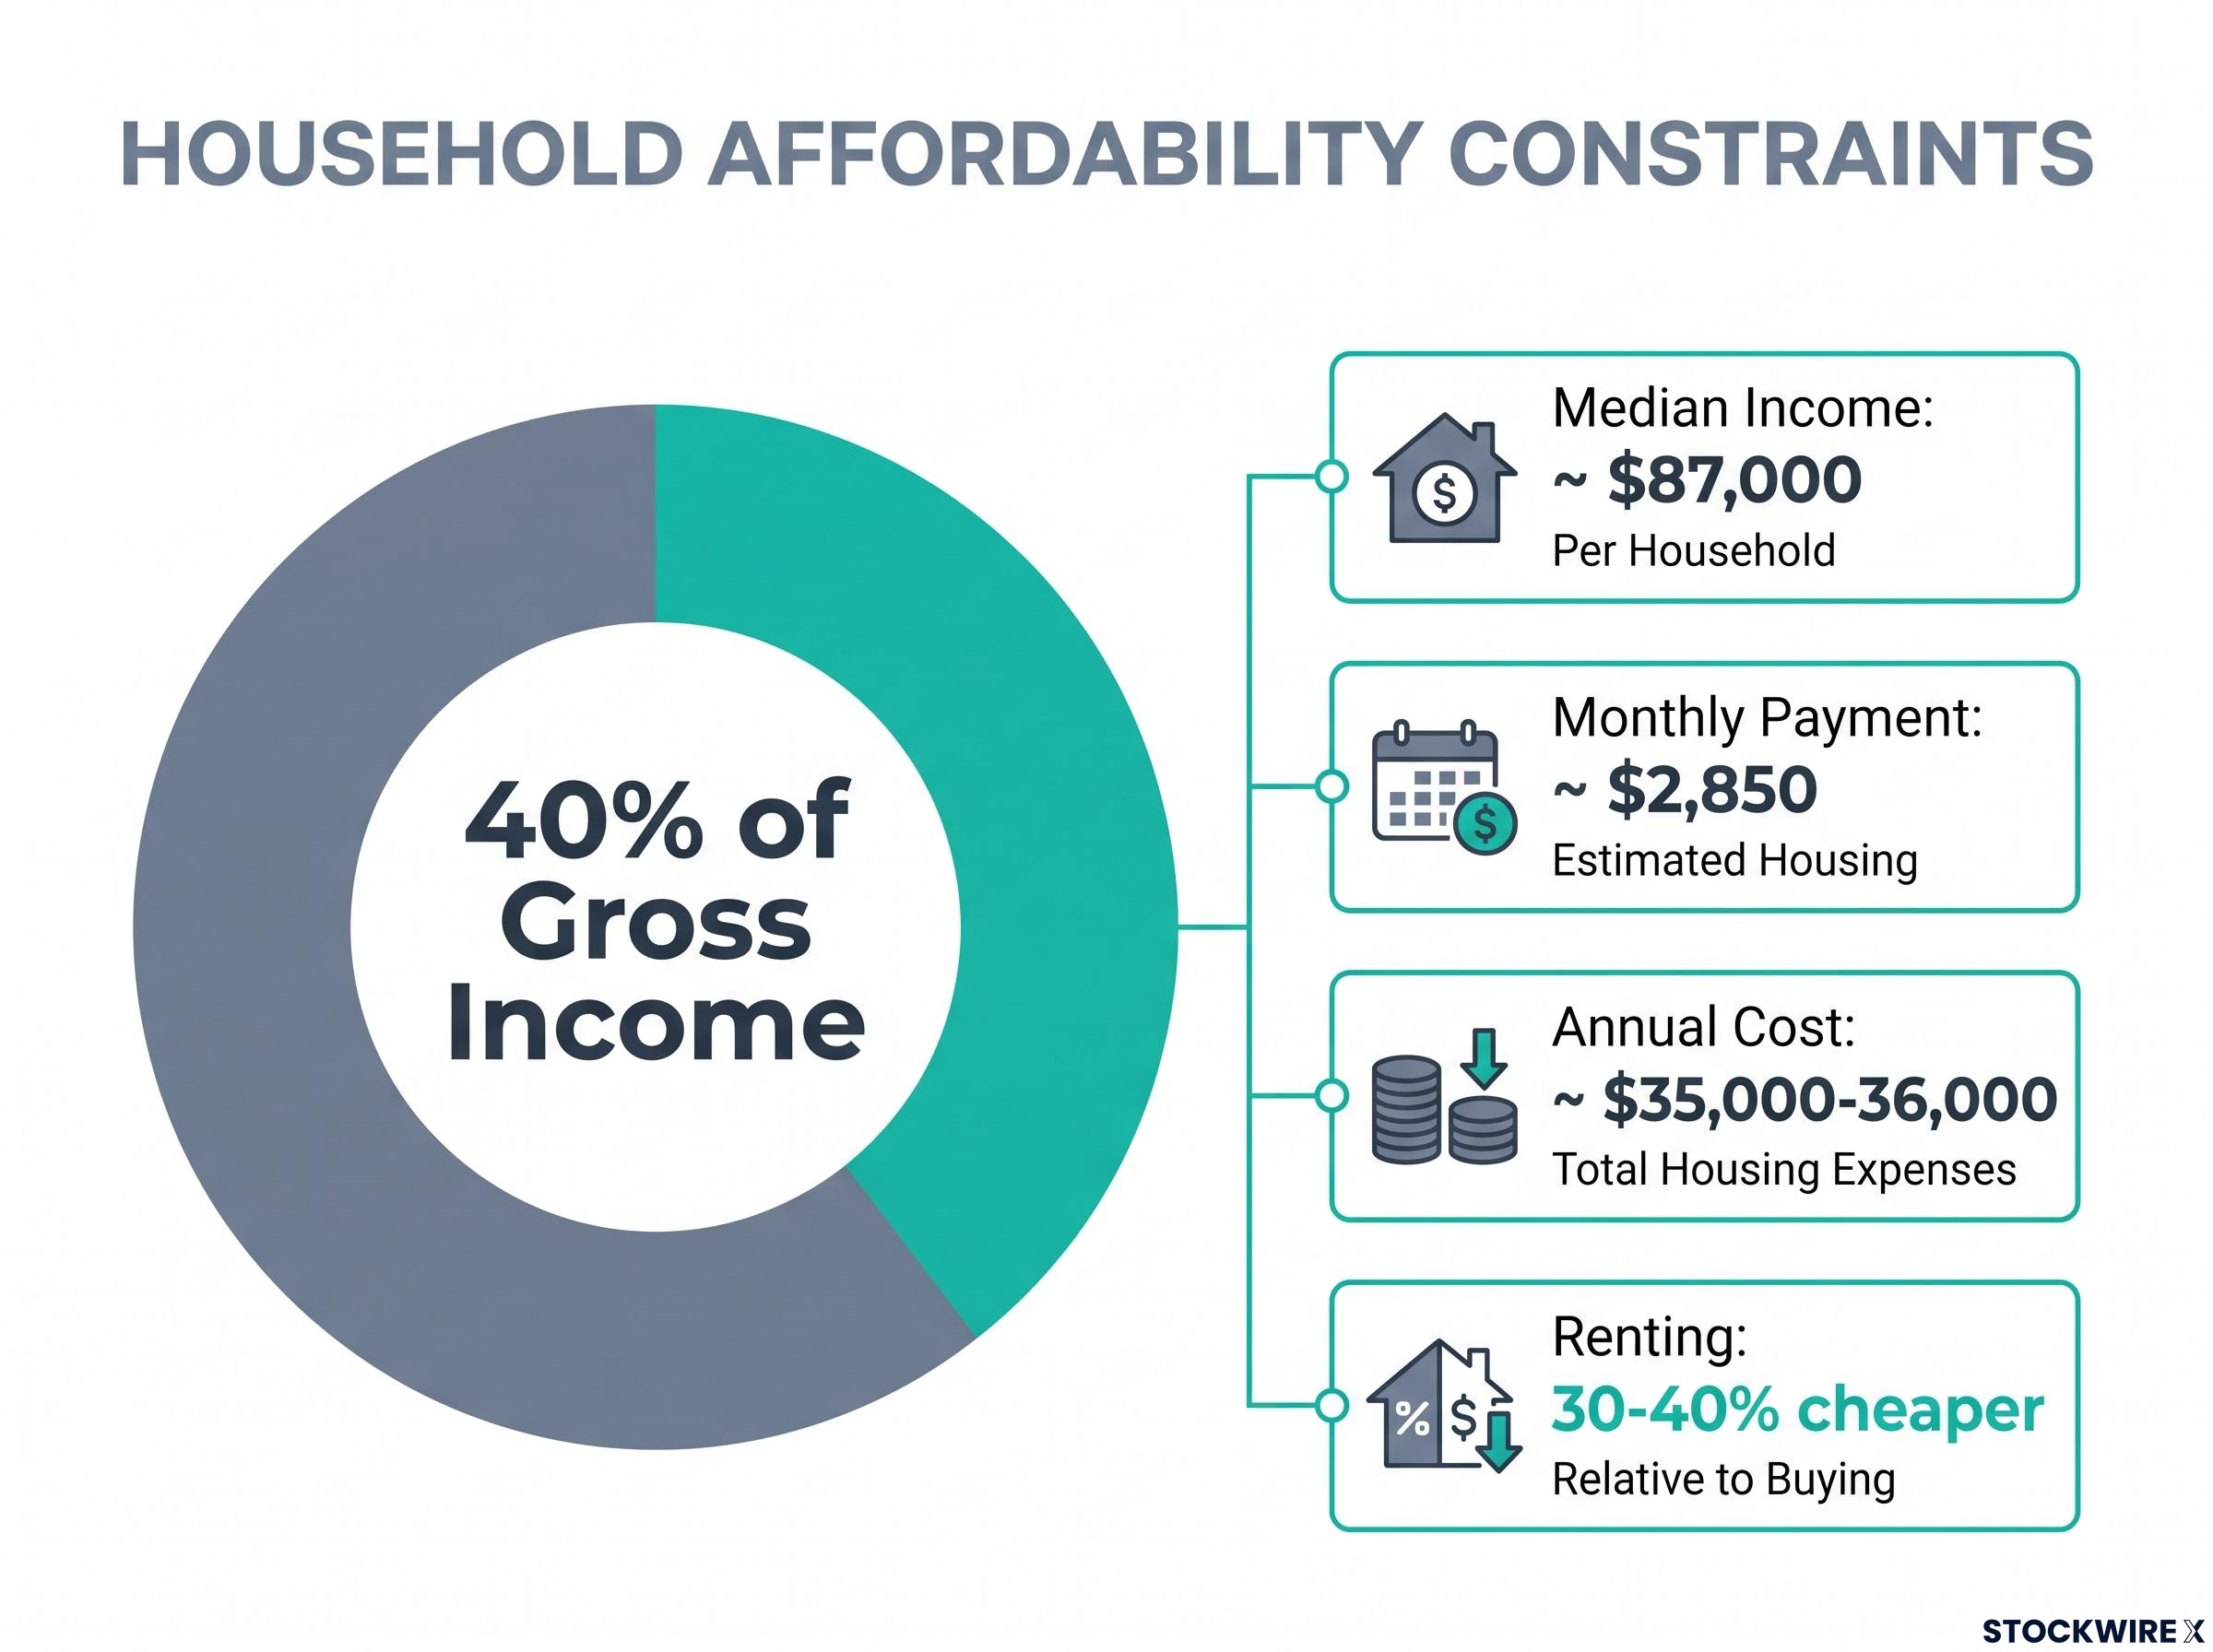
Renting the same house can be 30-40% cheaper. Sellers on ~3% mortgages, meanwhile, have little reason to move.
The qualification wall Lennar reportedly said about half of its site visitors do not qualify for a mortgage.
Builders, about 15% of sales, lean on buydowns; D.R. Horton reported a backlog at a 4.9% rate. Even so, Austin and Florida show weak sales despite falling prices. Rates have swung between about 5.8% and 7.6% over four years without noticeably reviving demand, and Reventure suggests recovery likely needs rates near 5% plus price falls of roughly 20%.
The uncomfortable conclusion: cheaper homes alone have not brought buyers back. If you are buying, what the seller likely paid and their likely mortgage rate are better negotiating signals than the national rate. Nick bought a home this year for $330,000 that had sold for $490,000 in 2023.
Lennar’s price cuts and Berkshire’s stake: what the builders are signalling
Builders are cutting prices quietly. Lennar reported incentives of about 12.0% of sales in fiscal Q3 2026, but that bundles rate buydowns, closing-cost help and base-price changes. It is not a flat 12% discount on every home.
Lennar’s average sales price fell 2.9% to $372,000. Nick claims a roughly 30% decline since 2022, but that figure could not be verified; the confirmed number is far smaller.
| Company / position | Key metric | Detail | Period |
|---|---|---|---|
| Lennar | 15.8% gross margin | 20,840 deliveries, down 3.4% | Fiscal Q3 2026 |
| D.R. Horton | 20.7% gross margin | 23,983 closings; FY2026 guide 20.5%-21.0% | Fiscal Q3 2026 |
| Berkshire in Lennar | ~13.11M Class A shares | ~$1.16B, up ~30% in quarter | Q2 2026 13F |
| Berkshire in D.R. Horton | 3,564 shares | ~$580,504, negligible | Q2 2026 13F |
Lennar is choosing volume over margin; D.R. Horton is protecting profitability. Then there is Berkshire Hathaway, a stake easily over-read as a bottom call. It looks more like a long-term bet on scarcity, scale and eventual rate relief, and Lennar remains a small part of Berkshire’s portfolio. The risks are clear:
- Margin compression if incentives stay elevated
- Buydowns expiring while insurance, taxes and HOA fees remain high
- Heavy Sunbelt and West concentration
Builder incentives can mask price weakness in official statistics. Berkshire’s position is a reason to watch builders, not a reason to assume the floor is in.
Investor and multifamily stress: where the refinancing pressure really sits
The headline is a wall of debt. About $1.5 trillion of multifamily debt must be refinanced over four years, according to Walker, reported by GlobeSt on 13 October 2026. Nick cites a Wall Street Journal figure of $2 trillion, which could not be independently located.
The real stress sits with individual borrowers. Most multifamily loans run five to 10 years, and landlords who locked in 3-4% are now refinancing near 6-6.5%, sometimes doubling interest costs. That collides with falling rents: down about 20% in Austin and nearly 10% in Nashville, with investors reporting distressed discounts of 20-30%.
The refinancing strain in multifamily fits a wider pattern: the lagged effects of rate hikes typically peak two to three years after tightening begins, which places commercial property and private credit stress squarely in 2026.
Single-family rentals look little better. A cap rate (annual rental income as a share of purchase price) of 4.8% trails a 10-year Treasury above 5%, so a risk-free bond pays more.
The institutional buyer ban, in brief
The 21st Century ROAD to Housing Act, enacted in July 2026, bars for-profit firms owning at least 350 single-family homes from buying more one- or two-unit homes. Some coverage described it as already in force; the prohibition actually begins 7 January 2027, sunsets after 15 years and forces no sales. Exceptions include:
- New construction and build-to-rent
- Substantially rehabilitated homes
- Foreclosures and debt satisfaction
This is a leveraged-borrower problem concentrated in multifamily and Sunbelt rentals. It reaches you through discounted deals and local rents, not through your own mortgage.
How today compares with 2008, and where it could get worse
The differences are reassuring. In 2008, subprime, low-documentation and adjustable-rate lending turned falling prices into mass defaults. Today, underwriting is tighter and owner equity higher, so stressed owners can sell rather than default.
| Factor | 2008 | Today |
|---|---|---|
| Lending standards | Subprime, low-doc, ARMs | Tighter underwriting |
| Owner equity | Thin, highly leveraged | Higher; sales replace defaults |
| Delinquencies | About 8-9% | No comparable single-family surge |
| Supply pattern | National glut | Regional: Sunbelt excess, Northeast shortage |
The 2008 benchmark The foreclosure rate peaked near 4.85% around 2010-2011.
The comparison grows less comfortable in specific pockets. Multifamily is one: Nick says Fannie Mae and Freddie Mac multifamily delinquencies match 2009 levels, though this is not independently corroborated. Recent low-down-payment buyers and high-HOA condos are others, and Florida short sales, such as a home bought at $450,000 selling for $300,000, show what that looks like.
Unemployment near 4% helps, but prolonged 7%-7.5% rates could push more forced sales through divorce, job loss or rising insurance and taxes. A 2008 repeat is not the base case. Localised distress, however, is a real risk you should price into decisions.
Readers weighing forced-sale risk will find our full explainer on fixed-rate mortgage foreclosure risk useful, as it shows why taxes, insurance and equity drive defaults more than the rate itself.
What a long correction asks of buyers and investors
The evidence points to a prolonged regional correction rather than a synchronised national crash: frozen transactions, selective price falls, squeezed builder margins and refinancing stress concentrated in the Sunbelt and multifamily.
Three signals will tell you whether that verdict holds: mortgage rates relative to 7%, Sunbelt inventory and months’ supply, and multifamily refinancing and delinquency data. Check local listings, price history and seller circumstances before acting on any national figure.
Patience, and a sharp eye on your own zip code, are likely to be rewarded more than any bet on a single national turning point.
This article is for informational purposes only and should not be considered financial advice. Investors should conduct their own research and consult with financial professionals before making investment decisions. Past performance does not guarantee future results. Forecasts and projections are speculative and subject to change based on market developments.