The US dollar index is drifting lower toward 102.20 on Monday 12 October 2026, even though futures markets put the odds of a December Federal Reserve rate hike at 84.1%. A currency facing that much expected tightening would normally be climbing.
The softness is the signal. Traders are not betting against the Fed. They are waiting for proof before committing.
That proof arrives in a compressed window. US consumer inflation (CPI) lands on Wednesday 14 October, followed by producer prices (PPI) and Retail Sales on Thursday 15 October. Two unsettling geopolitical stories sit on top of that calendar: a deadly Houthi missile attack on Riyadh’s main airport, and a disputed claim that Russia and Ukraine agreed to stop striking each other’s energy facilities.
This analysis separates the rate-driven forces from the headline noise. It also lays out what a hot or soft data run could mean for EUR/USD, GBP/USD, USD/JPY and gold.
Why is a Fed hike priced for December but barely for October?
Two very different numbers sit side by side on the CME FedWatch screen. The tool, which converts futures prices into meeting-by-meeting probabilities, shows only a 17.7% chance of a hike at the October meeting. For December, the probability is 84.1%.
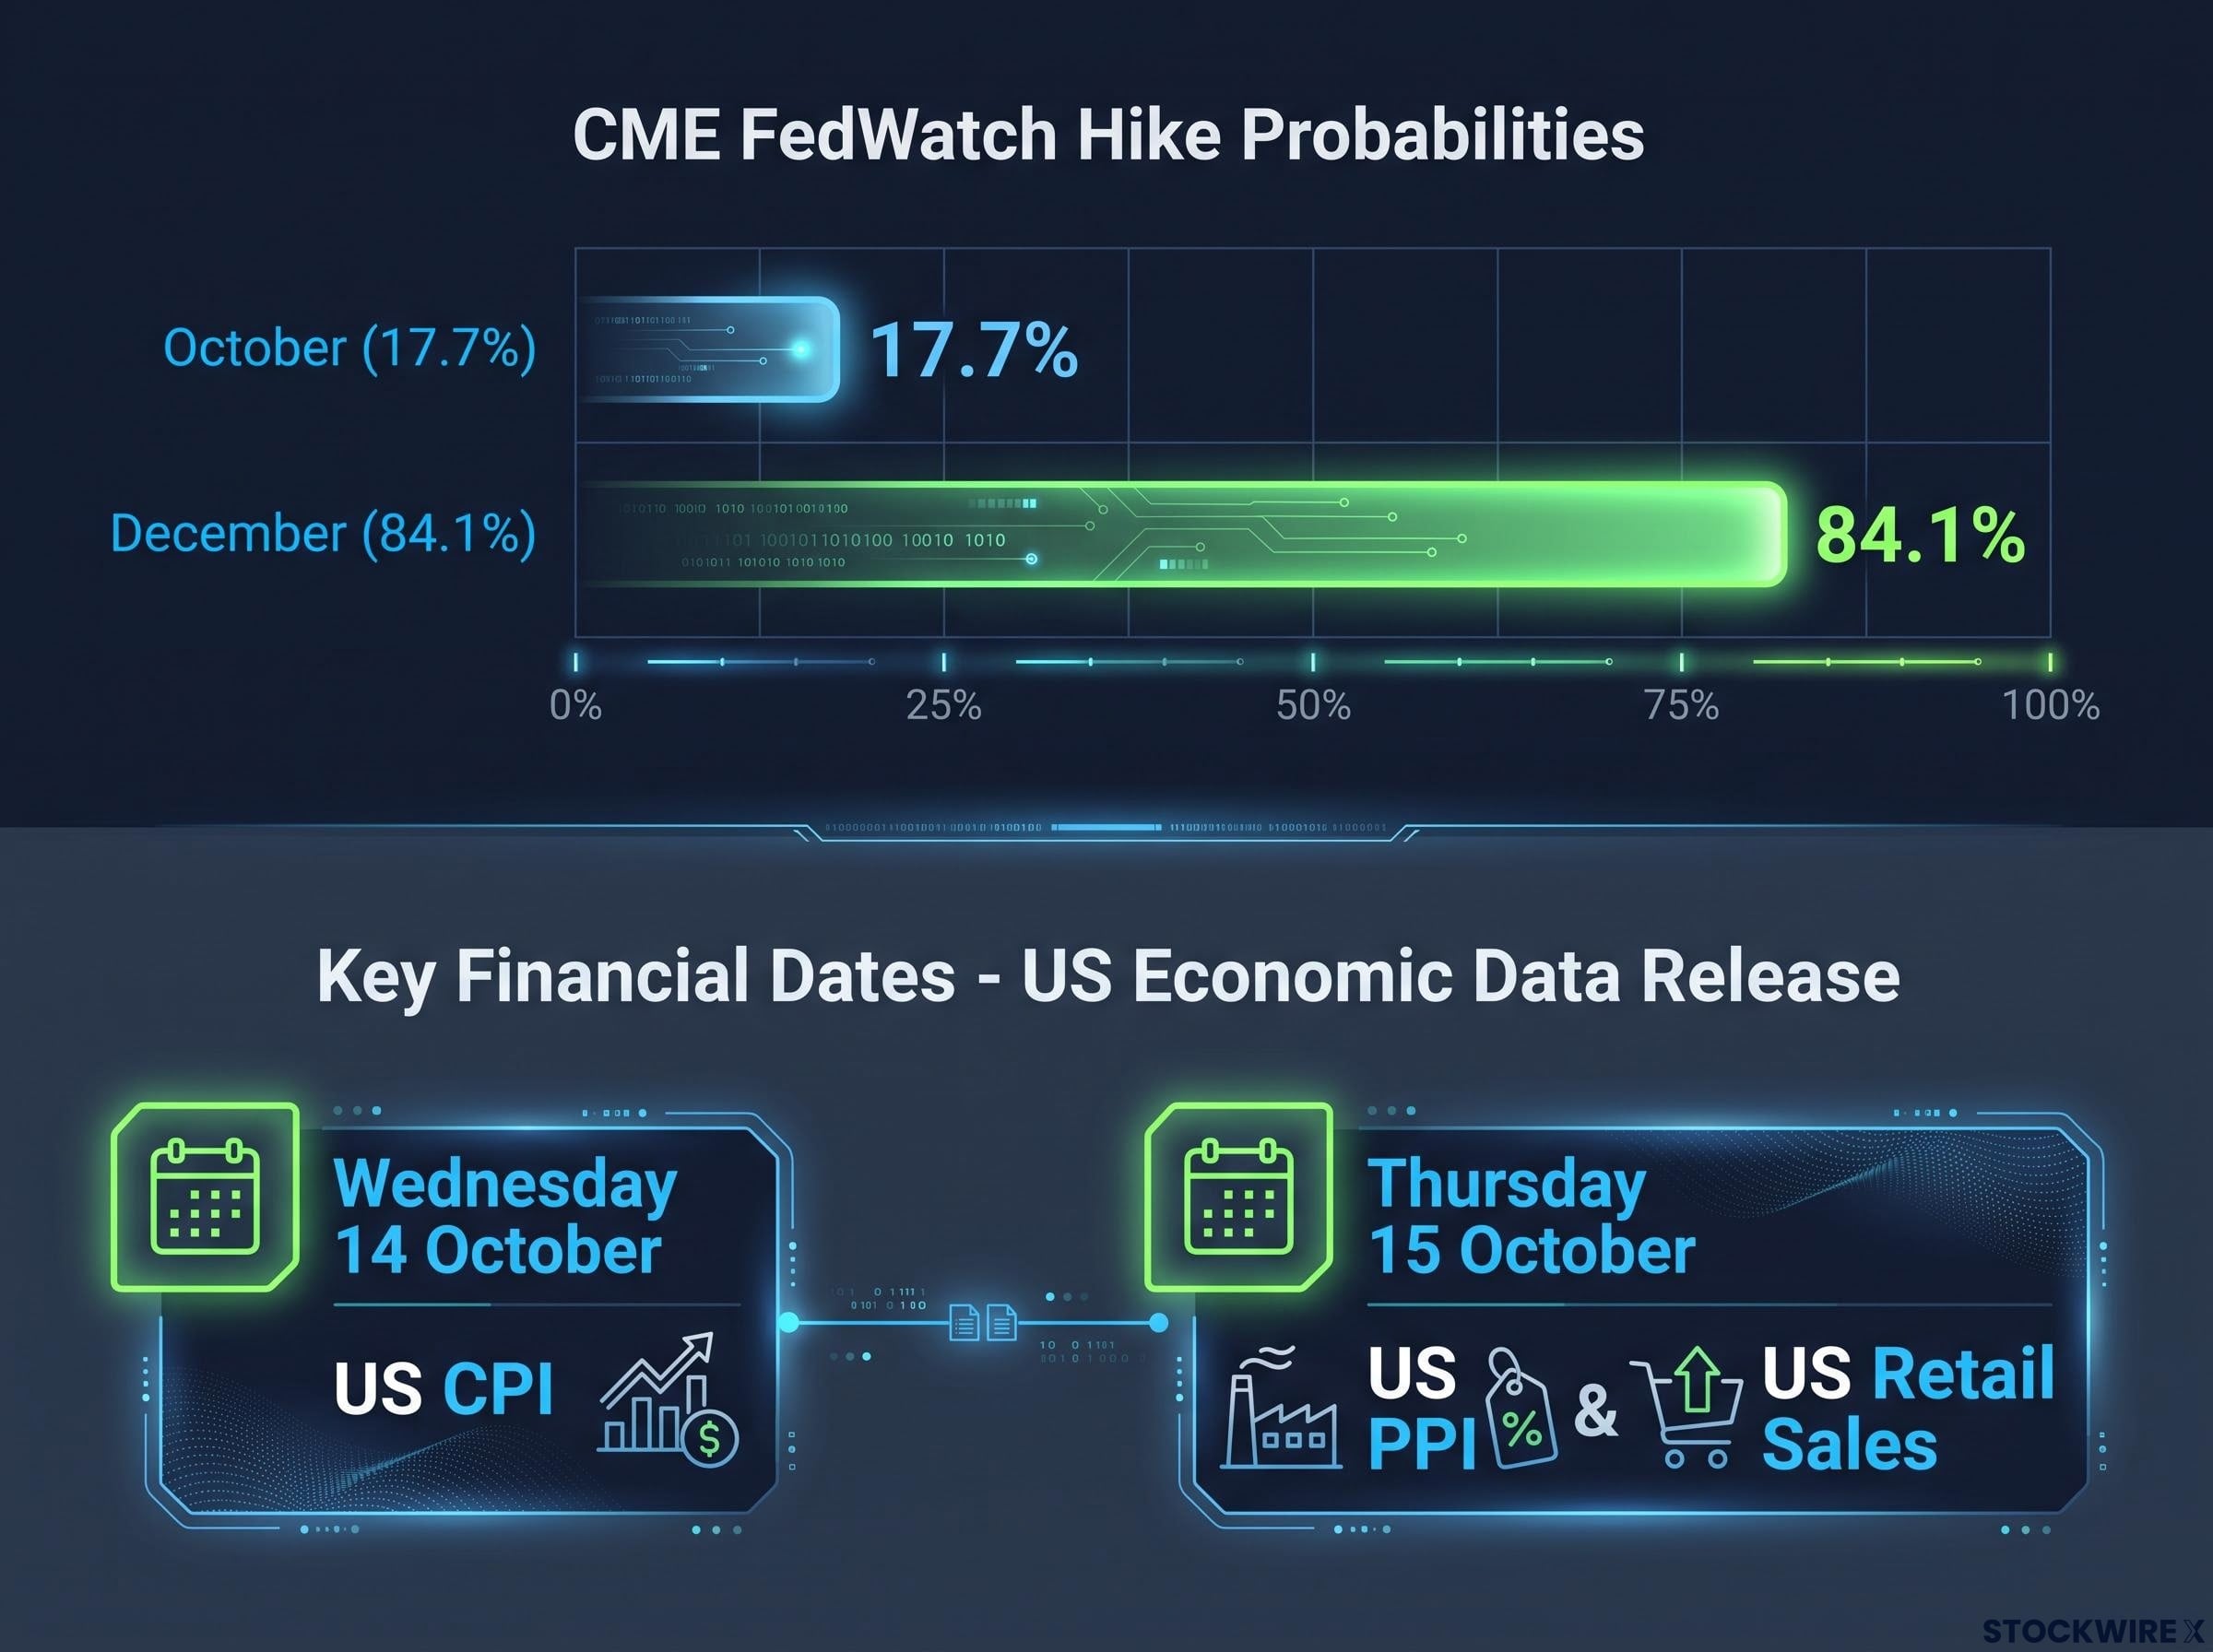
These are not two separate bets. Together they form a timeline of expectation.
The market is saying “not yet, but probably soon.” That gap explains the dollar’s hesitation. Rate expectations offer support, but the payoff sits two meetings away, and every data point between now and then can either confirm the path or erode it.
Key statistic 84.1%: the CME FedWatch probability of a Fed rate increase in December, against just 17.7% for October.
Here is what this pricing tells you. With a December hike already close to fully priced, a hot CPI print confirms what traders already expect, so it adds limited fuel to the dollar. A soft print has much further to travel, because it would force markets to unwind a position they have largely built. The risk is skewed toward disappointment.
CPI surprise asymmetry matters here: when hike odds already sit near 70-80%, a hot print has limited upside for the dollar, while a soft print can force a much larger repricing.
Without consensus forecasts or prior readings, the useful question is the direction of the surprise, not the specific number.
| Day | Release | What it tests |
|---|---|---|
| Wednesday 14 October | US CPI | Whether consumer inflation is persistent enough to justify the December hike pricing |
| Thursday 15 October | US PPI | Whether price pressure is building earlier in the supply chain |
| Thursday 15 October | US Retail Sales | Whether consumer demand is strong enough to absorb tighter policy |
Of the three, CPI carries the most weight. It lands first and sets the frame through which Thursday’s numbers will be read. On Monday, the dollar was weakest against the British Pound.
When big ASX news breaks, our subscribers know first
How Fed policy moves the US dollar index
To read this week’s releases properly, you need the chain that links a Fed decision to the dollar’s price. The DXY measures the dollar against a basket of major currencies, so anything that changes global demand for dollars shows up in it.
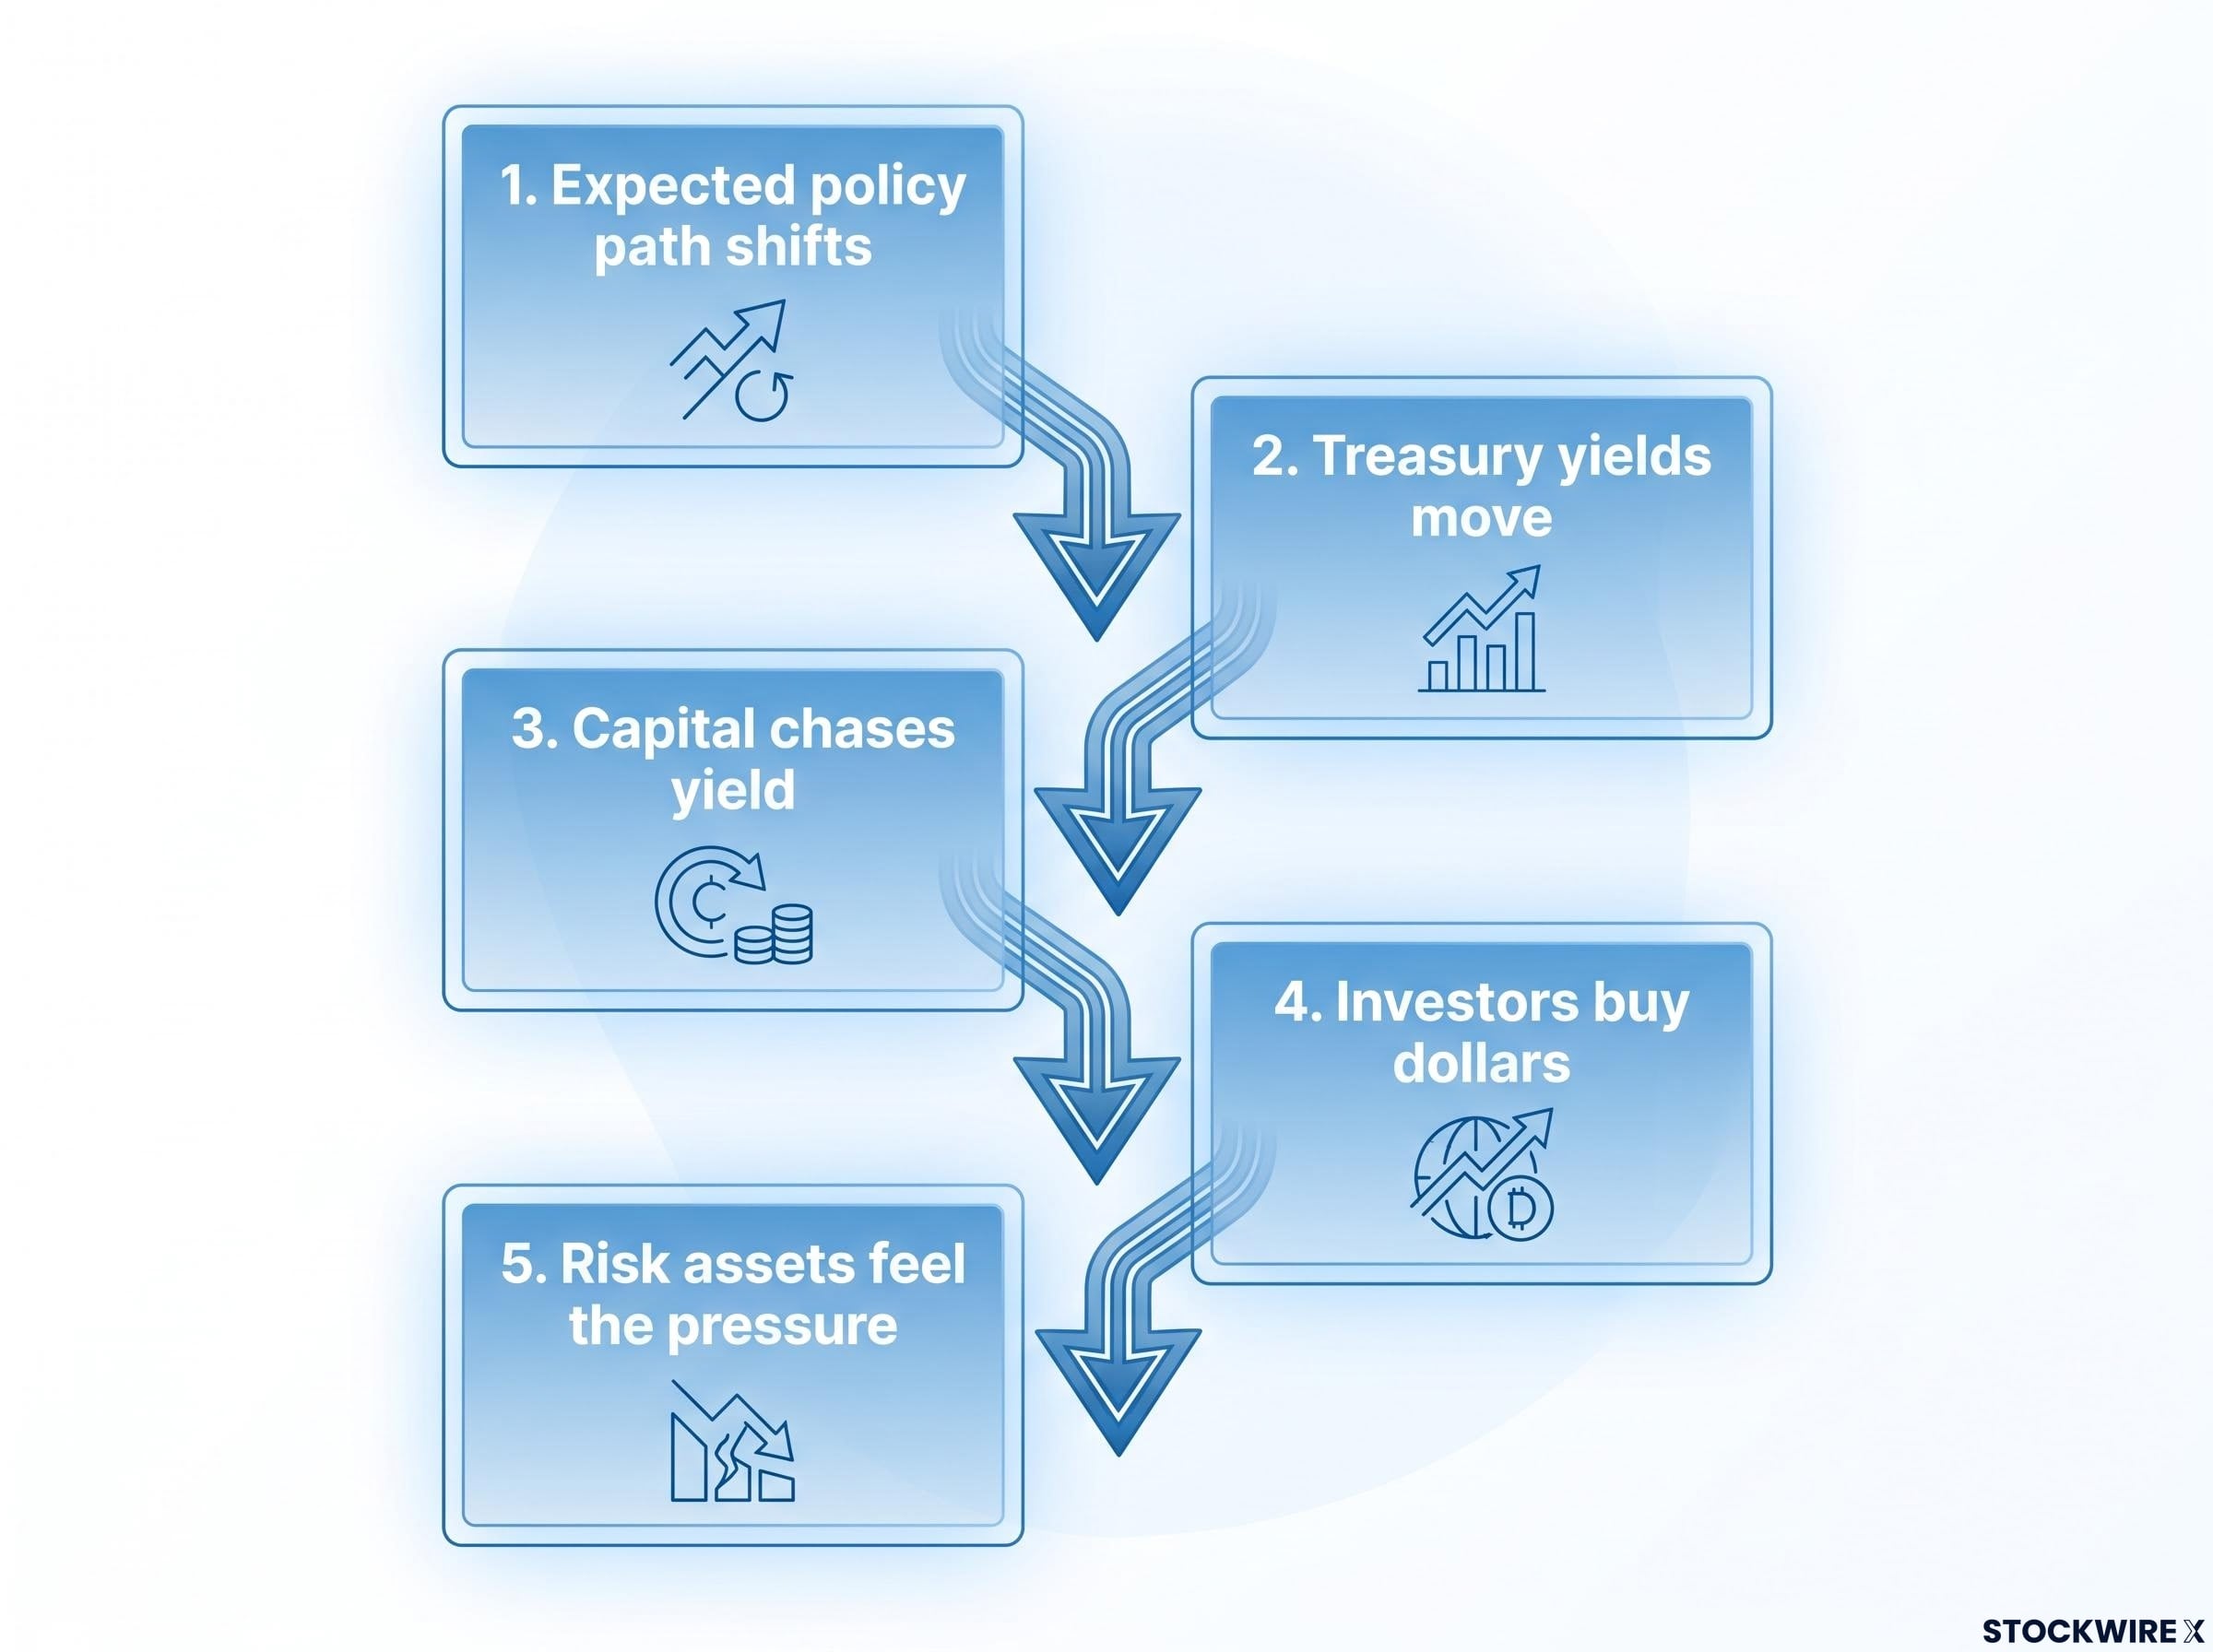
The transmission chain
- The expected policy path shifts. Data changes what traders think the Fed will do, and futures, swaps and short-dated Treasury bills reprice almost immediately.
- Treasury yields move. Higher expected policy rates lift yields across maturities.
- Capital chases yield. Under uncovered interest-rate parity, the theory that money flows toward the currency offering the higher return, foreign investors are drawn to US assets.
- Investors buy dollars. Purchasing Treasuries or US credit requires dollars first, and that buying pushes the currency up.
- Risk assets feel the pressure. Higher US yields can weigh on equities and on vulnerable currencies, reinforcing the dollar’s safe-haven role.
You can apply this chain to any release. Ask whether it shifts the expected policy path, and the rest follows.
Interest rate differentials, alongside growth exceptionalism and reserve demand, explain why the dollar tends to find buyers whenever expected US policy rates stay above those of other major central banks.
The Fed’s anchor is its dual mandate of price stability and full employment, with a 2% inflation target. Hike talk typically builds when inflation stays above target, the labour market stays tight, or financial conditions ease through equity rallies and narrow credit spreads. The main policy tools work as follows:
- Hikes usually support the dollar by lifting yields.
- Cuts usually weigh on it, as returns on dollar assets shrink.
- Quantitative easing (QE), the creation of money to buy bonds, usually weakens the dollar.
- Quantitative tightening (QT), which stops those purchases and reinvestment, usually supports it.
Structural versus cyclical drivers
Structural drivers shape the dollar over years. They include global reserve demand, the US fiscal position, productivity, and America’s standing in energy and technology. The dollar replaced the British Pound as the reserve currency after World War II and lost its gold backing when the Bretton Woods system ended in 1971. By 2022, it featured in more than 88% of global FX turnover, roughly $6.6 trillion a day.
Cyclical drivers move it week to week. These include inflation surprises, payrolls and shifts in rate expectations.
This week belongs to the cyclical side. Treat CPI, PPI and Retail Sales as the instruments that matter now. The structural factors explain why the dollar has a floor, not where it trades on Thursday afternoon.
Rate expectations or safe-haven demand: what is really driving the dollar?
Two explanations compete whenever the dollar moves during a crisis. Rate-driven strength comes from higher yields and expected tightening. Safe-haven strength comes from investors seeking shelter when something breaks, even if rate expectations have not moved at all.
This weekend’s headlines test both.
According to Saudi authorities cited by BBC News, a missile attack on King Khalid International Airport in Riyadh on 10 October killed at least 12 people and injured about 309. BBC described it as the deadliest attack in the kingdom since May 2015. NBC News, citing Saudi civil aviation authorities, put the toll at at least 13 killed and more than 300 injured. Yemen’s Houthis claimed responsibility. A second projectile struck the airport’s passenger terminals the following day, although market reports referenced a Sunday 11 October coalition statement, so the exact timing varies by source.
The Russia-Ukraine story is even less settled. On 11 October, President Donald Trump said both sides had agreed to an energy ceasefire, according to the Guardian, but he gave no details.
Volodymyr Zelenskyy, President of Ukraine, on the ceasefire claim The announcement “was news for me,” he said, according to Axios.
Zelenskyy said Kyiv would accept a mutual, guaranteed halt. Russian strikes on Ukrainian power infrastructure continued, as did Ukrainian attacks on Russian refineries, and Moscow offered no confirmation.
| Driver | Typical dollar effect | Current evidence | Reliability |
|---|---|---|---|
| Rate expectations | Higher expected rates support the dollar | 84.1% December hike priced; data run pending | Higher: tied to scheduled, measurable releases |
| Safe-haven demand | Shocks draw defensive dollar buying | Riyadh attack; unconfirmed energy ceasefire | Lower: contested tolls and unverified claims |
History shows that shocks can lift the dollar. The 2022 energy disruption favoured the dollar and weakened EUR/USD as Europe absorbed the blow. Contested headlines are different, though, because flows built on unconfirmed claims tend to reverse as quickly as they arrive.
The dollar is softening despite this weekend’s shocks. Read that as evidence that safe-haven demand is not in control. Rate expectations remain the primary driver.
What the dollar’s next move means for EUR/USD, GBP/USD, USD/JPY and gold
On Monday’s European session, the majors and gold traded in narrow ranges. EUR/USD held above 1.1200 ahead of an Italian budget carrying new defence and energy allocations. GBP/USD firmed near 1.3250, with Bank of England policymakers Sarah Breeden and Catherine Mann due to speak. USD/JPY edged up below 158.50 in thin trade during a Japanese holiday, and gold slipped to around $4,185.
Those quiet ranges are unlikely to survive the data. Historical precedents suggest how each could break.
| Instrument | Monday level | Hot data effect | Soft data effect | Key risk |
|---|---|---|---|---|
| EUR/USD | Above 1.1200 | Pressure lower as Fed-ECB gap widens | Room to rise | Italian budget and energy headlines |
| GBP/USD | Near 1.3250 | Likely pullback | Extension of gains | Tone of BoE speakers |
| USD/JPY | Below 158.50 | Pushes toward intervention territory | Likely retreat | Japanese official intervention |
| Gold | Around $4,185 | Pressure from higher real yields | Support from lower yields | Hedge demand versus opportunity cost |
A hot CPI is most likely to pressure EUR/USD and gold while pushing USD/JPY higher. A soft print reverses each move.
USD/JPY deserves particular caution. Japan’s Ministry of Finance and the Bank of Japan have a record of stepping in when yen weakness turns disorderly, which can squeeze long-dollar positions abruptly. No intervention dates are confirmed, but the risk runs both ways.
Gold faces its own tension. It tends to rise with inflation and geopolitical risk, yet higher real yields raise the cost of holding a metal that pays no income. Bloomberg data shows gold-backed ETF inflows at a four-year high, a sign investment demand may cushion any dip.
The relationship between real yields and gold explains why hot inflation can hurt the metal rather than help it, since higher yields raise the opportunity cost of holding an asset that pays no income.
The tail scenarios sit outside the main map:
- Policy error: overtightening into a slowing economy could drag long-dated yields lower and cap dollar strength.
- Emerging-market spillover: a firmer dollar raises debt burdens abroad, and extreme stress could prompt coordinated responses that weaken it.
Past performance does not guarantee future results. These scenarios are speculative and subject to change as market conditions develop.
What to watch once the data run ends
The dollar index sits balanced between a December hike the market has largely priced and a data run that can either confirm or challenge it. Geopolitics is adding noise more than direction.
DXY technical levels, including clustered short-term and 50-day moving averages, shape how far any data-driven rally can run before meeting resistance.
Three signals matter most from here:
- The CPI reaction measured against 84.1%. A muted rally on a hot print confirms the pricing is full, while a sharp drop on a soft print shows how crowded the trade had become.
- Whether Riyadh or the ceasefire story shifts safe-haven flows. Watch for confirmation from Moscow or further strikes.
- Any yen intervention signals from Tokyo as USD/JPY approaches recent highs.
The research offers no consensus figures, so compare each release against forecasts you have sourced yourself before drawing conclusions.
This article is for informational purposes only and should not be considered financial advice. Investors should conduct their own research and consult with financial professionals before making investment decisions.