
A fall from roughly $93 a barrel to $30-$35 works out to about 62%. That sounds like a fantasy figure, yet crude has fallen by that much or more four times in about 40 years. “Extreme” and “impossible” are not the same thing, and the gap between them is where this crude oil forecast needs to be judged.
As of mid-October 2026, West Texas Intermediate (WTI) sits near $90 and Brent near $100-$105. The Iran conflict is in its eighth month, and tanker attacks around the Strait of Hormuz are escalating. Against that backdrop, Cathie Wood and ARK Invest argue that a reopening could send oil toward $30-$35 over the next few years.
If you carry fuel costs, energy exposure or inflation worries, you need a way to weigh a call like this rather than accept or dismiss it on instinct.
Two tests do most of the work: historical precedent and options pricing. Together they give you a method you can reuse on the next dramatic price call you encounter.
What exactly is Cathie Wood predicting, and what has to happen first?
ARK’s view arrived in stages. On 23 September 2026, Benzinga and TradingView quoted the firm tying a sharp fall to a Hormuz reopening. On 25 September, coverage of Wood’s investor letter described war-time volumes flooding the market once the Strait fully reopens, creating a glut. On 5 October, ARK’s official X post repeated the $30 to $35 range “during the next few years.”
ARK Invest “During the next few years, we would not be surprised to see the oil price drop back toward ~$30-35 per barrel.”
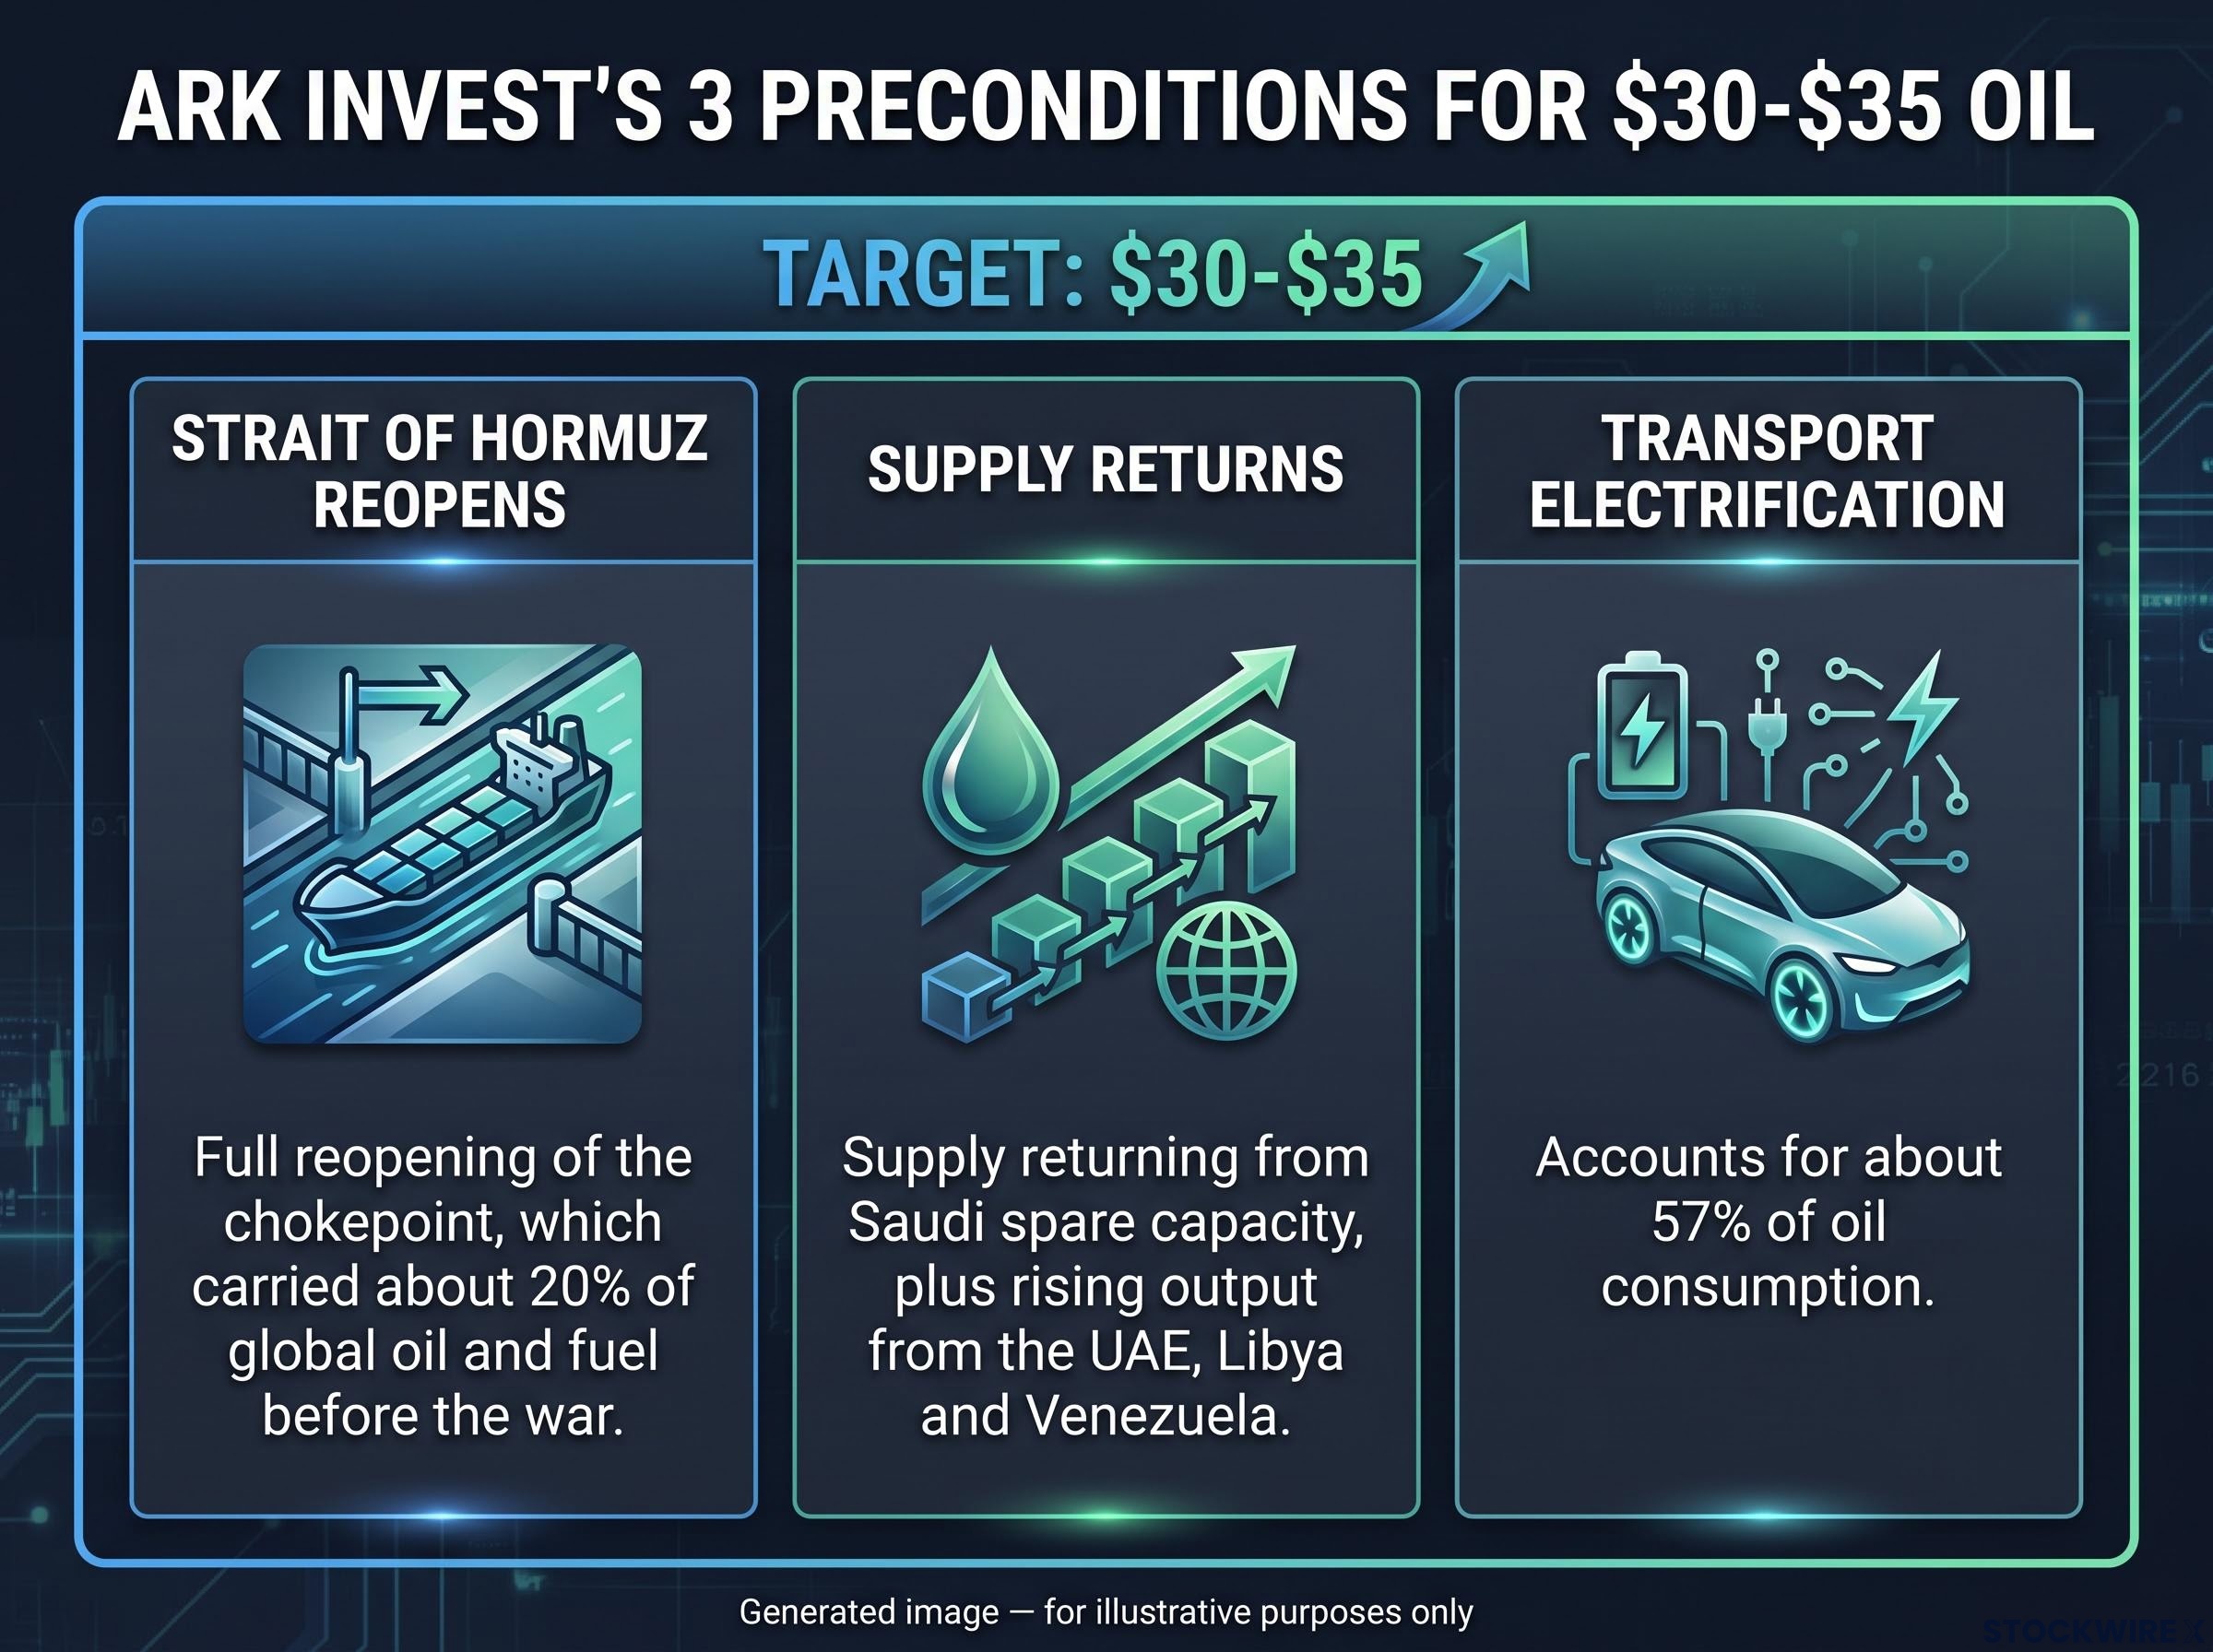
The forecast rests on three stated preconditions:
- A full reopening of the Strait of Hormuz, which carried about 20% of global oil and fuel before the war
- Supply returning from Saudi spare capacity, plus rising output from the UAE, Libya and Venezuela
- Electrification of transport, which ARK-linked commentary says accounts for about 57% of oil consumption
Wood goes further than a crisis dip. Yahoo Finance reported her arguing that $30-$35 could be structurally sustainable. The bet is that the geopolitical premium disappears and a glut follows.
On 10 October, WTI settled at $91.67 and Brent at $104.53. Wood’s apparent template is 1986, when prices fell from about $23 to $9, or roughly $87 to $35 adjusted for inflation. Note that the ARK figures above come via secondary-source reports.
This is a conditional, multi-year scenario. Measuring it against today’s price alone is the wrong test, which is why you need history and options working together.
When big ASX news breaks, our subscribers know first
Has oil really fallen this far before? Four crashes in 40 years
Start with the instinct that a 62% fall is absurd. The record says otherwise.
| Episode | Cause | Approximate decline | Price levels |
|---|---|---|---|
| 1986 | OPEC policy shift, Saudi output increase | About 60% over about four months | About $23 to $9 (later research: $27-$32 to $10-$16) |
| 2008 | Financial crisis demand collapse | Roughly 75-80% | About $147 to $32-$34 |
| 2014-2016 | US shale surge, OPEC declines to cut | About 75% or more | About $107-$115 to $26-$28 |
| 2020 | COVID-19 lockdowns | Briefly below zero | WTI futures at -$37 |
That works out to roughly one major crash per decade. The 1986 levels differ between sources, but both versions show a decline of around 60%.
Each episode matched or exceeded the drop Wood describes. Size, in other words, is not where her call is weakest.
The triggers matter more. Demand collapsed in 2008 and 2020, and 1986 was a deliberate policy decision. The 2014-2016 slump came from a structural glut built over years of shale investment. None was a war premium unwinding at a reopened chokepoint, which is the mechanism ARK proposes.
What this tells you is that a 62% drawdown belongs in your planning as a real tail scenario rather than science fiction. The open questions are whether a supply-shock unwind can produce it, and whether it can last.
What do crude options and the futures curve say about $30-$35?
History shows the move is possible. Options show how likely traders think it is over the coming months. Three tools do the work.
How to read a straddle breakeven
A straddle is the purchase of a call option and a put option at the same strike price and expiry. It pays off if the price moves far enough in either direction, so its cost shows how big a move the market expects.
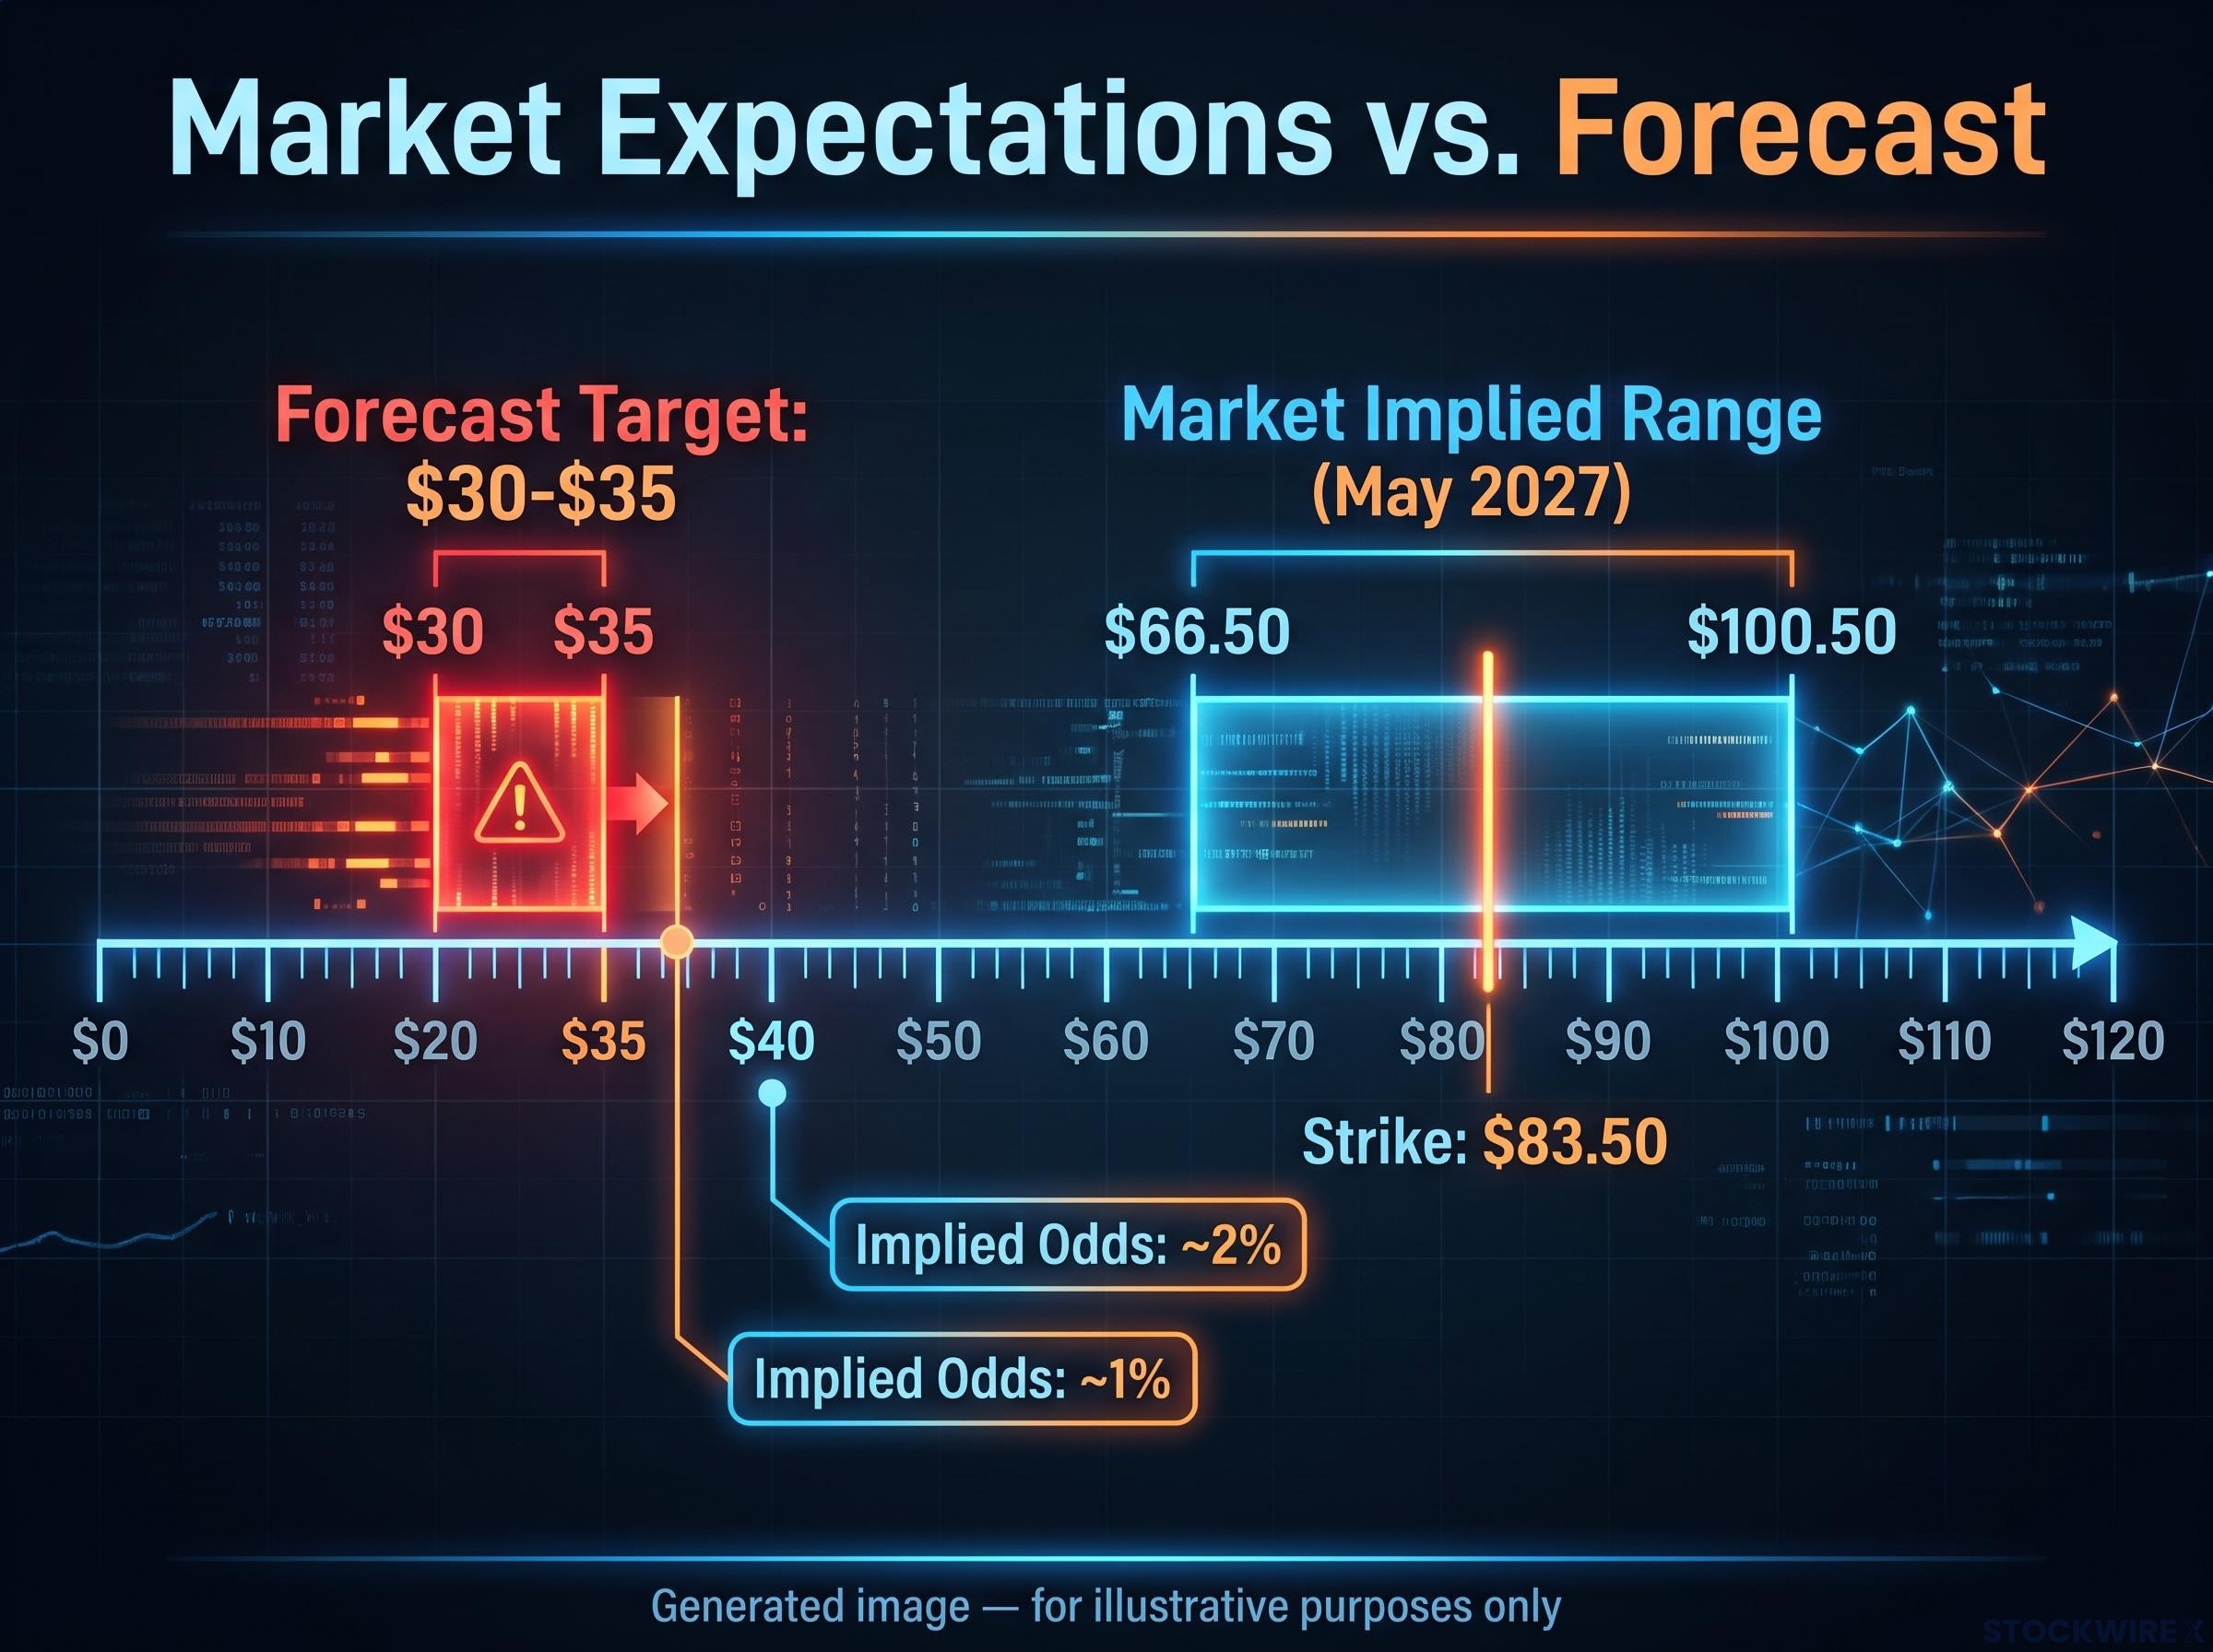
The May 2027 straddle at the 83.50 strike, about 221 days out and expiring 17 May 2027, costs roughly $17. Add and subtract that from the strike and you get breakevens of about $100.50 and $66.50. That range is the market’s implied band of movement, and $30-$35 sits well below it.
What a 0.02 delta means
Delta measures how much an option’s price changes when the underlying price moves by $1. Traders also use it as a rough proxy for the chance an option finishes in the money.
Market-implied odds A $40 put carries a delta of about 0.02, roughly a 2% chance of finishing in the money. A $35 put implies about 1%.
These are risk-neutral figures, meaning they include what traders will pay for protection, not a pure forecast of the odds.
What backwardation signals
Backwardation is a futures curve where near-term contracts cost more than later ones. Front-month WTI is about $91, roughly $1 above the second month, and the May contract trades near $83. WTI backwardation runs 8-14%, and Brent reaches 15-17%. Implied volatility on crude options was around 50% in late September, as measured by the OVX volatility index.
A steep curve means prompt supply is tight. The market is pricing the opposite of a glut.
A wide backwardation spread between spot and one-year forward contracts is the market’s own estimate of embedded fear premium, and it is the clearest sign that traders are pricing a squeeze, not a glut.
To test any forecast against options:
- Find the expiry closest to the forecast’s timeframe.
- Read the straddle breakevens to see the implied range.
- Check the put or call delta at the target strike.
As the source presenter put it, options cannot predict the future, but they show whether a claim is extreme given current information. One limit stands out: no listed contracts cover Wood’s multi-year window, so this tests the near term, not her actual claim.
Would a Hormuz reopening produce a lasting $30-$35 floor?
The intuitive story says reopening equals collapse. The mechanics are messier.
A reopening is a supply-shock unwind. It relaxes a bottleneck rather than destroying demand, unlike 2008 and 2020, and it is not a deliberate policy glut like 1986. Prices would likely fall as blocked barrels return and the war premium shrinks.
Stored war-time barrels could make that first drop sharp. Once those inventories are drawn down, however, prices tend to drift back toward marginal production costs.
The crude oil bear case more commonly points to a multi-year drift toward the roughly $55 US production-cost anchor, not a collapse to $30-$35, which shows how far ARK’s range sits from other bearish frameworks.
Three forces decide whether a dip becomes a floor:
- OPEC+ discipline: coordinated cuts can set a floor well above marginal cost, and holding $30-$35 would mean tolerating prices below many members’ fiscal break-evens
- US shale economics: full-cycle breakevens typically run $40-$60, with the best acreage lower but mostly above $30, so sustained low prices would trigger shut-ins
- Inventory release: a source of transient pressure rather than lasting oversupply
The official view sits far from ARK’s. The US Energy Information Administration’s (EIA) 6 October 2026 Short-Term Energy Outlook projects Brent averaging $105 in Q4 2026, though it is not explicitly conditional on a reopening. Published post-reopening forecasts from major banks or agencies, and quantified risk-premium estimates, could not be found, so the evidence base has a real gap.
Lessons from 1991 and 2022
After the 1991 Gulf War, prices fell as supply fears eased, showing how quickly a war premium can drain away. Oil then moved with macro and policy factors rather than settling at crash levels. In 2022, the Russia-Ukraine premium faded as alternative supply emerged, again without years of deep-crash pricing.
For your planning, a sharp fall after a reopening is a realistic scenario. A multi-year stay at $30-$35 would need a combination of conditions that history has rarely delivered.
How extreme is the call, and how far can you trust these tests?
The verdict is that the call is large in magnitude but not unprecedented. Its duration and cause make it an outlier against both history and current pricing. The EIA sees Brent at $105 for Q4 2026, and ARK sees $30-$35 within a few years.
Counter-arguments stack up. OPEC+ members need far higher prices to fund budgets. Shale investment would contract quickly and set up a rebound. Aviation, shipping and petrochemicals keep oil demand sticky while fleets turn over slowly. As the source presenter observed, the market appears to be pricing the opposite of Wood’s thesis.
The tools deserve the same scrutiny.
| Test | What it shows | Key limitation |
|---|---|---|
| Historical analogues | A 62% fall has happened four times | Past crashes had different causes |
| Straddle breakevens | Implied range of about $66.50-$100.50 to May 2027 | Long-dated liquidity is thin and model-dependent |
| Put deltas | About 1-2% odds near $35-$40 | Risk-neutral odds overweight bad outcomes |
| Backwardation | Tight prompt supply and a priced-in risk premium | Can flatten fast if geopolitics ease |
A 5% risk-neutral probability can correspond to a much lower real-world chance. Hedging flows from producers and consumers distort prices, and different assumptions about rates and jump risk change the tail odds materially.
Options can show whether the market is pricing an extreme move, but they cannot confirm or refute Wood’s forecast. Treat her figure as a scenario to stress-test in your plan, not a base case. Read the implied odds as a guide to sentiment rather than a probability you can bank on.
Past performance does not guarantee future results. Forecasts cited here are speculative and subject to change based on market developments.
Weighing a bold oil call: what the evidence supports, and what it does not
A 62% fall has precedent four times over. The cause, the multi-year persistence and the market’s current pricing all argue against a durable $30-$35 floor.
The variables to watch are Hormuz shipping incident counts, the slope of the backwardated curve, OPEC+ output decisions and the next EIA outlooks. Remember that today’s listed options cannot test the multi-year horizon.
Hormuz shipping incident counts matter because a declared reopening is not the same as normal traffic; war-risk insurance premiums running at roughly 30 times normal rates can keep commercial vessels away even when passage is technically possible.
Next time a dramatic forecast lands, run the same three checks: the historical base rate, the options-implied odds and the structural mechanics. Then use the scenario as a planning input, not a prediction.
This article is for informational purposes only and should not be considered financial advice. Investors should conduct their own research and consult with financial professionals before making investment decisions.