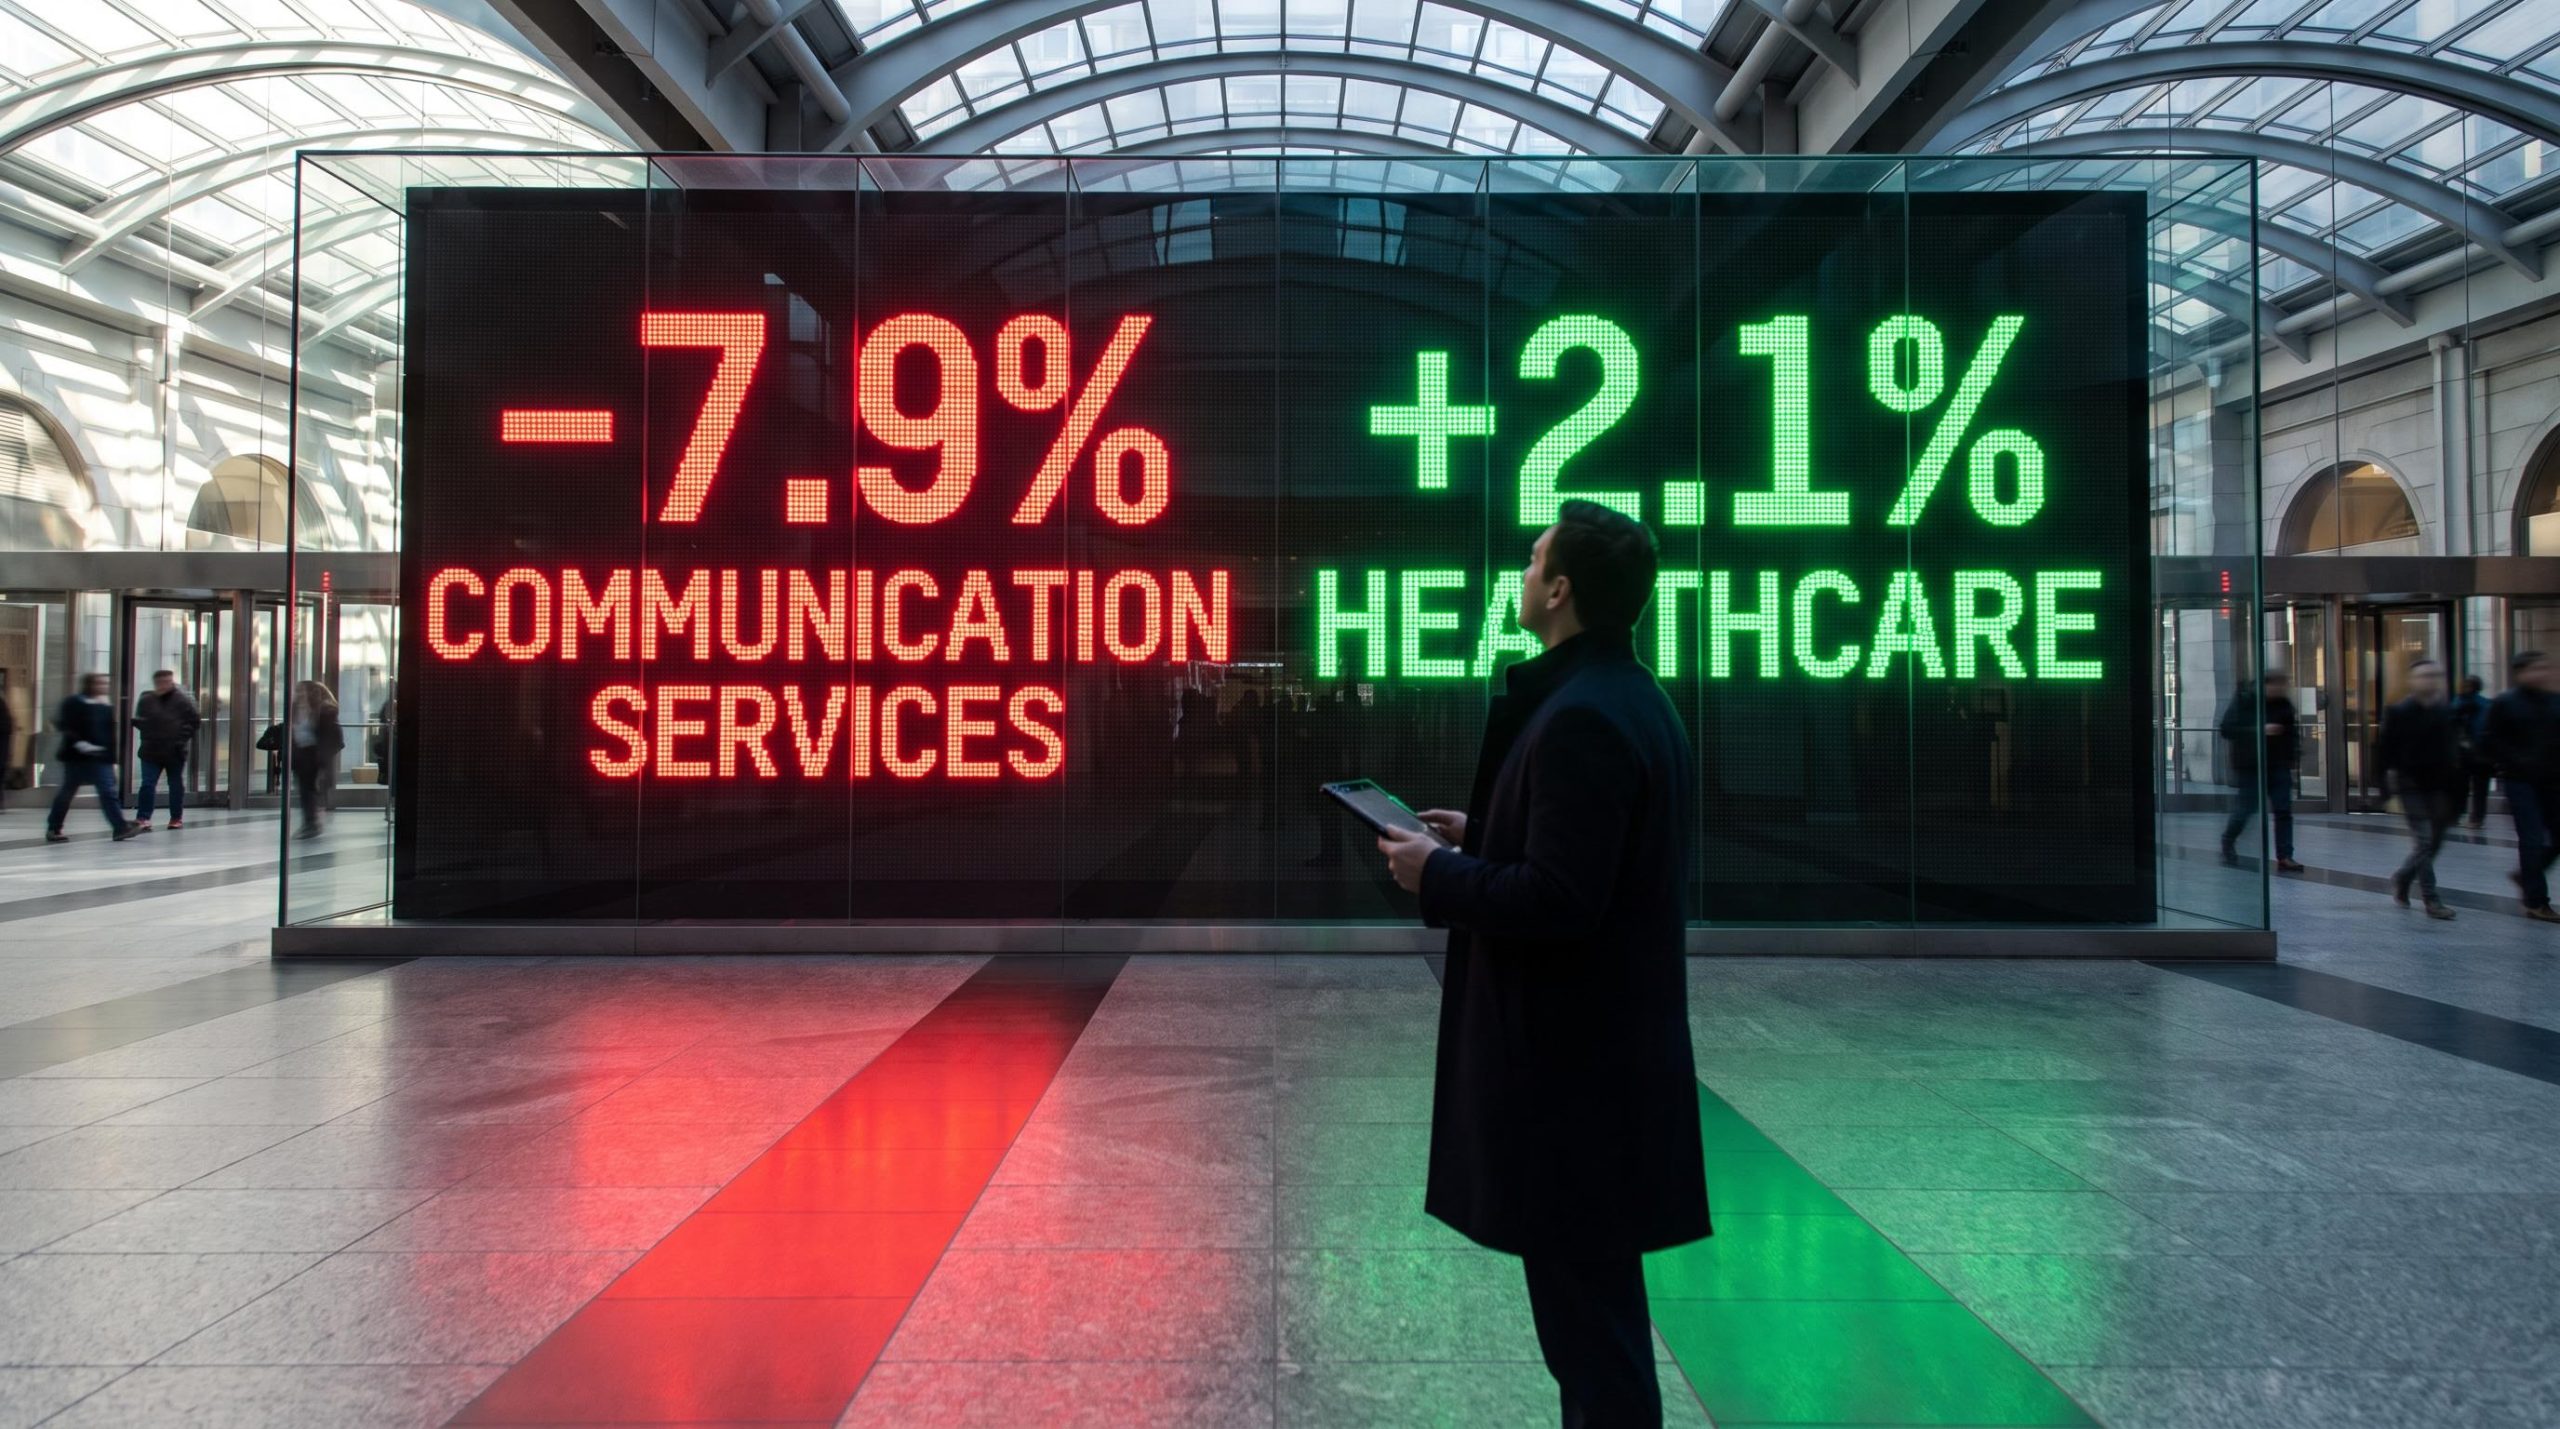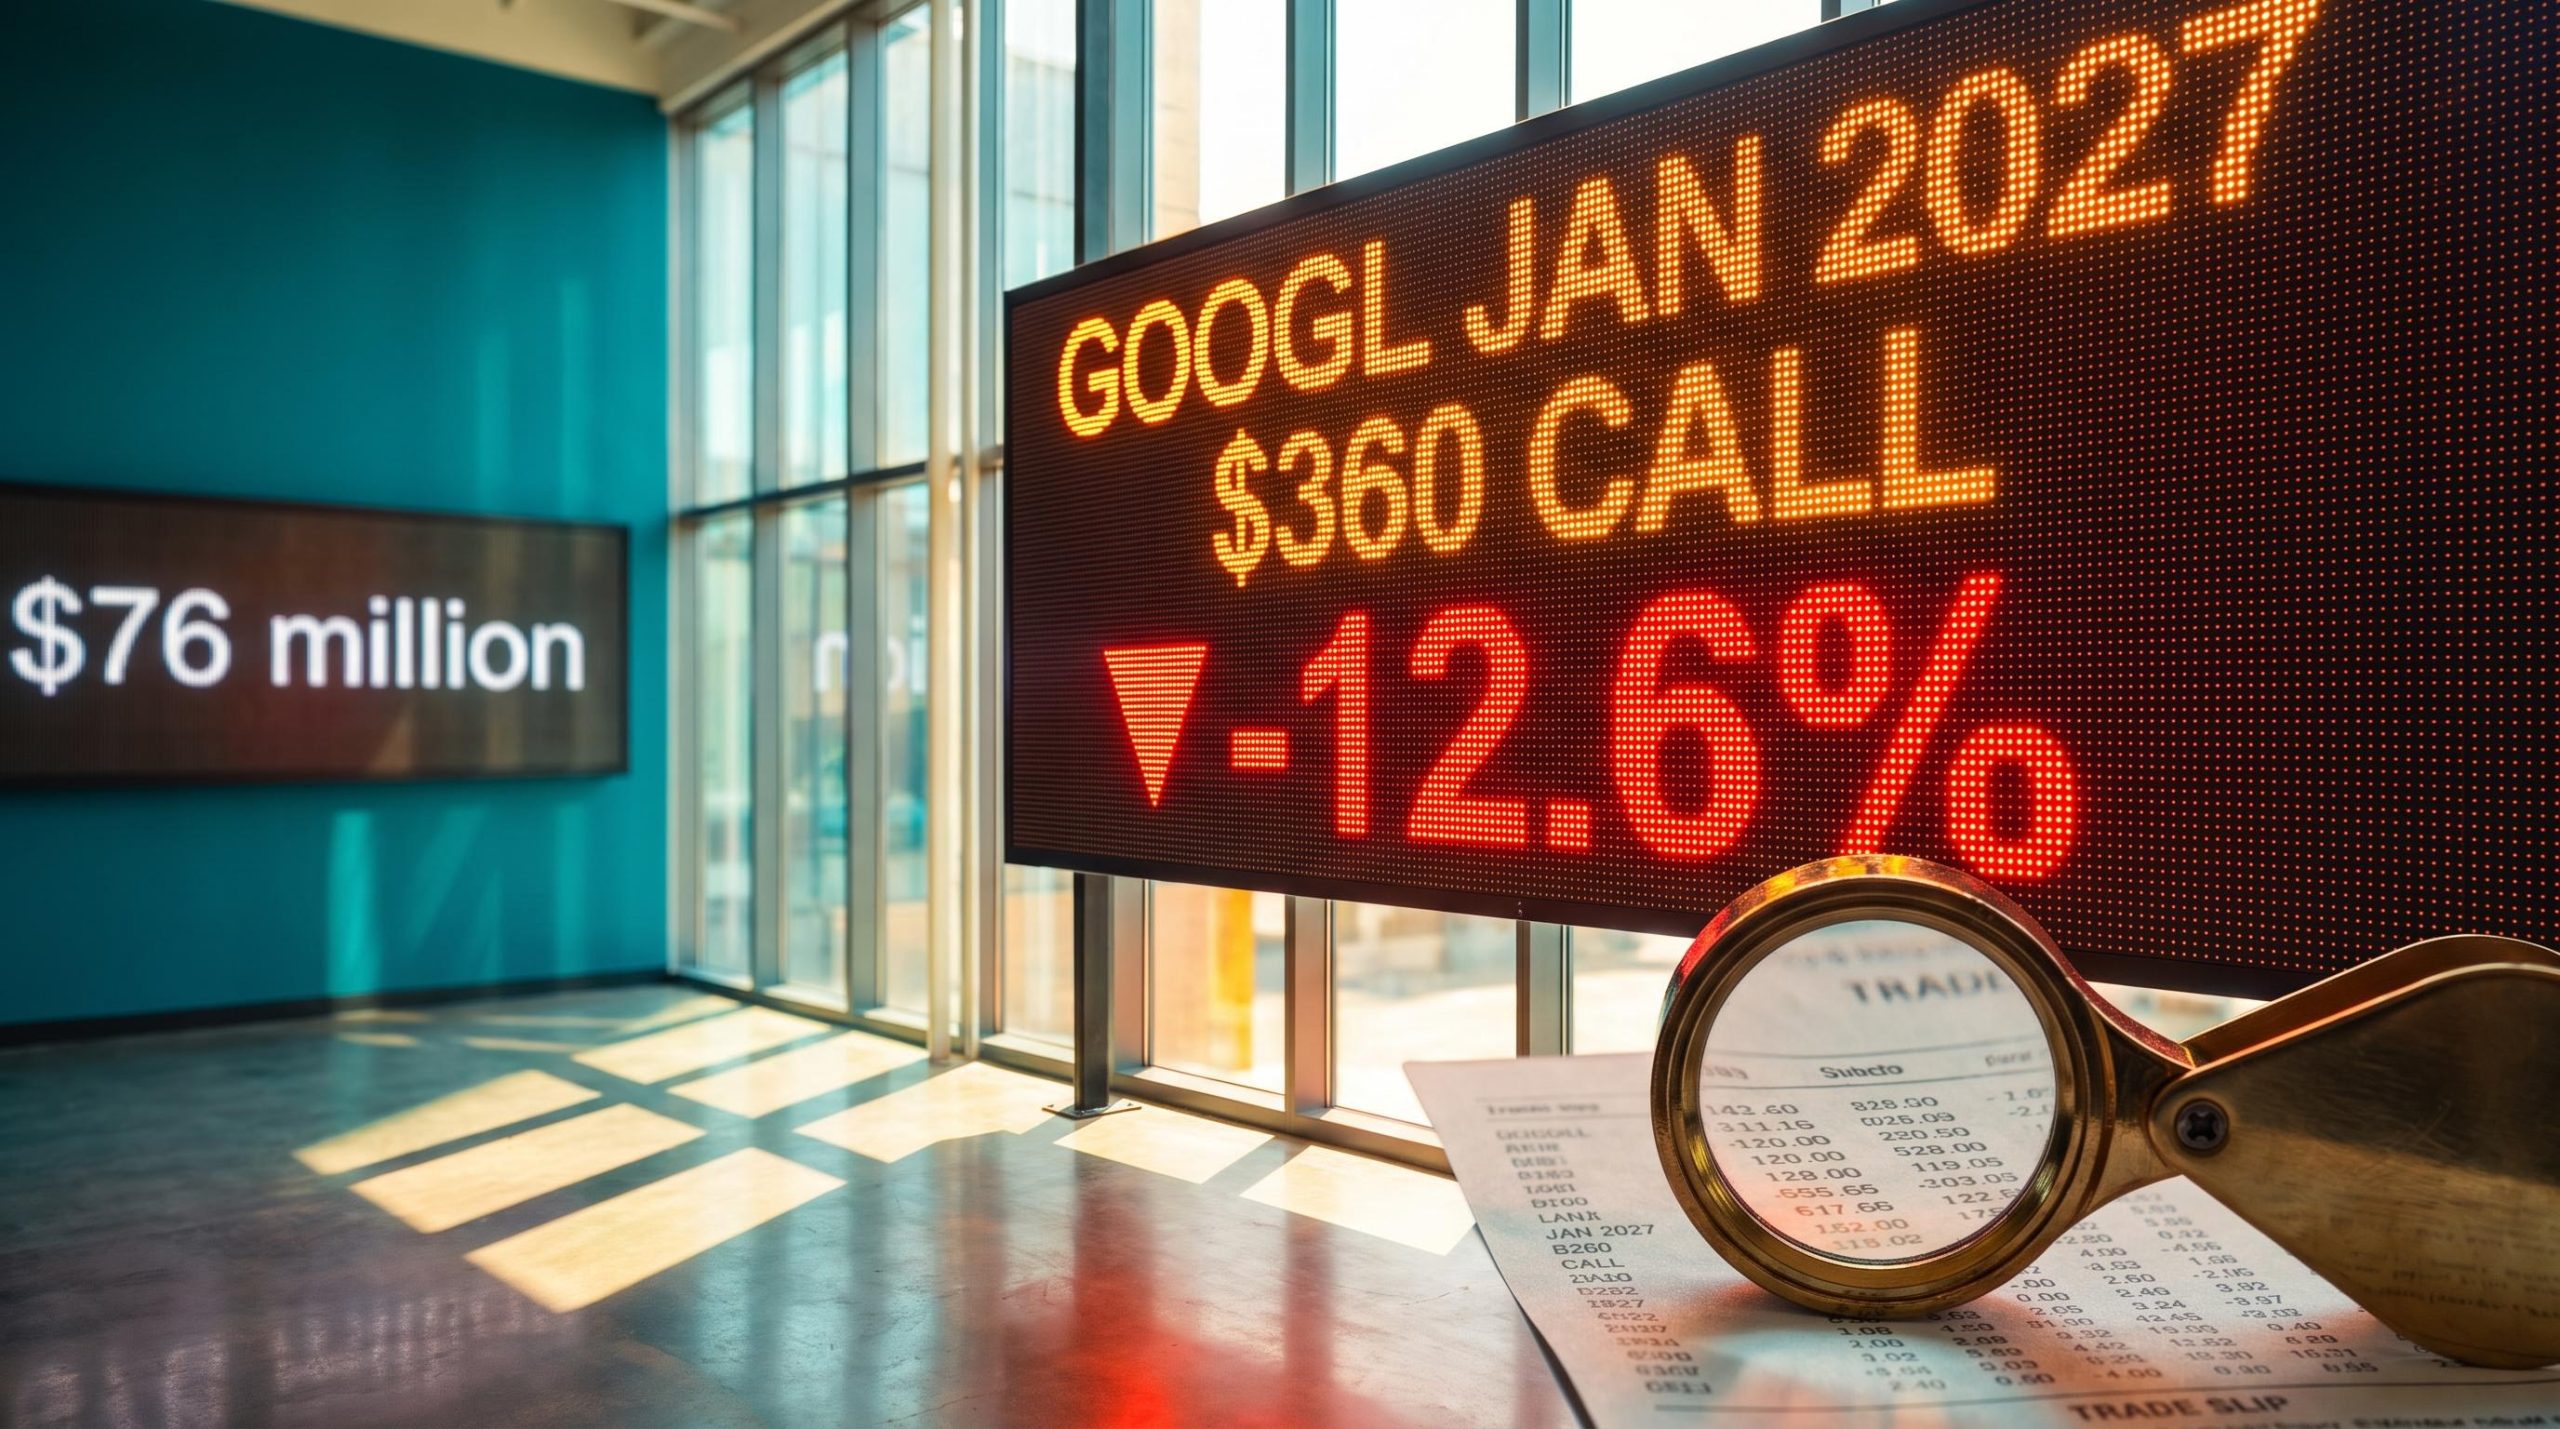
On Tuesday, someone paid a reported $41 million for Alphabet call options that only pay off if the stock climbs far higher. Two days later, Alphabet fell 12.6% after earnings. If big bullish flow meant someone knew something, that buyer picked a strange week to know it.
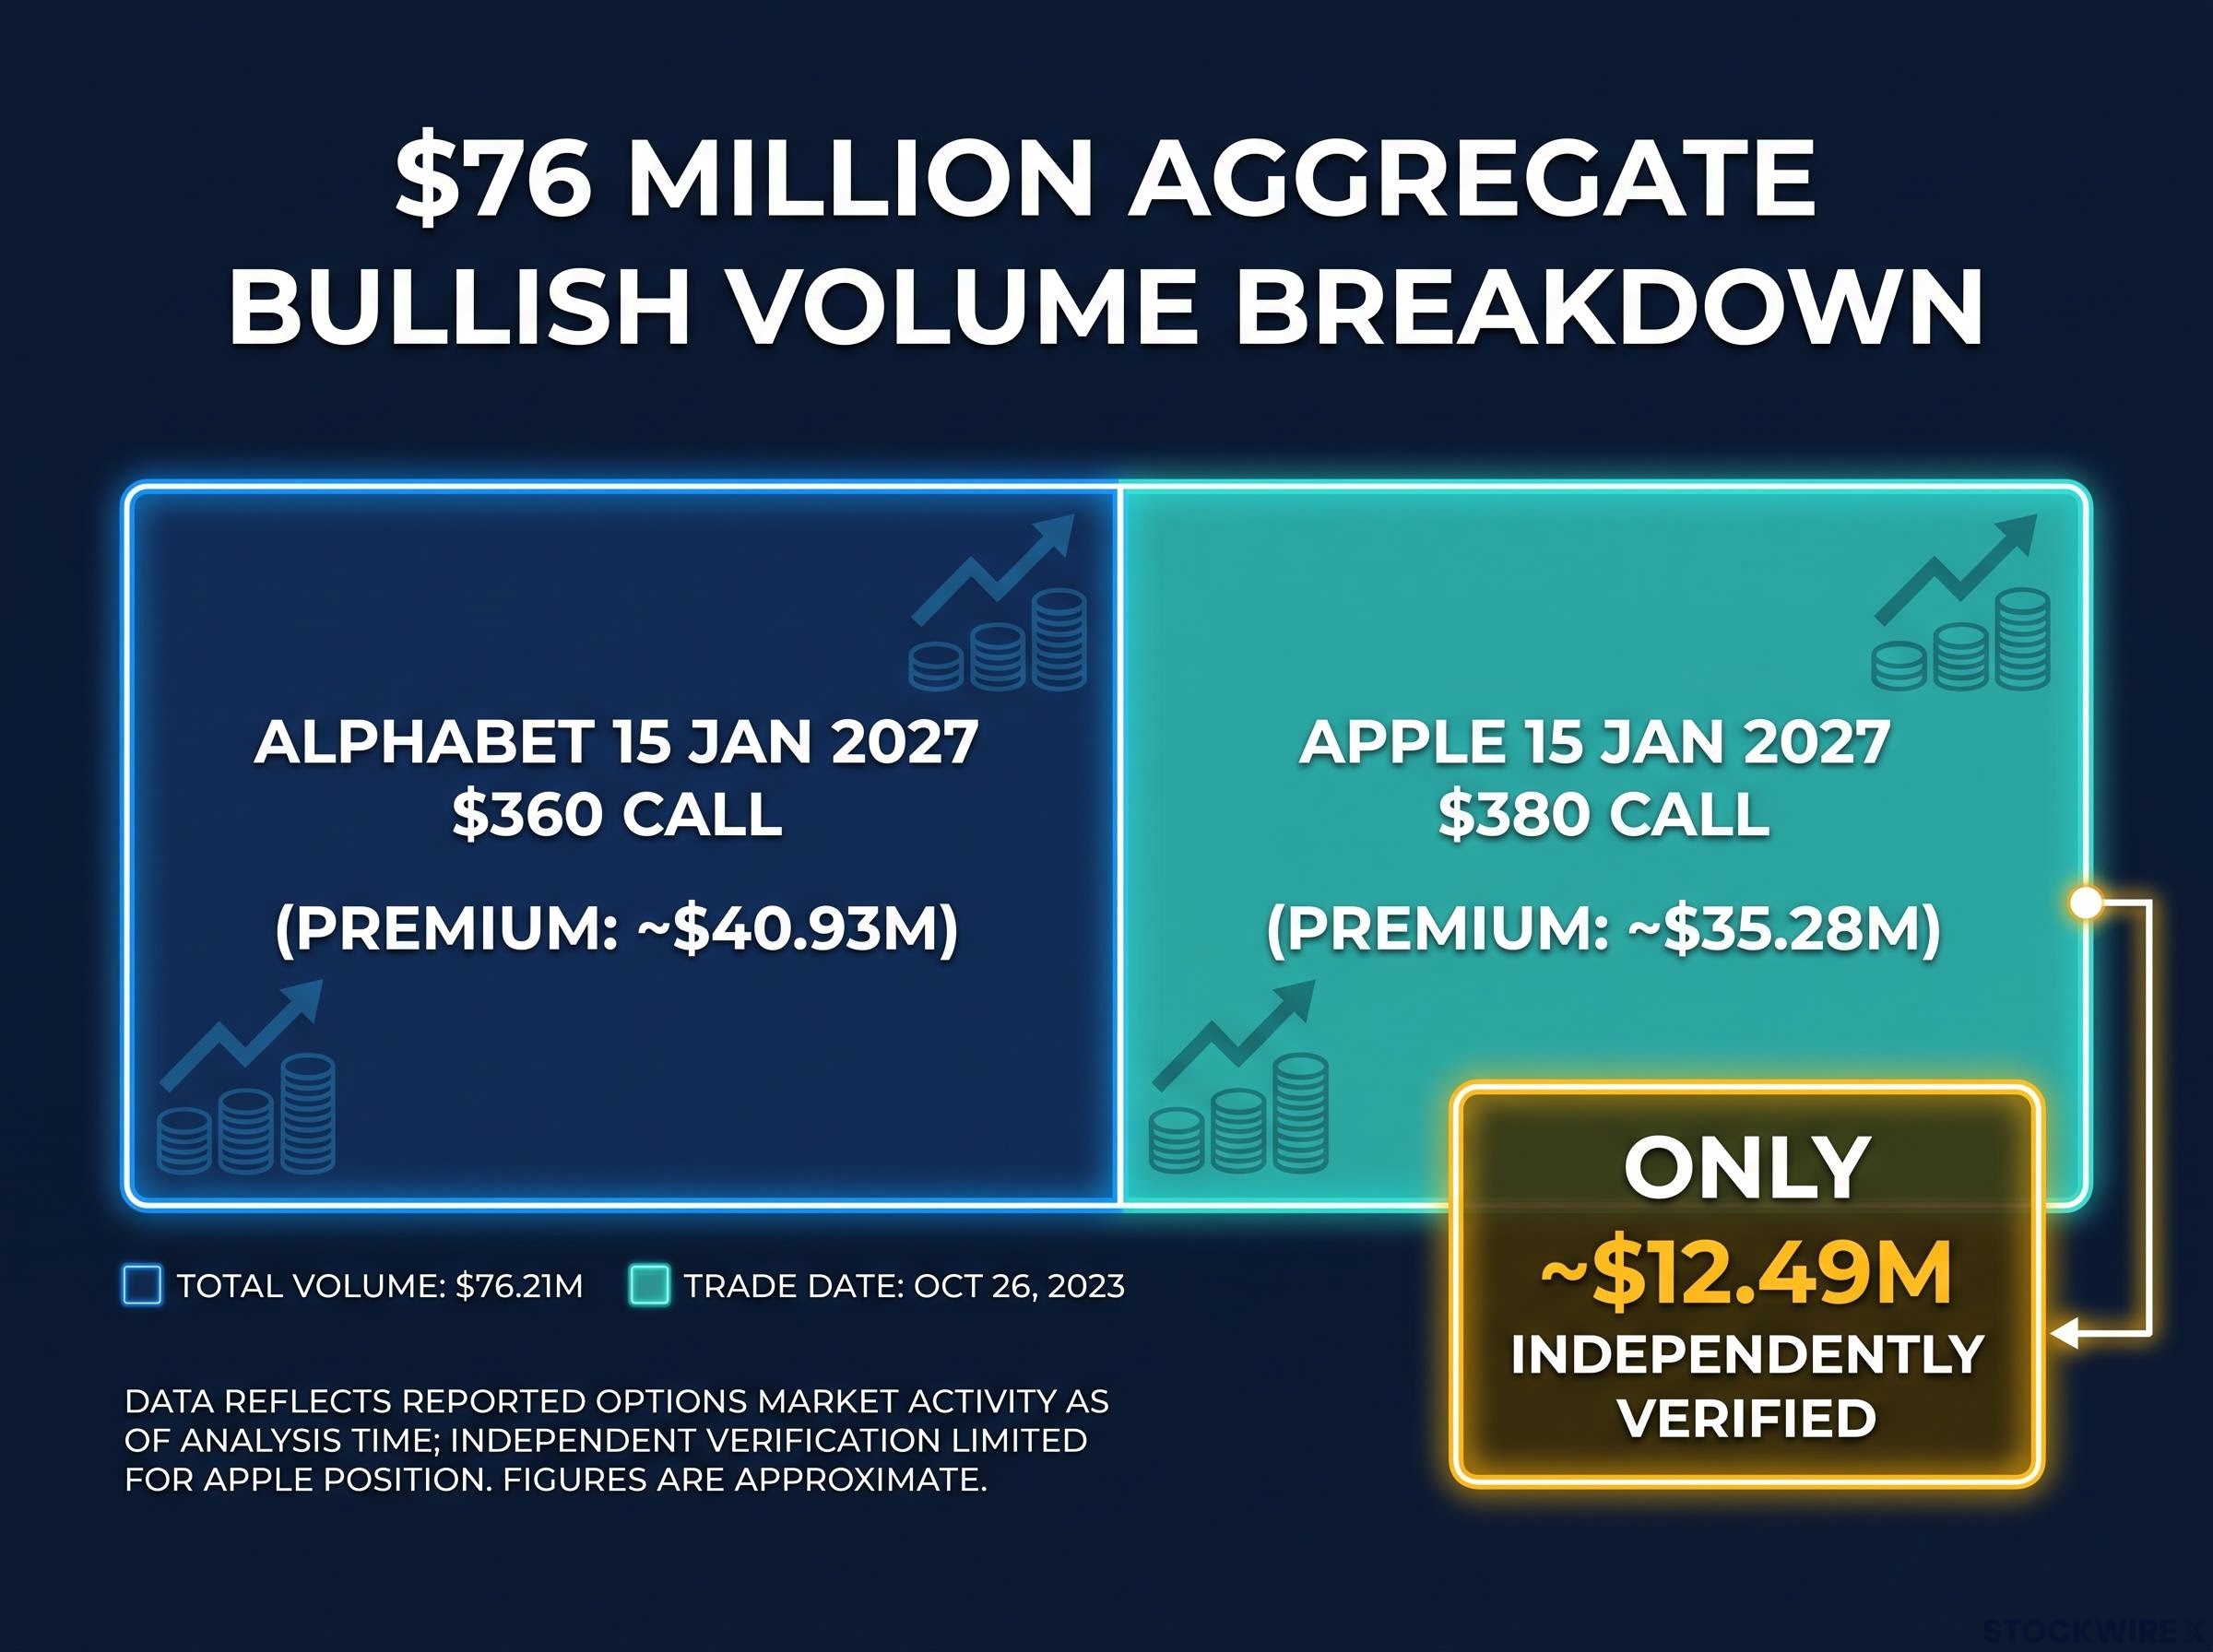
The trade was part of roughly $76 million in flagged bullish volume across Alphabet and Apple call options expiring 15 January 2027. That kind of unusual options activity has traders asking what the money signals, especially with Apple reporting on Monday, 2 November, its first quarter under CEO John Ternus.
The $76 million is aggregate flagged volume, not one giant trade. Of the Apple prints, only about $12.49 million could be independently verified.
This analysis gives you a method for judging flagged call flow. It also shows, using breakeven maths, how far each buyer needs the stock to travel to be right.
Why does $76 million in flagged call volume not equal one big bet?
A single dollar figure suggests a single conviction. It suggests one fund, one thesis and one cheque. The numbers behind the headline tell a looser story.
Tasty Live, which flagged the activity on its Signal Versus Noise segment, described the totals as aggregate bullish volume per contract. In other words, many trades were added together and labelled bullish.
| Contract | Premium | Volume vs. OI | Floor share | Breakeven |
|---|---|---|---|---|
| Alphabet 15 Jan 2027 $360 call | ~$40.93M | ~3.3x | 56% | ~$368.18 (~14.8% above stock) |
| Apple 15 Jan 2027 $380 call | ~$35.28M | ~4.4x | ~21% | ~$384.89 (~10.9% above stock) |
Open interest (OI) is the number of contracts still outstanding. A public options-chain snapshot of the Alphabet contract on 27 October showed 50,066 contracts of volume against 54,427 open interest, about 0.92x rather than 3.3x. The gap likely comes from different OI baselines or counting methods, and it remains unresolved.
That is not a scandal. It is the normal limit of vendor data.
The firmest evidence comes from two Apple prints reported by Bullflow: a 15,000-contract block for $7.5 million and a 10,109-contract sweep for about $4.99 million.
What could be verified Only about $12.49 million of the reported $76 million was independently visible in public sources.
The read for you is simple. A large flagged total shows where attention clustered. It does not show that one investor committed $76 million.
When big ASX news breaks, our subscribers know first
How to read unusual options activity without fooling yourself
The screen shows two things: big size and fills at the ask, meaning the buyer paid the seller’s asking price. Both look like urgency. The clearing system shows much less than either suggests.
The Options Industry Council stresses that open interest counts contracts not yet closed, exercised or assigned. It says nothing about sentiment. If both sides of a trade are opening, OI rises. If both are closing, it falls. If one opens and one closes, it stays flat, and the Options Clearing Corporation (OCC) only sets the final figure after clearing.
So volume above open interest does not prove that new bets were opened. It can reflect turnover, rolls or adjustments. Option Alpha warns that unusual activity does not necessarily predict direction.
Checking next-day open interest at the same strike is the cleanest way to tell whether heavy volume created new exposure or simply reshuffled existing positions, which is why a single-day volume spike rarely settles the question on its own.
A large call purchase could be any of these:
- a naked bullish call
- a call spread
- a covered call or overwrite
- a hedge against short stock or short calls
- a roll from another strike or expiry
- the closing of an existing short call
- one leg of a multi-leg institutional trade
Floor prints, sweeps and what they leave out
A floor or block print reveals size and venue. It hides strategy. A sweep, which is an order split across exchanges to fill fast, shows speed but not purpose. An ask-side fill does not prove a buy-to-open either, because a trader closing a short call can also pay near the ask.
Dealers add another layer. Market makers often hedge their delta, meaning their exposure to the share price, after customer trades. That hedging can create buying in the stock without anyone holding a confident forecast.
Alphabet is the live proof: apparently bullish flow, then a 12.6% drop. Before you treat any flagged print as a signal, run five questions:
- Is it a spread or an outright call?
- Is it opening or closing?
- Did it fill at the ask or near the midpoint?
- How does volume compare with prior open interest?
- Could it be a hedge rather than conviction?
Alphabet’s $360 calls: a cloud story meeting a search problem
The call buyer had a real argument. Alphabet closed at $322.50 before its report, about 21% below its May highs after roughly five months of going nowhere. A strong quarter could have broken it out.
Cloud delivered that quarter.
- Revenue: $127.58B, up 25%
- Search and other: $63.35B, up 12% (versus 17% the prior quarter), against roughly $64.85-65B expected
- Google Cloud: about $30.7B, up 103%
- Cloud operating income: $11.1B, versus $3.6B a year earlier
- GAAP diluted EPS: $2.12, weighed down by an other-income loss ($8.2B per Tasty Live, about $8.7B per market coverage)
Search was the problem. Chief Business Officer Philipp Schindler said strong growth in AI Mode queries hurt results because those queries monetise at lower rates than traditional search. The stock closed yesterday at $283.82, down 12.6%.
| Bull case | Bear case |
|---|---|
| AI Mode adds largely incremental query volume | AI answers displace valuable conventional searches |
| Monetisation lags usage and can improve as ad formats mature | Lower monetisation may be structural |
| Cloud and TPU demand create a second profit engine | Cloud is capital-heavy and may earn less than Search; reported capex above $200B is unverified |
Analysts split. Citizens analyst Andrew Boone downgraded to Market Perform, arguing Search remains the more valuable business. Mizuho‘s Lloyd Walmsley kept Outperform with a $460 target, and Morningstar lifted its fair value to $450.
What this tells you: the gap between roughly $284 and a $368.18 breakeven is now about 30%. A January 2027 holder needs the AI monetisation debate to resolve in their favour, not just more strong Cloud quarters.
Apple’s $380 calls: what Ternus’s first report has to deliver
Monday’s report is Tim Cook‘s last earnings call as CEO and Ternus’s first. It also covers the first weeks of iPhone 18 Pro sales. Consensus sits near $1.98-1.99 EPS on revenue of about $113.2-113.4B, up roughly 10.5%, against guidance of 9-11% growth and 47-48% gross margin.
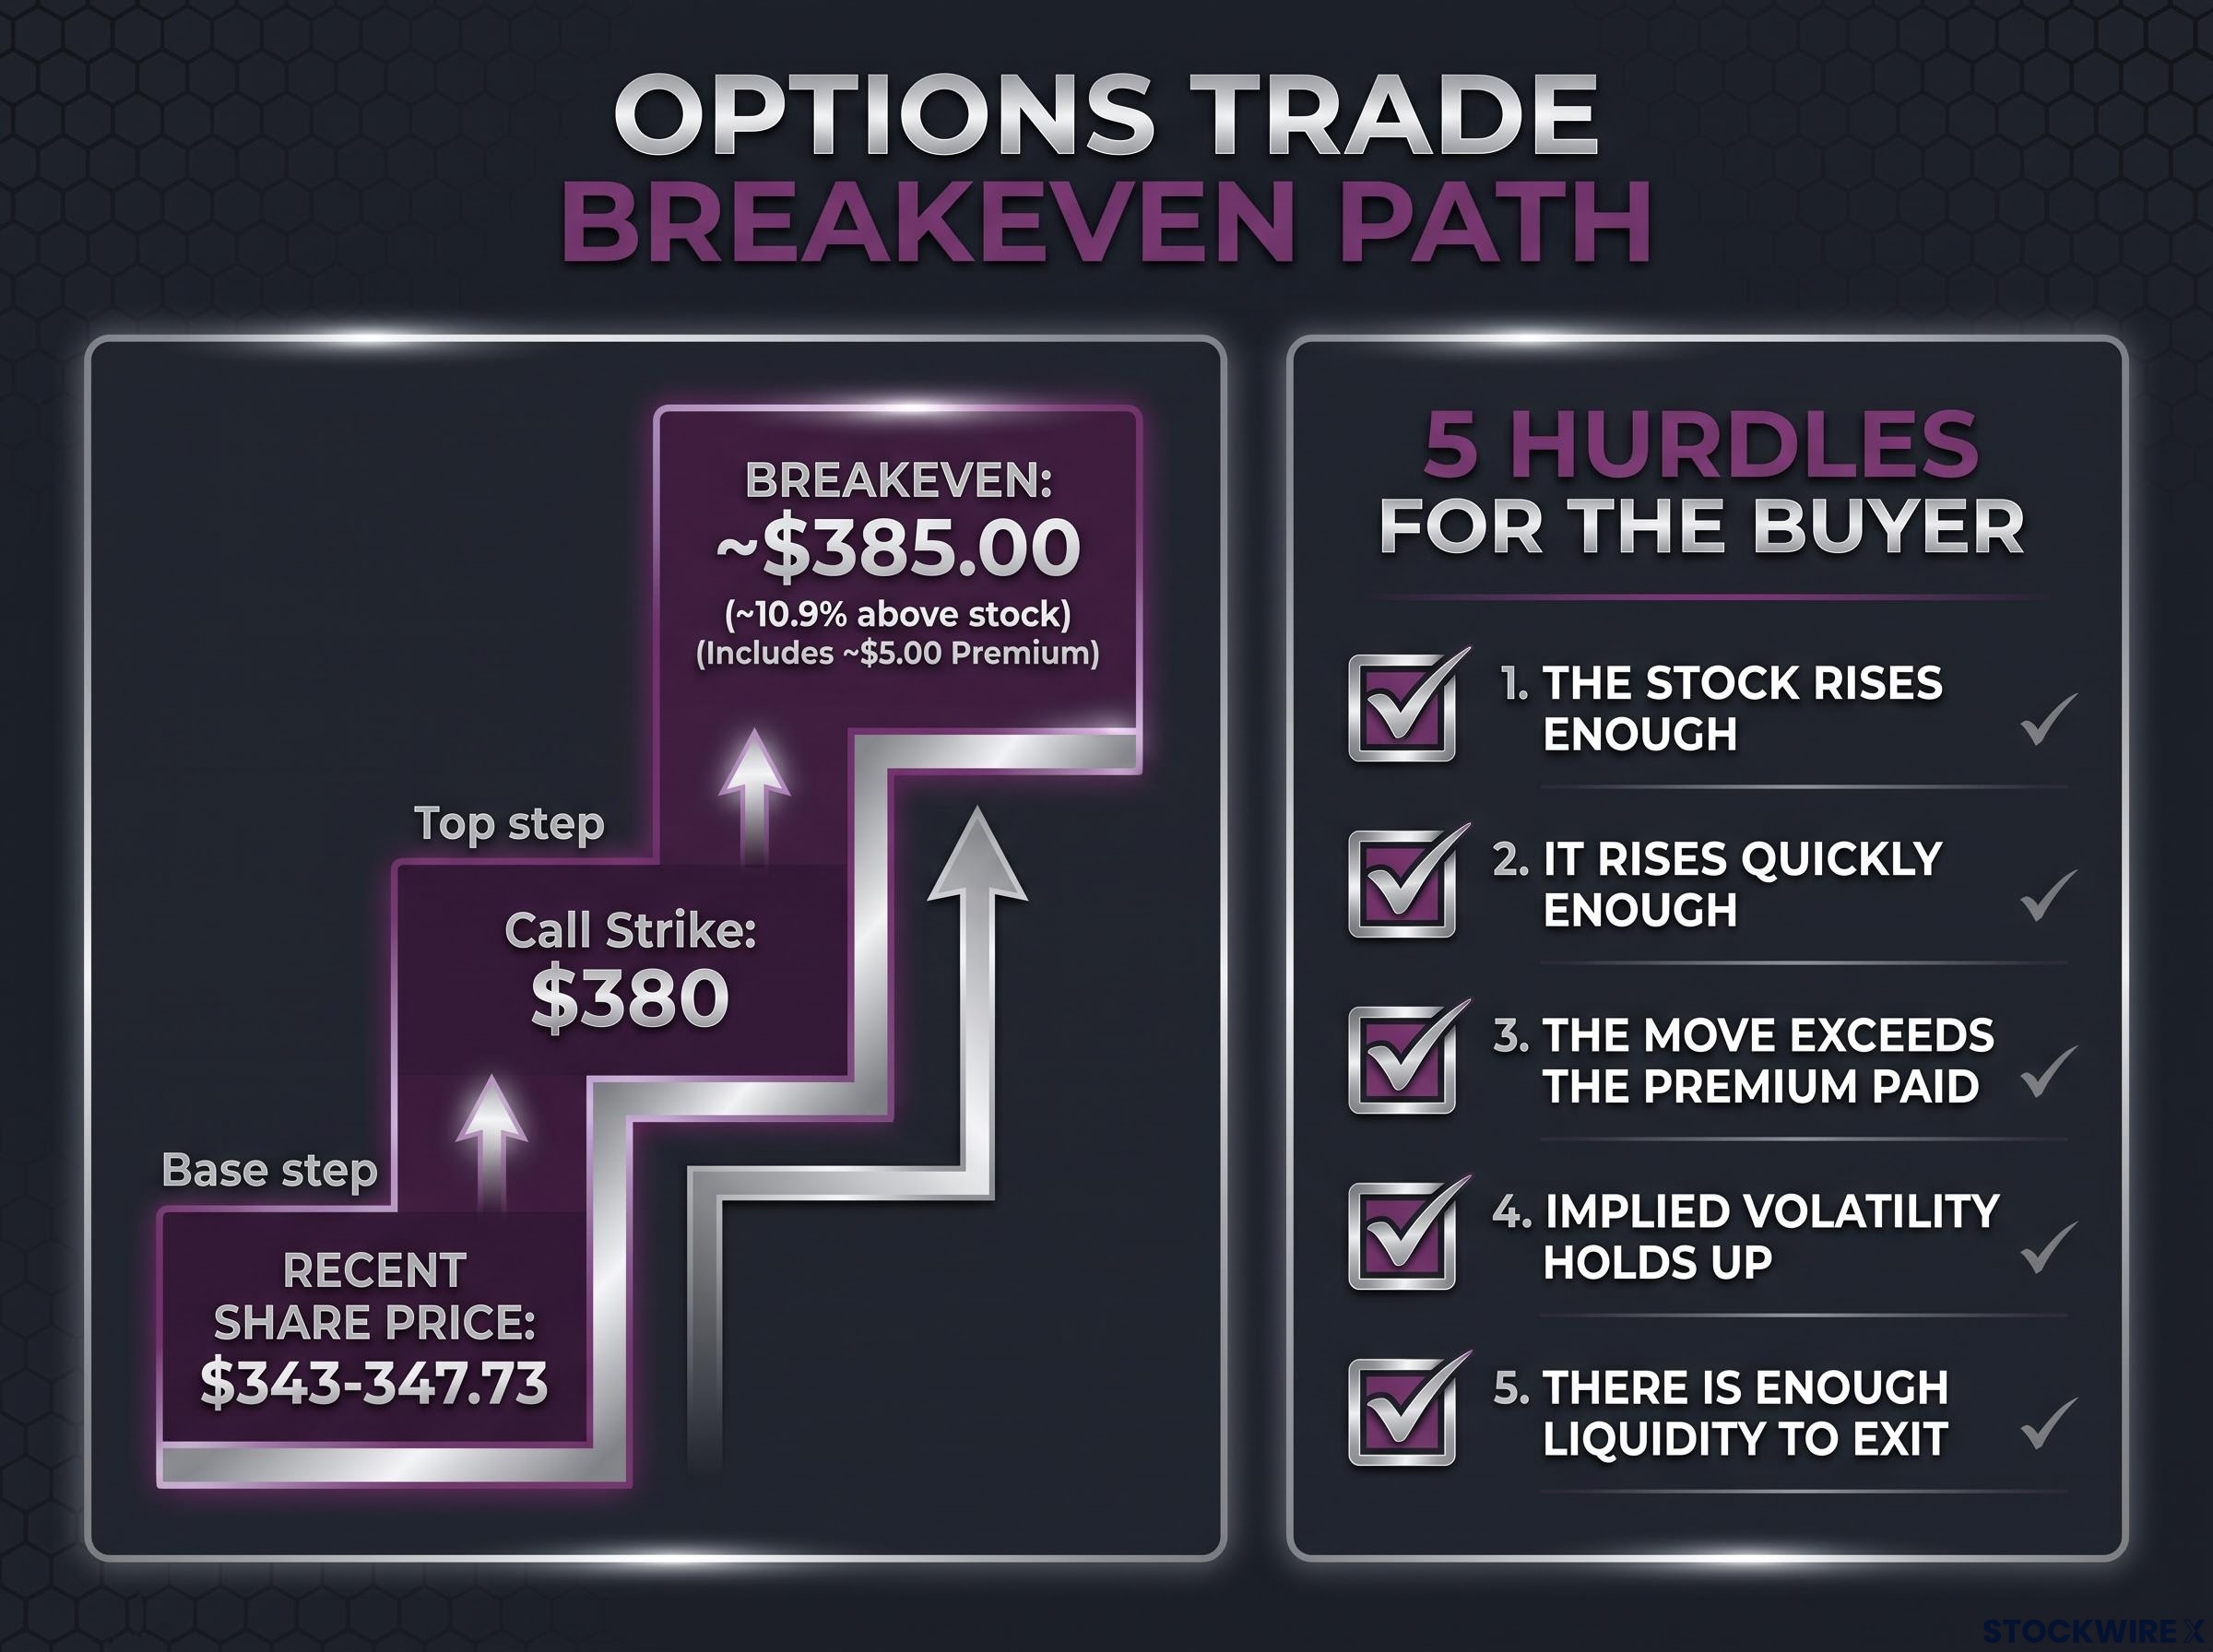
The stock already prices in a lot. Shares traded around $343-347.73 in recent coverage, near a record $351.73, at about 40x trailing and 36x forward earnings, with a market value near $5.1 trillion. The average analyst target of roughly $329-334.65 sits below the share price.
The $380 call buyer needs about 11% more. That sits at the optimistic edge of the Street, where Goldman Sachs recently raised its target to $390 from $360.
- Valuation: a premium multiple leaves little room for weak margins or cautious guidance.
- AI spending: lighter capex protects margins, but may signal a slower AI product.
- iPhone 18 cycle: Goldman expects it to drive growth, though it may already be priced in.
- CEO transition: Ternus is an experienced hardware leader, but untested publicly as CEO.
Breakeven at expiry = strike + premium per share $380 + $5.00 = $385.00. $380 + ~$4.94 = ~$384.94.
Even then, the buyer must clear five hurdles:
- The stock rises enough.
- It rises quickly enough.
- The move exceeds the premium paid.
- Implied volatility holds up.
- There is enough liquidity to exit.
The risks that outlast the headline
Implied volatility (IV) is the market’s estimate of future price swings, built into an option’s price. Cboe and the OIC note that IV usually rises before earnings and often falls sharply afterward. That drop, called IV crush, can erase gains even when the stock moves the right way.
Implied volatility usually rises into a report, and the implied move it prices in is a cost of entry rather than a forecast; a buyer can be right on direction and still lose if the realised move falls short.
Theta, the daily loss of time value, adds a slower drag. A January 2027 call decays more gently than a weekly option, but it still has to overcome its full premium.
Probability of finishing in the money differs from probability of profit. Apple could close at $383 in January, above the strike, and the call would still lose. A beat alone may not be enough.
What flagged call flow can and cannot tell you before the next print
Three lessons carry forward. Aggregate flow is not a single bet. The intent behind any print is rarely visible from the tape. Breakeven maths matters more than the size of the premium.
Alphabet showed how a sound thesis can still lose when the market focuses on a different variable. Apple’s report on Monday is the next live test of the framework, with the $380 buyer needing both a strong quarter and a volatility drop that does not swallow the gain.
Comparing the cost of front-month straddles with a stock’s historical earnings moves gives a quick read on whether the market is over- or under-pricing event risk before a mega-cap report such as Apple’s on Monday.
Before you read a signal into any flagged trade, check three things: the structure, the open interest and the breakeven. Figures reflect data available around 30 October 2026, and this is analysis, not investment advice.
This article is for informational purposes only and should not be considered financial advice. Investors should conduct their own research and consult with financial professionals before making investment decisions. Past performance does not guarantee future results. Financial projections are subject to market conditions and various risk factors.