
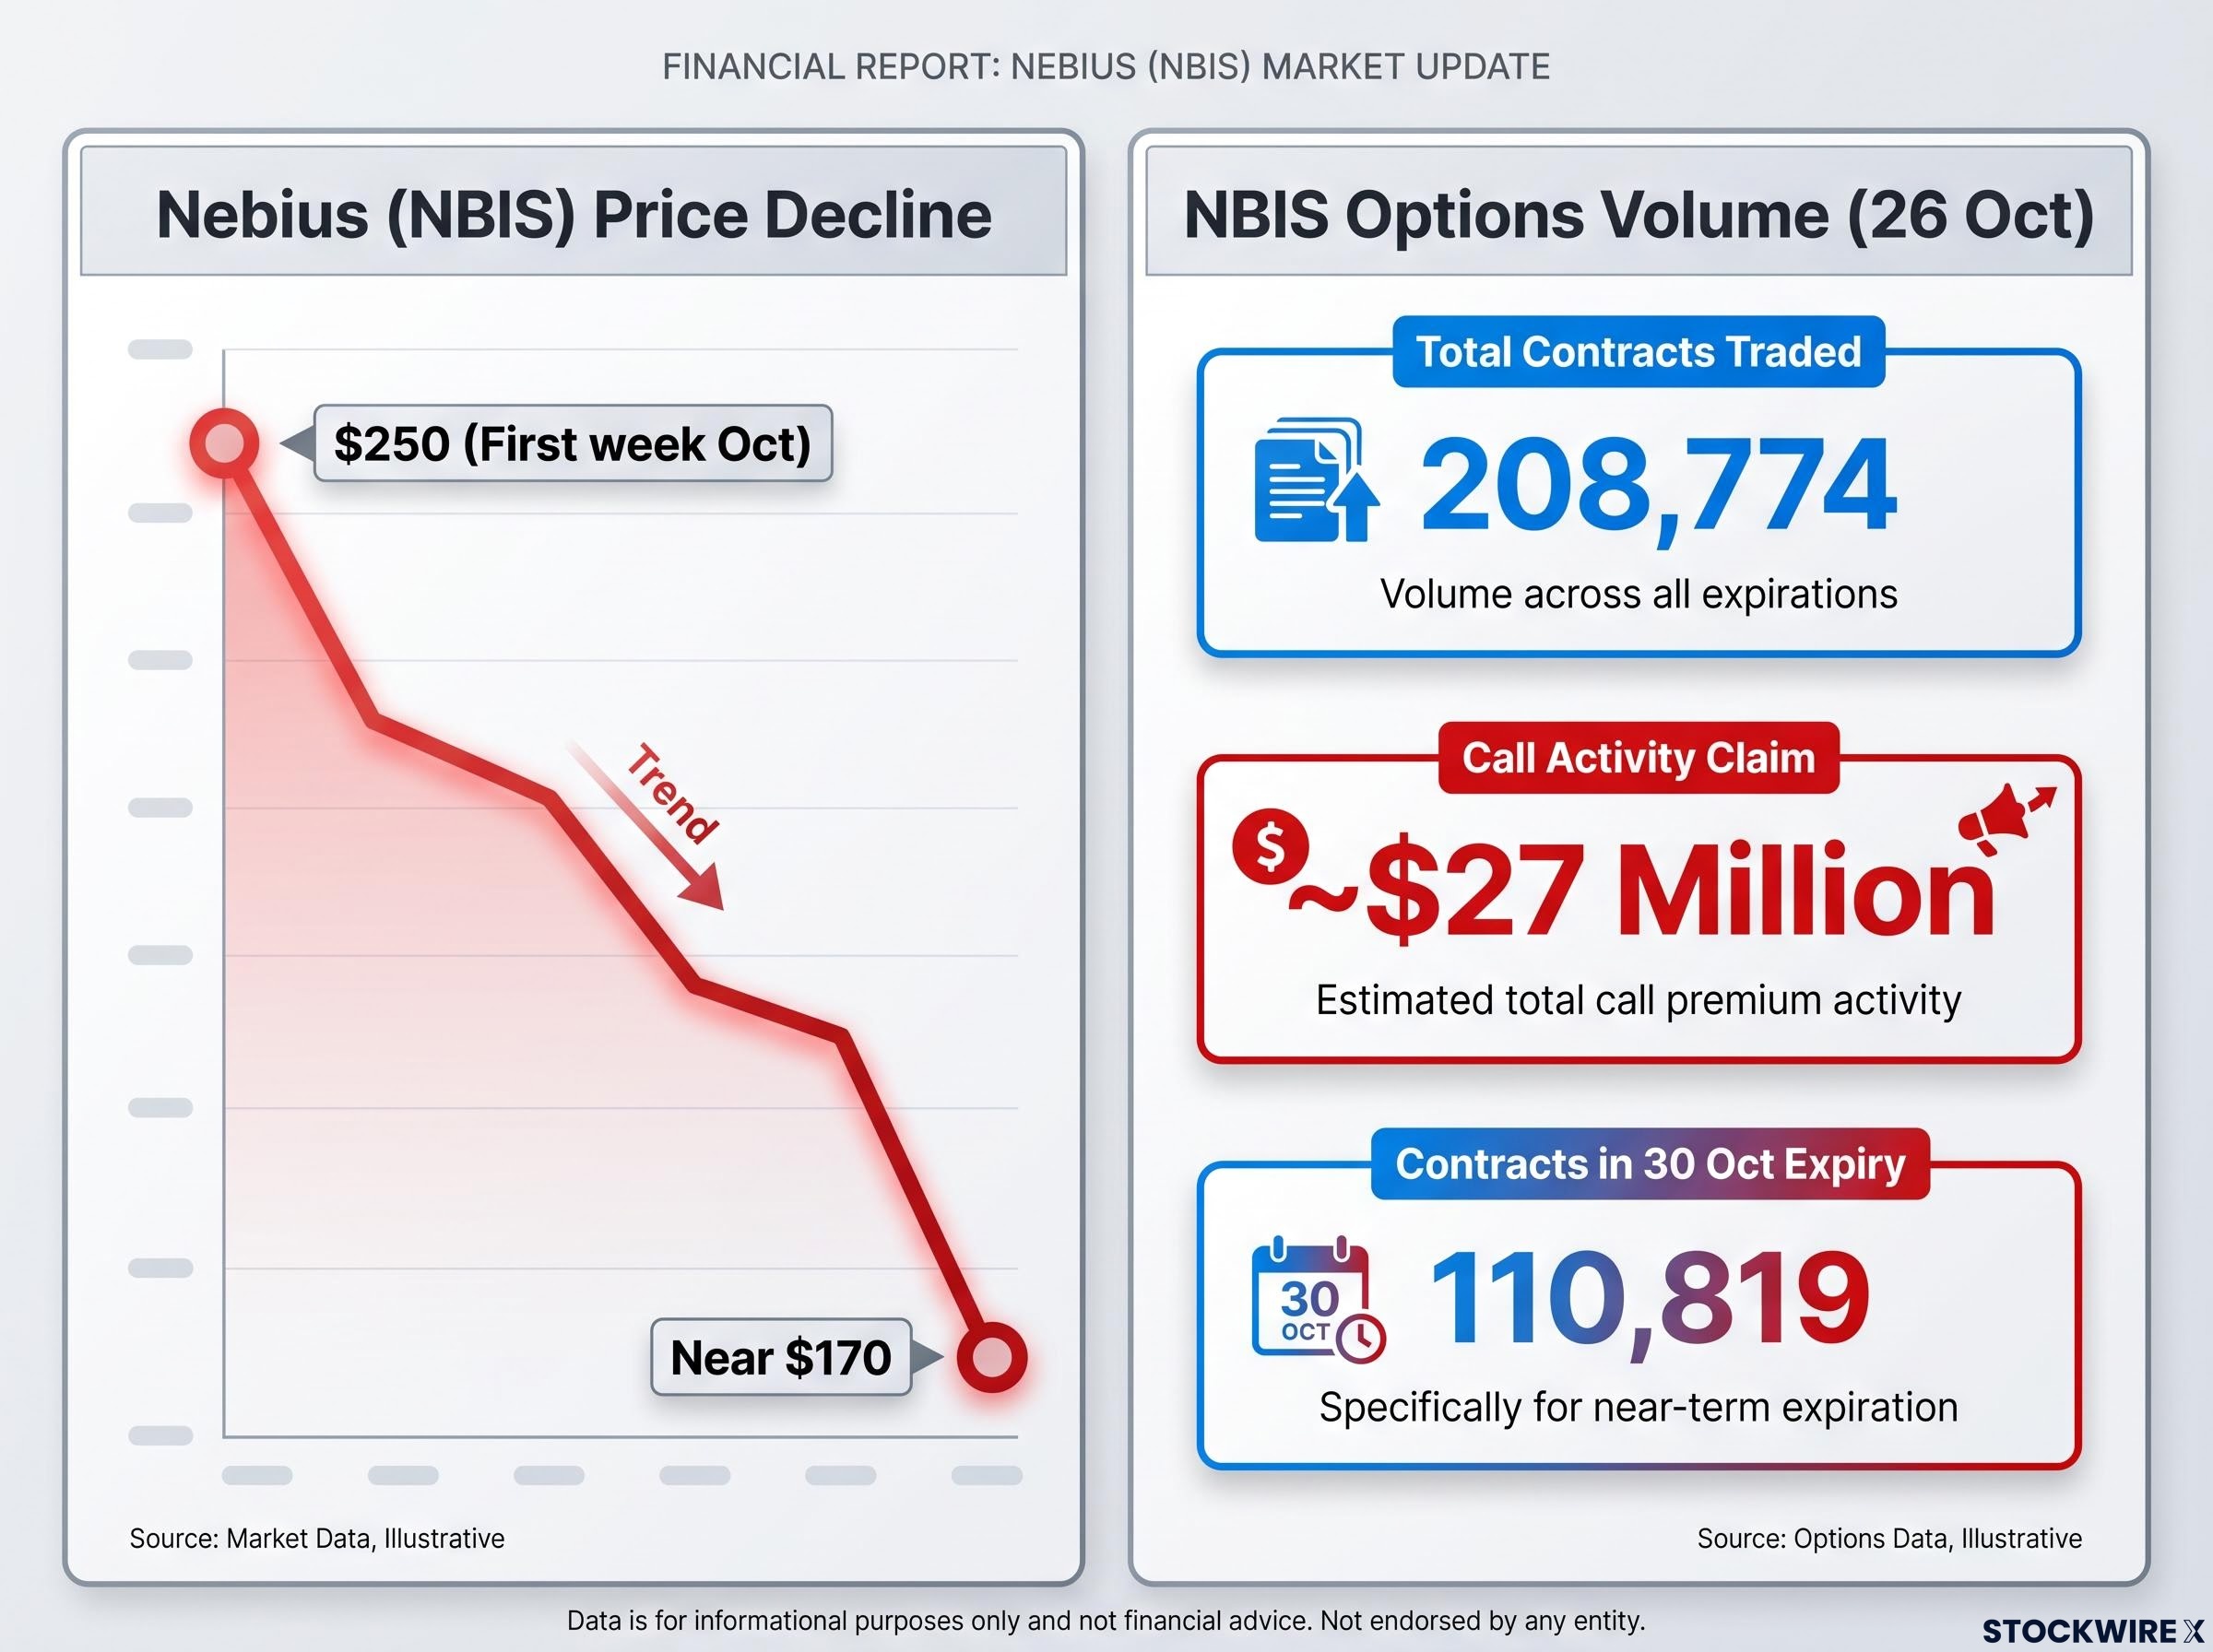
More than 208,774 Nebius option contracts changed hands on 26 October, and the trading show hosts who flagged it put the call activity at roughly $27 million, a figure no published source has independently confirmed. It looks like a crowd buying the dip. Yet heavy call volume says nothing on its own about whether open interest grew, and open interest is where the answer starts.
The stock, by the hosts’ account, sits near $170 after trading around $250 in the first week of October. Nebius, CoreWeave and IREN were each down at least 30% this month, according to CNBC, as worries about financing AI infrastructure spread through the neocloud group.
So traders are asking an obvious question: is someone stepping in? If you read a big call print as a bullish bet without checking anything else, you may be reading the signal backwards.
Here is a repeatable, mechanical check you can run on any ticker to sort heavy call activity into new positioning, closing, rolling or a spread.
What do volume and open interest actually measure?
The common misreading goes like this: a lot of calls traded, so a lot of people must be betting on a rise. That logic collapses once you separate two numbers that sound similar but count different things.
Volume is the total number of contracts traded during a session. Open interest (OI) is the number of contracts still outstanding once all opening and closing activity has been reconciled. CME’s educational material describes it simply: add the contracts opened, subtract the contracts closed.
Every trade has a buyer and a seller, but a newly opened trade adds only one contract to open interest. Whether OI moves depends on what each side was doing.
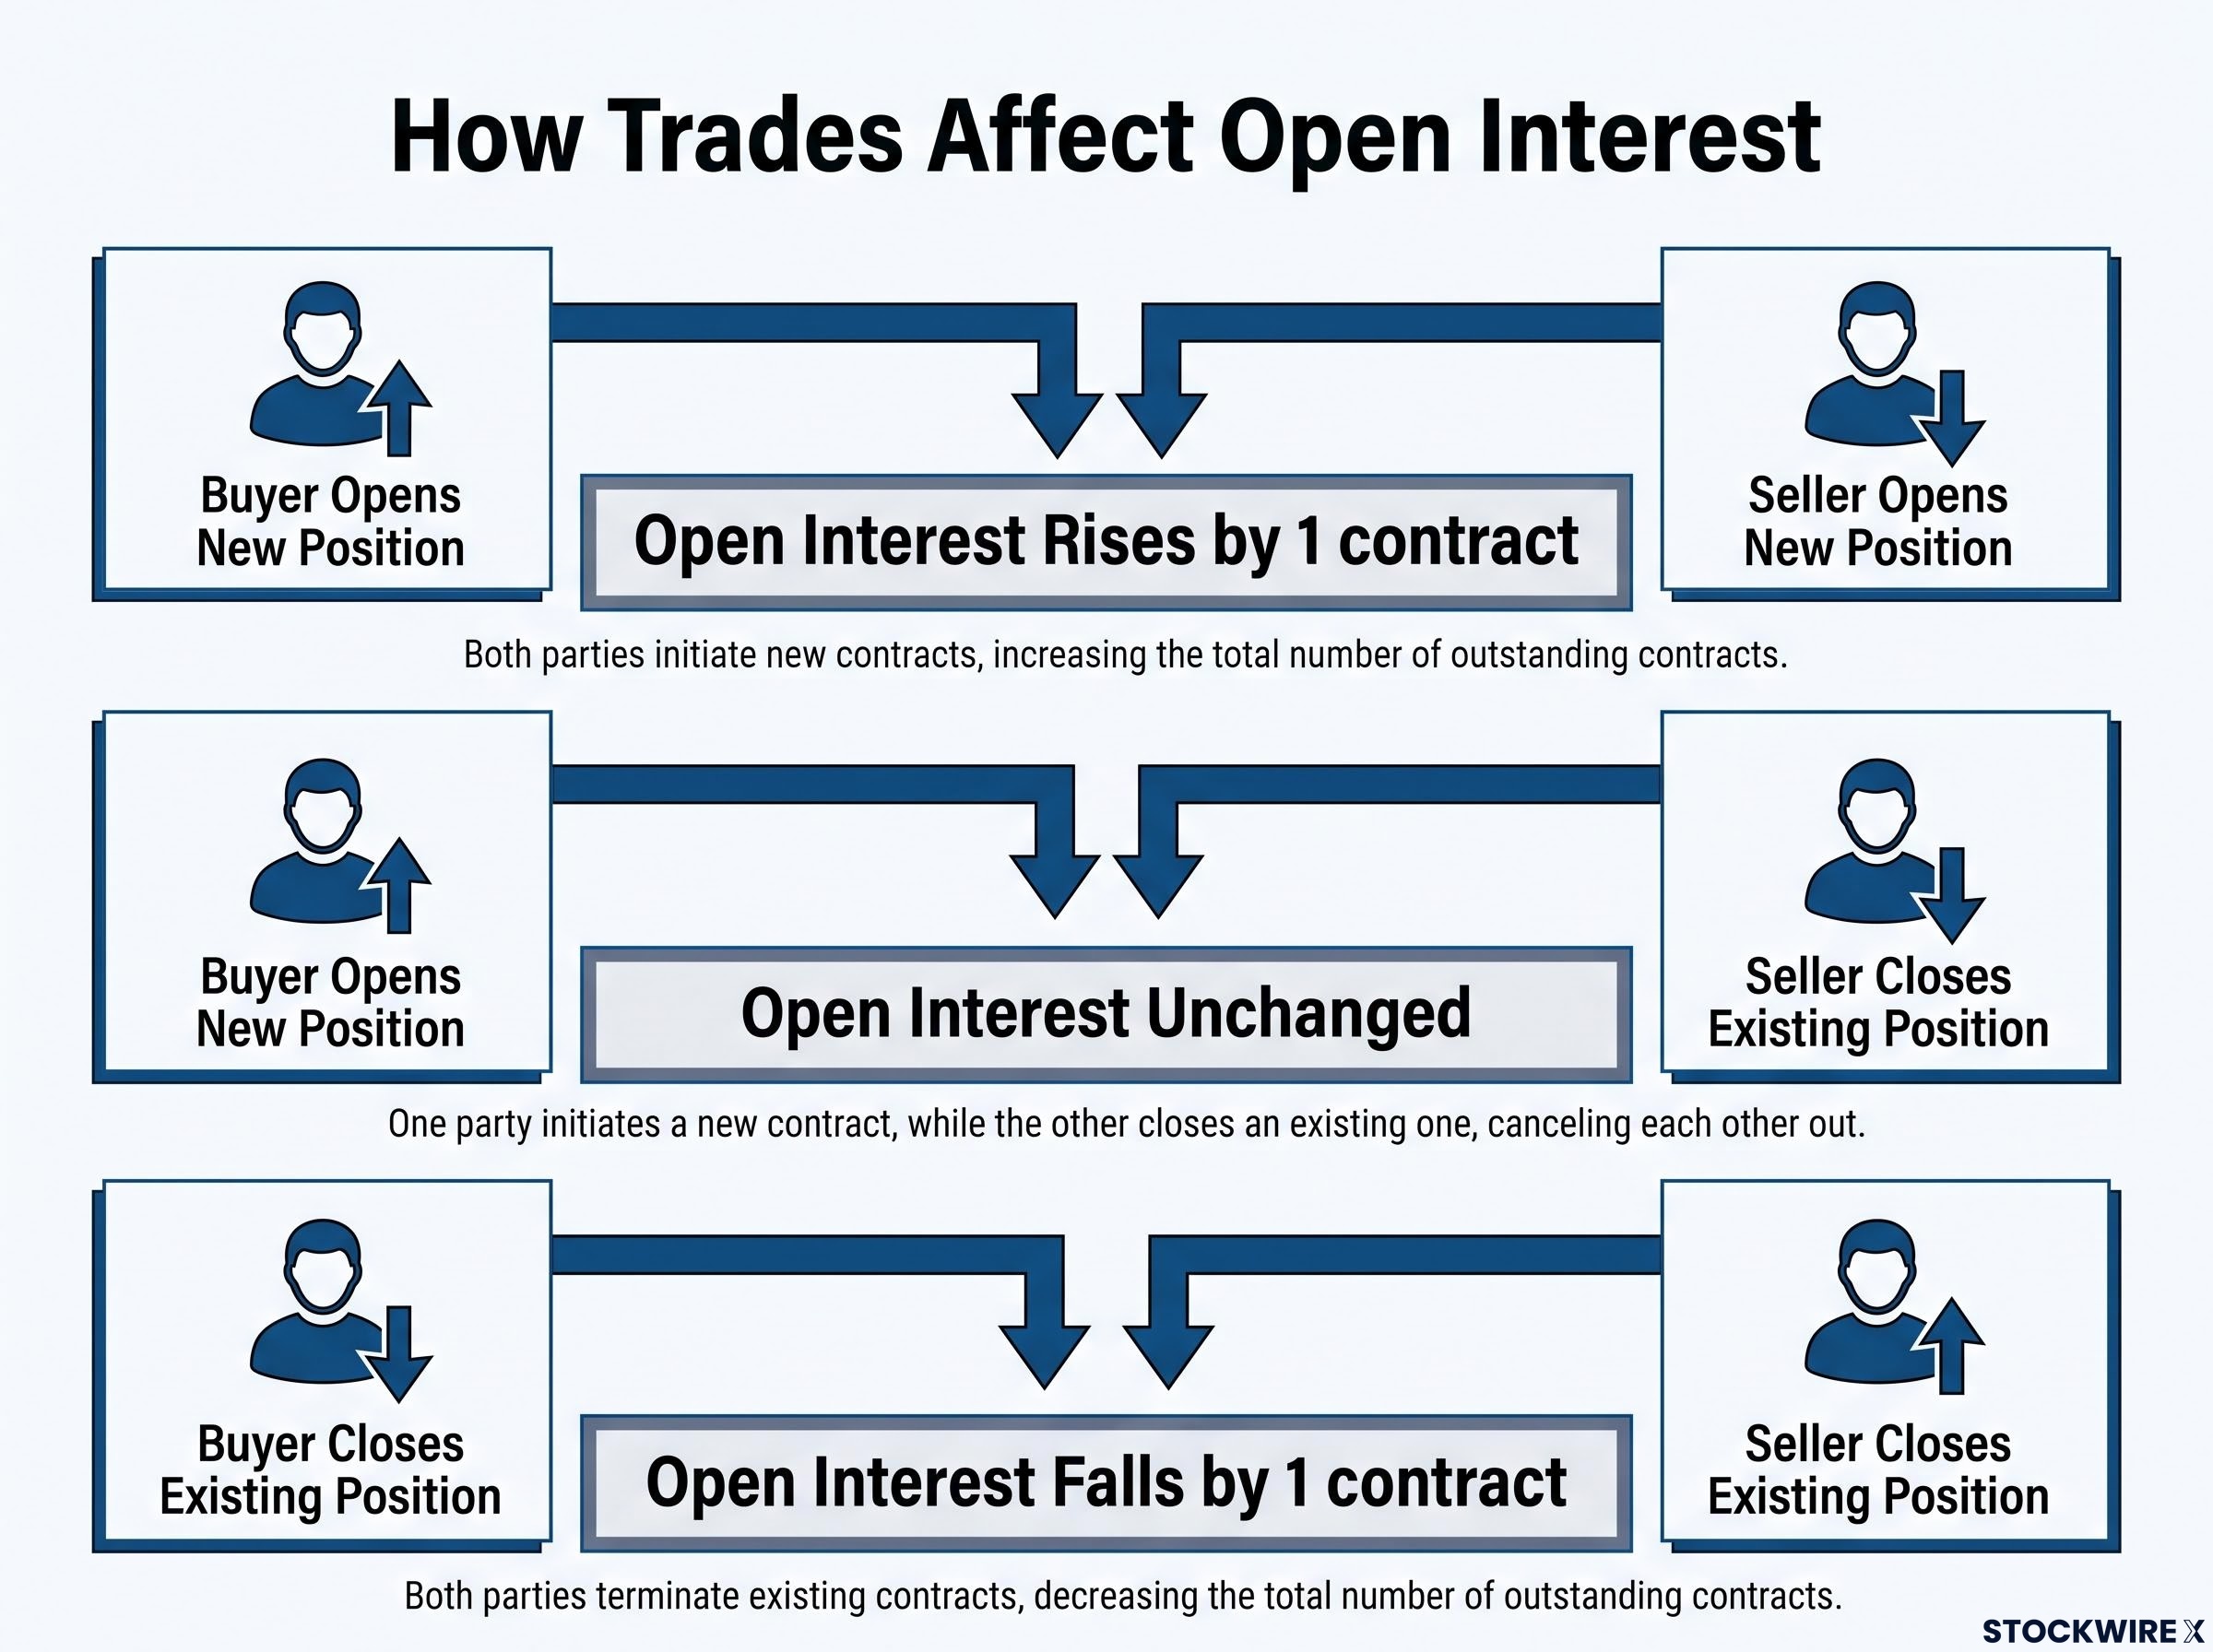
| Buyer action | Seller action | Effect on open interest |
|---|---|---|
| Opens a new position | Opens a new position | Rises by one contract |
| Opens a new position | Closes an existing position | Unchanged (the contract changes hands) |
| Closes an existing position | Closes an existing position | Falls by one contract |
That middle row matters most. Interactive Brokers’ options education, published on 21 October 2026, points out that a huge volume figure can sit alongside flat open interest when existing contracts simply move from one holder to another.
The same source makes a second point worth keeping in front of you.
Key point Open interest by itself is neither bullish nor bearish. It can reflect directional bets, volatility trades, hedges or spreads.
What this means for you: a headline volume number describes activity, not conviction. Treat it as the start of a question rather than the answer.
When big ASX news breaks, our subscribers know first
How do you read next-day open interest?
The cleanest way to see the logic is to take one volume print and let it land four different ways. The hosts used a simple setup: prior-day OI of 50,000 contracts at a given strike, and 20,000 contracts traded today.
Scenario table: what the change in open interest implies
| Next-day OI | Change | Most consistent reading | Caveat |
|---|---|---|---|
| 70,000 | +20,000 | Substantial new positions opened | New contracts exist; direction still unknown |
| 50,000 | Flat | Contracts changed hands, or opens and closes offset | Could include rolls or transfers between holders |
| 30,000 | -20,000 | Closing activity, such as profit-taking or short covering | Heavy volume came from positions shrinking |
| Rises at paired strikes | Increase across two or more strikes | Possibly one multi-leg trade, such as a call spread | One leg alone can look far more bullish than the package |
If OI climbs by roughly the amount traded, you are looking at fresh exposure. If it holds steady or drops, the activity fits closing, short covering, rolling or offsetting legs far better than a wave of new bulls.
Even the first row has limits. An OI increase proves new contracts exist; it does not prove anyone expects the price to rise, because every new long call has a new short on the other side.
Spreads and rolls: when one leg misleads
Suppose heavy volume shows up at both the 150 and 175 strikes. That may be a single call spread, where a trader buys one strike and sells the other to cap cost and upside, rather than two separate bullish bets.
Rolls create a similar illusion. A roll means closing an existing position and opening a new one at another strike or expiry, which is how Schwab’s documentation treats it, so volume spikes in both contracts while net exposure barely moves.
Run these four steps before drawing a conclusion:
- Compare today’s volume with prior-day OI at the exact strike and expiry.
- Wait for the next open interest update.
- Scan neighbouring strikes and expirations for paired activity.
- Weigh the premium paid and the level of implied volatility (the market’s priced-in expectation of future price swings).
Pairing the OI change with the premium involved, as the hosts suggested, helps you infer likely intent. Strikes, premium and price context finish the read that open interest begins.
Scanning the options chain across neighbouring strikes and expiries, and noting implied volatility and premium at each, is how traders separate a single bullish bet from a broader pattern of positioning.
What can the NBIS data tell you, and what can it not?
The bullish story writes itself. A stock falls about a third, calls light up, and the conclusion arrives ready-made: dip buyers piled in. Here is where the evidence actually stops.
What the NBIS numbers show
Market Chameleon recorded 208,774 NBIS option contracts on 26 October, with 110,819 of them in the 30 October expiry (data as of 28 October). That expiry is only days away, so the concentration may reflect tactical trades or hedging rather than a patient bet on recovery.
The roughly $27 million figure came from the hosts and remains unverified. Contract counts are the reliable metric here, and they describe activity rather than motive.
Alerts about unusual options activity confirm that abnormal volume occurred at a strike, but they cannot say whether the trade was a directional bet, a hedge or one leg of a multi-leg structure.
- You can conclude: NBIS options traded heavily, and more than half of that volume sat in a very short-dated expiry.
- You can conclude: the activity occurred during a steep decline, with the price near $170 against roughly $250 earlier in October, per the hosts.
- You cannot conclude: that the calls were bought to open rather than sold or closed.
- You cannot conclude: that the volume was a directional bet rather than a spread, roll or market-maker hedge.
No documented case was found in which a large NBIS call-volume episode was later classified conclusively by open interest. Strike-by-strike before-and-after records would be needed to settle it.
When open interest data is published
Open interest is not a live number. It is a reconciled count that the Options Clearing Corporation (OCC) and the exchanges update after the close, available before the next session opens; Schwab and CME both describe daily updates.
Timing note You can compare today’s volume with the prior session’s open interest during the day, but today’s new positions generally cannot be confirmed until the next daily update.
The hosts mentioned that Frankie, an experienced exchange trader, has long pushed Cboe for intraday OI updates, because the wait delays the signal. For you, that means any “dip buyers piled in” claim is a hypothesis until strike-level OI confirms new contracts, and even then intent stays uncertain.
Why does credit stress matter for neocloud stocks?
If options data cannot tell you what traders intended, the credit market can at least tell you why NBIS fell. The pressure began with CoreWeave’s debt.
| Date | Source | Credit indicator |
|---|---|---|
| 15 October 2026 | CNBC | CoreWeave five-year CDS spread above 1,140 bps; more than $51B of debt and obligations |
| 16 October 2026 | Reuters | Some CoreWeave bond yields around 15%-16% |
| 21 October 2026 | CNBC | High-yield issuance effectively on hold |
| 22 October 2026 | Nebius | $3.5B Citi facility at 2.75 points over Term SOFR |
A credit default swap (CDS) is a contract that pays out if a borrower defaults, and its spread is the annual cost of that protection in basis points. When it widens this far, lenders are pricing in real doubt.
How financing costs reach the share price
Neoclouds spend heavily on GPUs, data centres and power before those assets earn revenue. Higher yields raise interest costs, make refinancing harder and make issuing new shares more dilutive, which drags on equity valuations across the group.
Nebius has argued it is less exposed. Its chief revenue officer said the company leans more on equity raises, convertibles, customer prepayments and operating cash flow than CoreWeave does.
Structural or cyclical?
The structural view holds that the sector may be over-levered, reliant on a few large customers and exposed to fast hardware obsolescence. The cyclical view says risk-averse credit markets and the issuance pause can push prices too far even if long-run demand holds.
Nvidia CEO Jensen Huang captured that gap, per CNBC, calling neocloud demand extremely strong while warning that capital is scarce. Both camps can point to evidence.
The hosts noted credit and equities bouncing together ahead of Microsoft, Alphabet and Amazon earnings, with JNK, a high-yield bond ETF, rising toward its October high; no verifiable percentage move was found. Relief in credit does not prove bullish call buying, though. Market makers hedge, calls may be closed for profit, and some trades are pure volatility plays. Credit headlines explain why NBIS fell; open interest only shows whether positions were created, and you get a better read by combining the two.
For readers wanting the company-level picture, our full explainer on Nebius debt and short interest shows how rising short interest, up to about 20% of free float, fits the financing story.
Reading the next open interest update with clearer eyes
Keep the frame simple. Volume tells you something happened. Open interest tells you whether exposure was created. Strikes and premium hint at structure, and none of them reveal intent.
For NBIS, compare the next published OI for the heavily traded strikes, especially the 30 October expiry, against the prior-day figures. Watch the Microsoft, Alphabet and Amazon results as the next test of sentiment around AI infrastructure.
The takeaway works on any ticker this week: never act on a call-volume headline until you have seen the next day’s open interest at the same strike and checked its neighbours.
This article is for informational purposes only and should not be considered financial advice. Investors should conduct their own research and consult with financial professionals before making investment decisions. Past performance does not guarantee future results, and any interpretation of options activity is speculative and subject to change as market data develops.