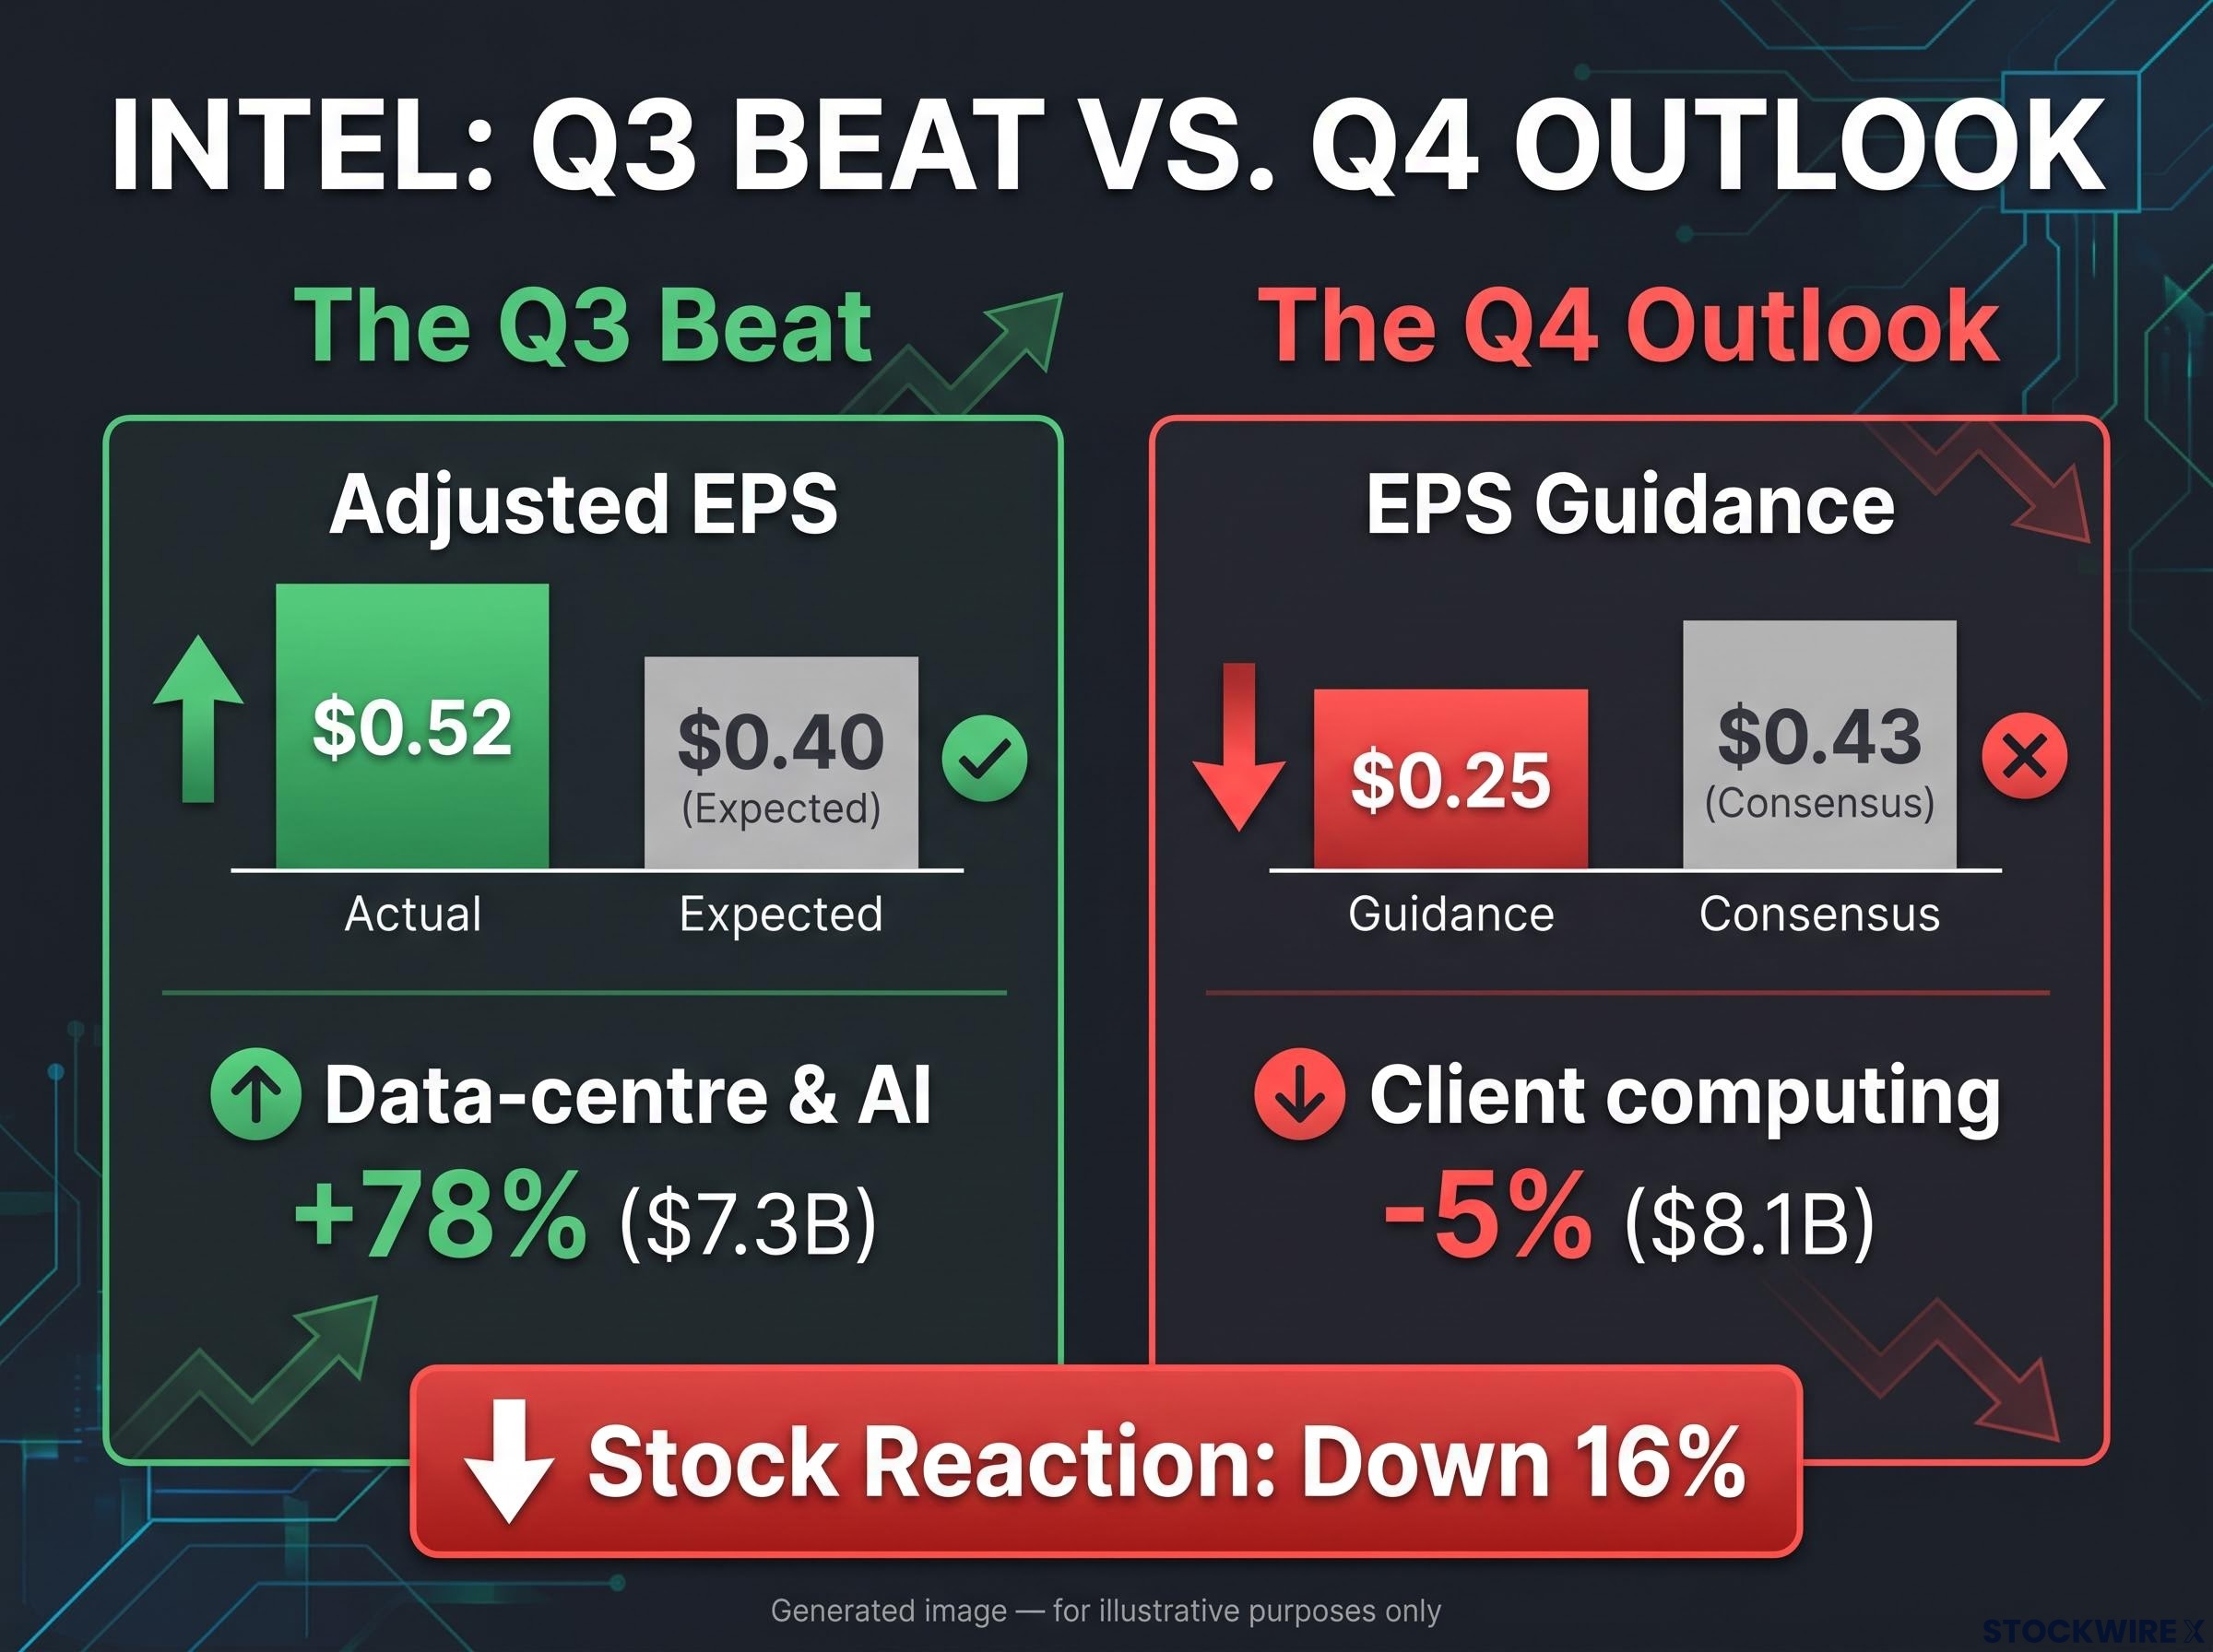
Intel beat Wall Street’s earnings forecast by roughly 30%, posting adjusted earnings per share (EPS) of $0.52 against $0.40 expected. The stock still fell as much as 16%. In a sell the news market, a better-than-expected quarter can trigger selling rather than buying.
Amazon delivered the more familiar version of the story. A rare miss on both revenue and earnings left the shares down about 4% in the regular 29 October session, according to CNBC.
Both reactions arrived in a season that looks excellent on paper. FactSet shows blended S&P 500 earnings growth of 29.5%, and the same week brought a 3.4% GDP headline that beat forecasts. If you read earnings as a simple pass-or-fail test, this season can cost you money.
Here is how to read earnings reactions when expectations run hot. You will also get a view on whether this selling is a pause or a sentiment top, and the specific S&P 500 levels that would change that view.
Why do good earnings get sold in a priced-in market?
The puzzle comes down to one idea. Share prices move on results compared with what investors already expected, not on whether results are good in isolation. “Sell the news” describes traders buying ahead of an event and then taking profits once it arrives.
Published consensus is the average analyst forecast. The whisper number is the higher, unofficial expectation built into the share price. Suppose consensus sits at $0.40 but the stock has run as if $0.55 is coming. A $0.52 result beats the analysts and still disappoints the price.
Commentary from Reuters, CNBC and FactSet points to a four-step process of expectations compression:
- Investors had already positioned for strong AI, cloud, semiconductor and tech results.
- Companies beat published consensus but often failed to clear the whisper number.
- Attention moved to capital expenditure (capex, the money spent on long-term assets), free cash flow, margins and guidance.
- High valuation multiples made stocks more sensitive to small disappointments.
That third step is where the AI debate now sits.
The AI test Ninghui Liu of State Street Investment Management told Reuters on 20 October that investors are not asking whether AI use will grow. They are asking whether each dollar of AI capex will earn more than its financing cost.
Beat rate versus beat size
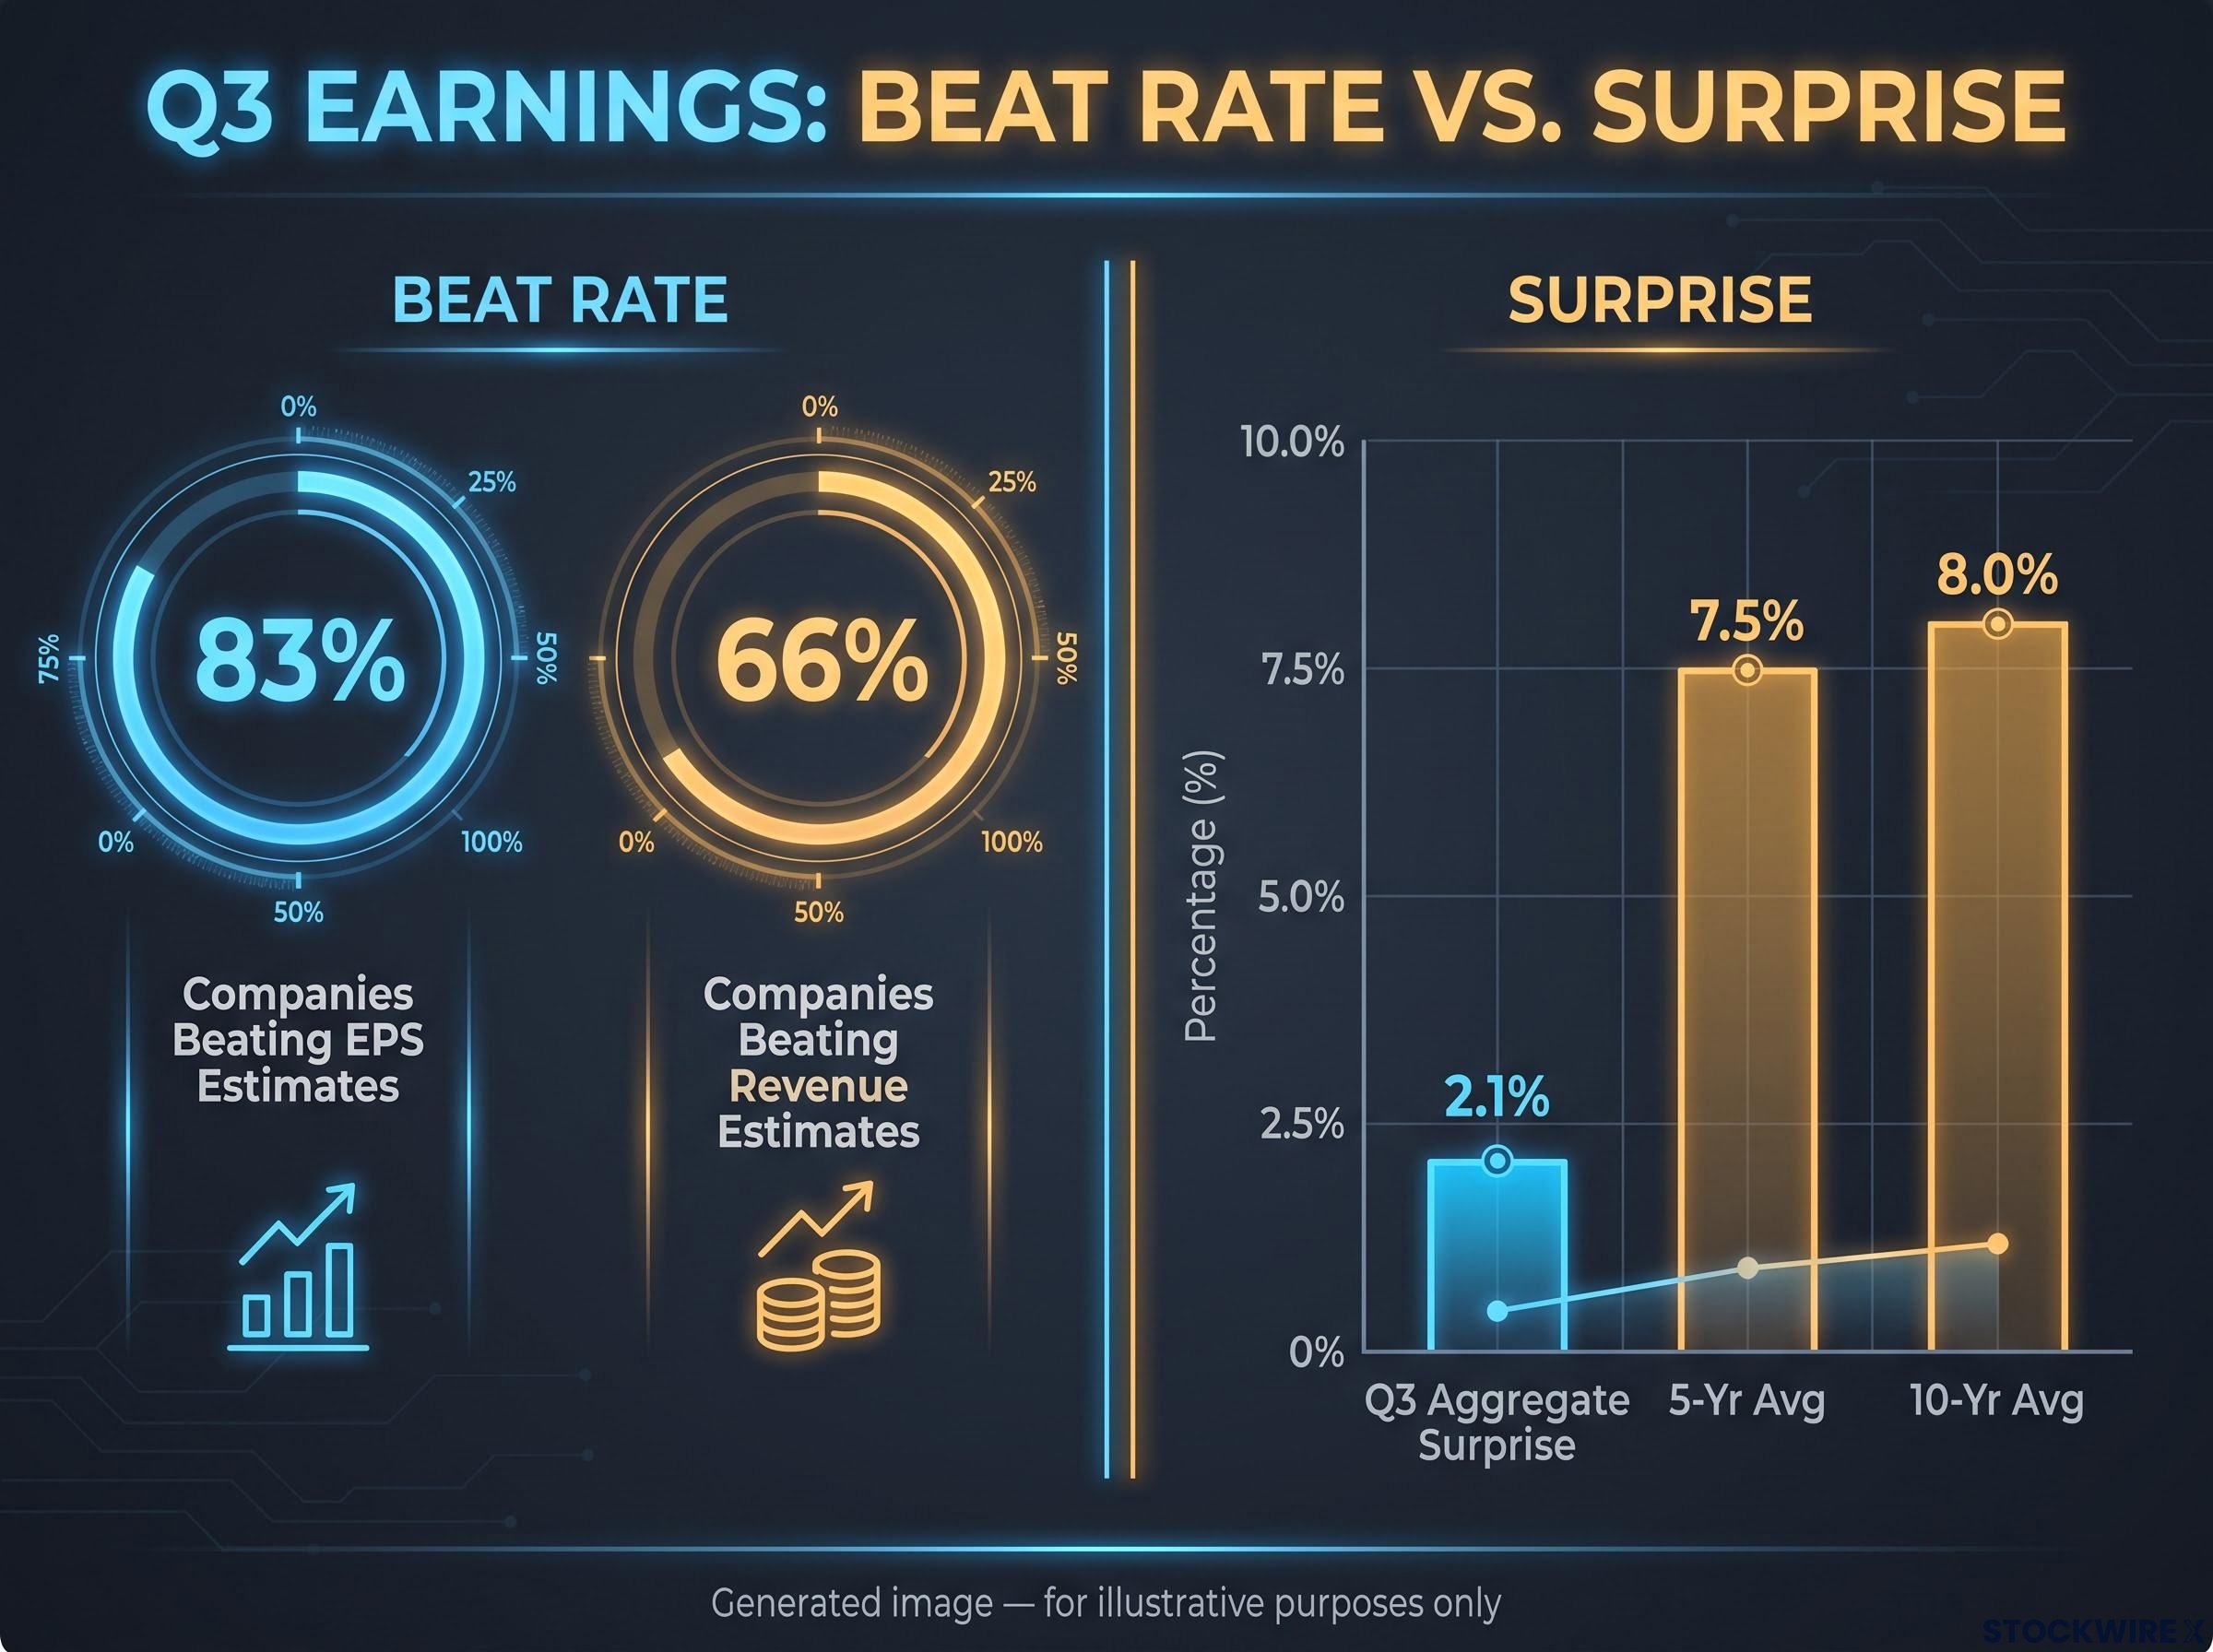
FactSet’s numbers show how strong breadth and selling can sit side by side.
| Measure | Result | What it signals |
|---|---|---|
| Companies beating EPS estimates | 83% | Broad, healthy breadth |
| Companies beating revenue estimates | 66% | Top-line strength is less widespread |
| Aggregate earnings surprise | 2.1% (5-yr avg 7.5%, 10-yr avg 8.0%) | Beats are unusually small |
| Blended Q3 earnings growth | 29.5% | Strong, but largely expected |
The aggregate surprise measures how far total earnings exceeded estimates, not how many companies beat. A high beat rate paired with a thin surprise tells you the market is paying only for genuine upside. Clearing a bar everyone already priced in does not earn a rally, so a “beat” headline alone is not a buy signal.
FactSet data from the wider reporting season shows the same pattern, with a thin aggregate surprise and an average reaction to positive surprises near -0.2%, suggesting beats are being priced before the results land.
When big ASX news breaks, our subscribers know first
What Intel and Amazon show about how the market now grades results
Two different failure modes landed on the same day. One is easy to explain. The other matters more.
Amazon, the conventional double miss
Amazon reported Q3 revenue of about $201.9 billion, up 12%, against roughly $202.3 billion expected. GAAP EPS came in at $1.89 versus $1.96. CNBC reported the shares were down as much as about 9% initially, before closing the regular session about 4% lower and trading roughly 6.5% lower after hours.
Lofty expectations met a modest miss. That is the baseline case.
Intel, the beat that still sold
Intel’s problem was the outlook, not the quarter. Management guided to Q4 adjusted EPS of $0.25 and revenue of $15-16 billion, well short of consensus at $0.43 and $17.1 billion. Revenue of $16.51 billion for the quarter was essentially in line.
The segment split sharpened the concern. Client computing and physical-AI revenue fell 5% to $8.1 billion, while data-centre and AI revenue rose 78% to $7.3 billion. CNBC coverage also linked the selling to a share-price run of more than 150% this year before earnings, a figure not independently confirmed.
| Metric | Result | Consensus | Reaction |
|---|---|---|---|
| Amazon Q3 revenue | $201.9B | $202.3B | About -4% regular session |
| Amazon GAAP EPS | $1.89 | $1.96 | |
| Intel adjusted EPS | $0.52 | $0.40 | Down as much as 16% |
| Intel Q4 EPS guidance | $0.25 | $0.43 |
The market graded three things, and none of them was the trailing quarter:
- Guidance against consensus
- Business mix, particularly where growth is coming from
- Expectations already embedded in the share price
If you own a stock that has run hard into earnings, the guidance line matters more to your outcome than the quarter’s EPS. The price already holds the good news.
Forward guidance usually carries more weight than the reported quarter because markets price future earnings streams, which is why a guidance cut can outweigh an EPS beat inside the same release, as Intel’s Q4 outlook showed.
Why a strong GDP headline adds to the caution
On 29 October, the Bureau of Economic Analysis (BEA) reported real GDP growth of 3.4% annualised, ahead of the 3.2% forecast and the Atlanta Fed’s final GDPNow estimate of 3.3%. Consumer spending rose 3.8%. On the surface, the economy looks strong.
The composition tells a less comfortable story.
What the headline hides
Investment, not consumption, drove the acceleration. The contribution figures below come from the original source’s analysis of the release.
| Component | Contribution (points) | Driver |
|---|---|---|
| Consumption | +2.52 | Spending held up despite squeezed confidence |
| Investment | +3.27 | About 1.8 from data centres, about 1.6 from inventories |
| Net exports | About -3.32 | Tariffs and costly energy lifted imports (about -2.64) |
Before the release, GDPNow estimated the net-export drag at about -2.69 points. The release-based -3.32 figure is the later and more authoritative number. Either way, trade subtracted more than consumers added.
Axios argued the AI boost is smaller than it appears because the buildout relies heavily on imported equipment. KPMG expects data-centre construction to keep business investment strong.
Durable versus fragile growth
Scale matters here. Consumption is about 68% of the economy and business investment about 14%, so a squeezed consumer could swamp the data-centre buildout. The growth sources rank roughly like this:
- Most durable: productivity-enhancing investment that produces future cash flow
- Less durable: inventory rebuilding, which can lift one quarter and reverse the next
- Less durable: import-heavy construction, which leaks growth abroad
- Least certain: spending supported by equity wealth, which Goldman-related analysis put at roughly 0.4 points of consumer-spending growth (unverified)
A growth number carried by inventories and import-heavy data-centre spending is less durable than it looks. It gives you less reason to expect earnings estimates to keep climbing, which helps explain why the market may be shifting from buying the rumour to selling the fact.
Healthy pause or sentiment top? The levels that decide it
The price action has developed a rhythm. According to the original source’s presenter at Tasty Live, the S&P 500 has twice bounced for three days, stalled at the same barrier near 7,800 on the December E-mini contract, then sold off as earnings arrived.
The two readings
The healthy-pause case comes from Goldman Sachs. Christian Mueller-Glissmann said on 20 October that risk appetite had sunk to its weakest since March, but lighter positioning and strong earnings could support a tactical recovery.
The sentiment-top case points to broad weakness. Reports, not independently verified, show the Nasdaq Composite fell 2.6% on 22 October with semiconductors down more than 8%, and the S&P 500 closing near 7,623.68 on 23 October, about 2.4% below its 6 October record. The selling has hit multiple AI, semiconductor and data-centre names, not just Amazon or Intel.
The evidence supports a valuation- and positioning-driven pause with a credible risk of becoming a sentiment top. It does not support declaring a completed bear-market top.
Truist’s work on the semiconductor cycle peak argues chip stocks have historically topped about a quarter after revenue growth peaks, which frames the recent semiconductor selloff as a possible valuation reset rather than a fundamental top.
Levels to watch
Reuters technical analyst Terence Gabriel A break above 7,770.40 could reopen record highs, while a close below the 100-day average near 7,604 shifts focus to 7,508 and 7,484.
| Market | Resistance | Support | What a break means |
|---|---|---|---|
| S&P 500 | 7,700-7,770; E-mini rejected near 7,800 | 7,600-7,605, then 7,508-7,484, then 200-day near 7,288-7,293 | Above weakens the top case; below strengthens it |
| Nasdaq-100 futures | Recent range highs | About 29,000; neckline near 27,200 | Neckline break would confirm Schwab’s possible double top |
The original source cites a similar but distinct Nasdaq target of about 27,500, with no index basis specified. Keep these cautions in mind:
- Support and resistance are zones, not exact lines.
- A double top is unconfirmed until its neckline breaks decisively.
- Futures and cash-index levels are not interchangeable.
- Technicals cannot judge whether AI spending will earn an adequate return.
Treat 7,800 and 7,600 on the S&P 500 as the two lines that show which story is winning. They are not guarantees, so size your decisions accordingly.
Past performance does not guarantee future results. These levels and scenarios are speculative and subject to change based on market developments.
What a priced-in market changes, and what it does not
Results are now graded against expectations, not headlines. GDP’s reliance on inventories and imports lowers the margin for error, and the repeated rejection near 7,800 shows the market’s patience being tested.
Some things have not changed. Earnings breadth remains strong, and in strong bull markets, sell-the-news reactions often give way to renewed gains.
Three variables will decide which way this resolves:
- Guidance versus consensus as the remaining reports land
- A decisive move above 7,800 or below 7,600 on the S&P 500
- Signs of consumer weakness or fresh doubts about AI returns
This article is for informational purposes only and should not be considered financial advice. Investors should conduct their own research and consult with financial professionals before making investment decisions.