JPMorgan Raises S&P 500 Forecast to 7,800, Citing AI Earnings Boom
2 hrs ago

The MSCI UK has trailed MSCI World by roughly 128 percentage points since the 2016 Brexit referendum. In the same period, no major developed equity market has delivered weaker returns, with only Chinese stocks sitting lower in the global performance rankings. A developed, mature, globally significant market sitting alongside China at the bottom of the global performance table is not a statistic that explains itself.
Barclays strategists led by Emmanuel Cau have published fresh analysis diagnosing why. Their conclusion challenges the convenient narrative that Brexit broke UK equities. The structural deterioration, they argue, was already underway before the vote. 2016 was the moment global investors found a simple reason to accelerate moves they were already contemplating.
Here is the framework for separating what Brexit actually caused from what was already breaking, and what it would take for UK equities to close the gap.
The headline numbers are stark, and they get worse in sequence.
Since the 2016 referendum, MSCI UK has posted cumulative underperformance against MSCI World of around 128% and fallen short of the Euro Stoxx 50 by approximately 30%. The UK’s proportion of total worldwide market capitalisation has slipped to around 3%, reaching an all-time low. Its weight in the MSCI All Country World Index (ACWI) has dropped from close to 10% two decades ago to around 4% today. (These two measures capture slightly different things, total global market cap versus index weight, but both point in the same direction.)
The European equity gap relative to US markets reflects a distinct set of pressures from the UK’s structural deterioration, with the STOXX Europe 600 consolidating below its February 2026 highs while the S&P 500 climbed roughly 9% higher over the same period, illustrating that the UK’s underperformance against continental peers sits inside a broader pattern of non-US market weakness.
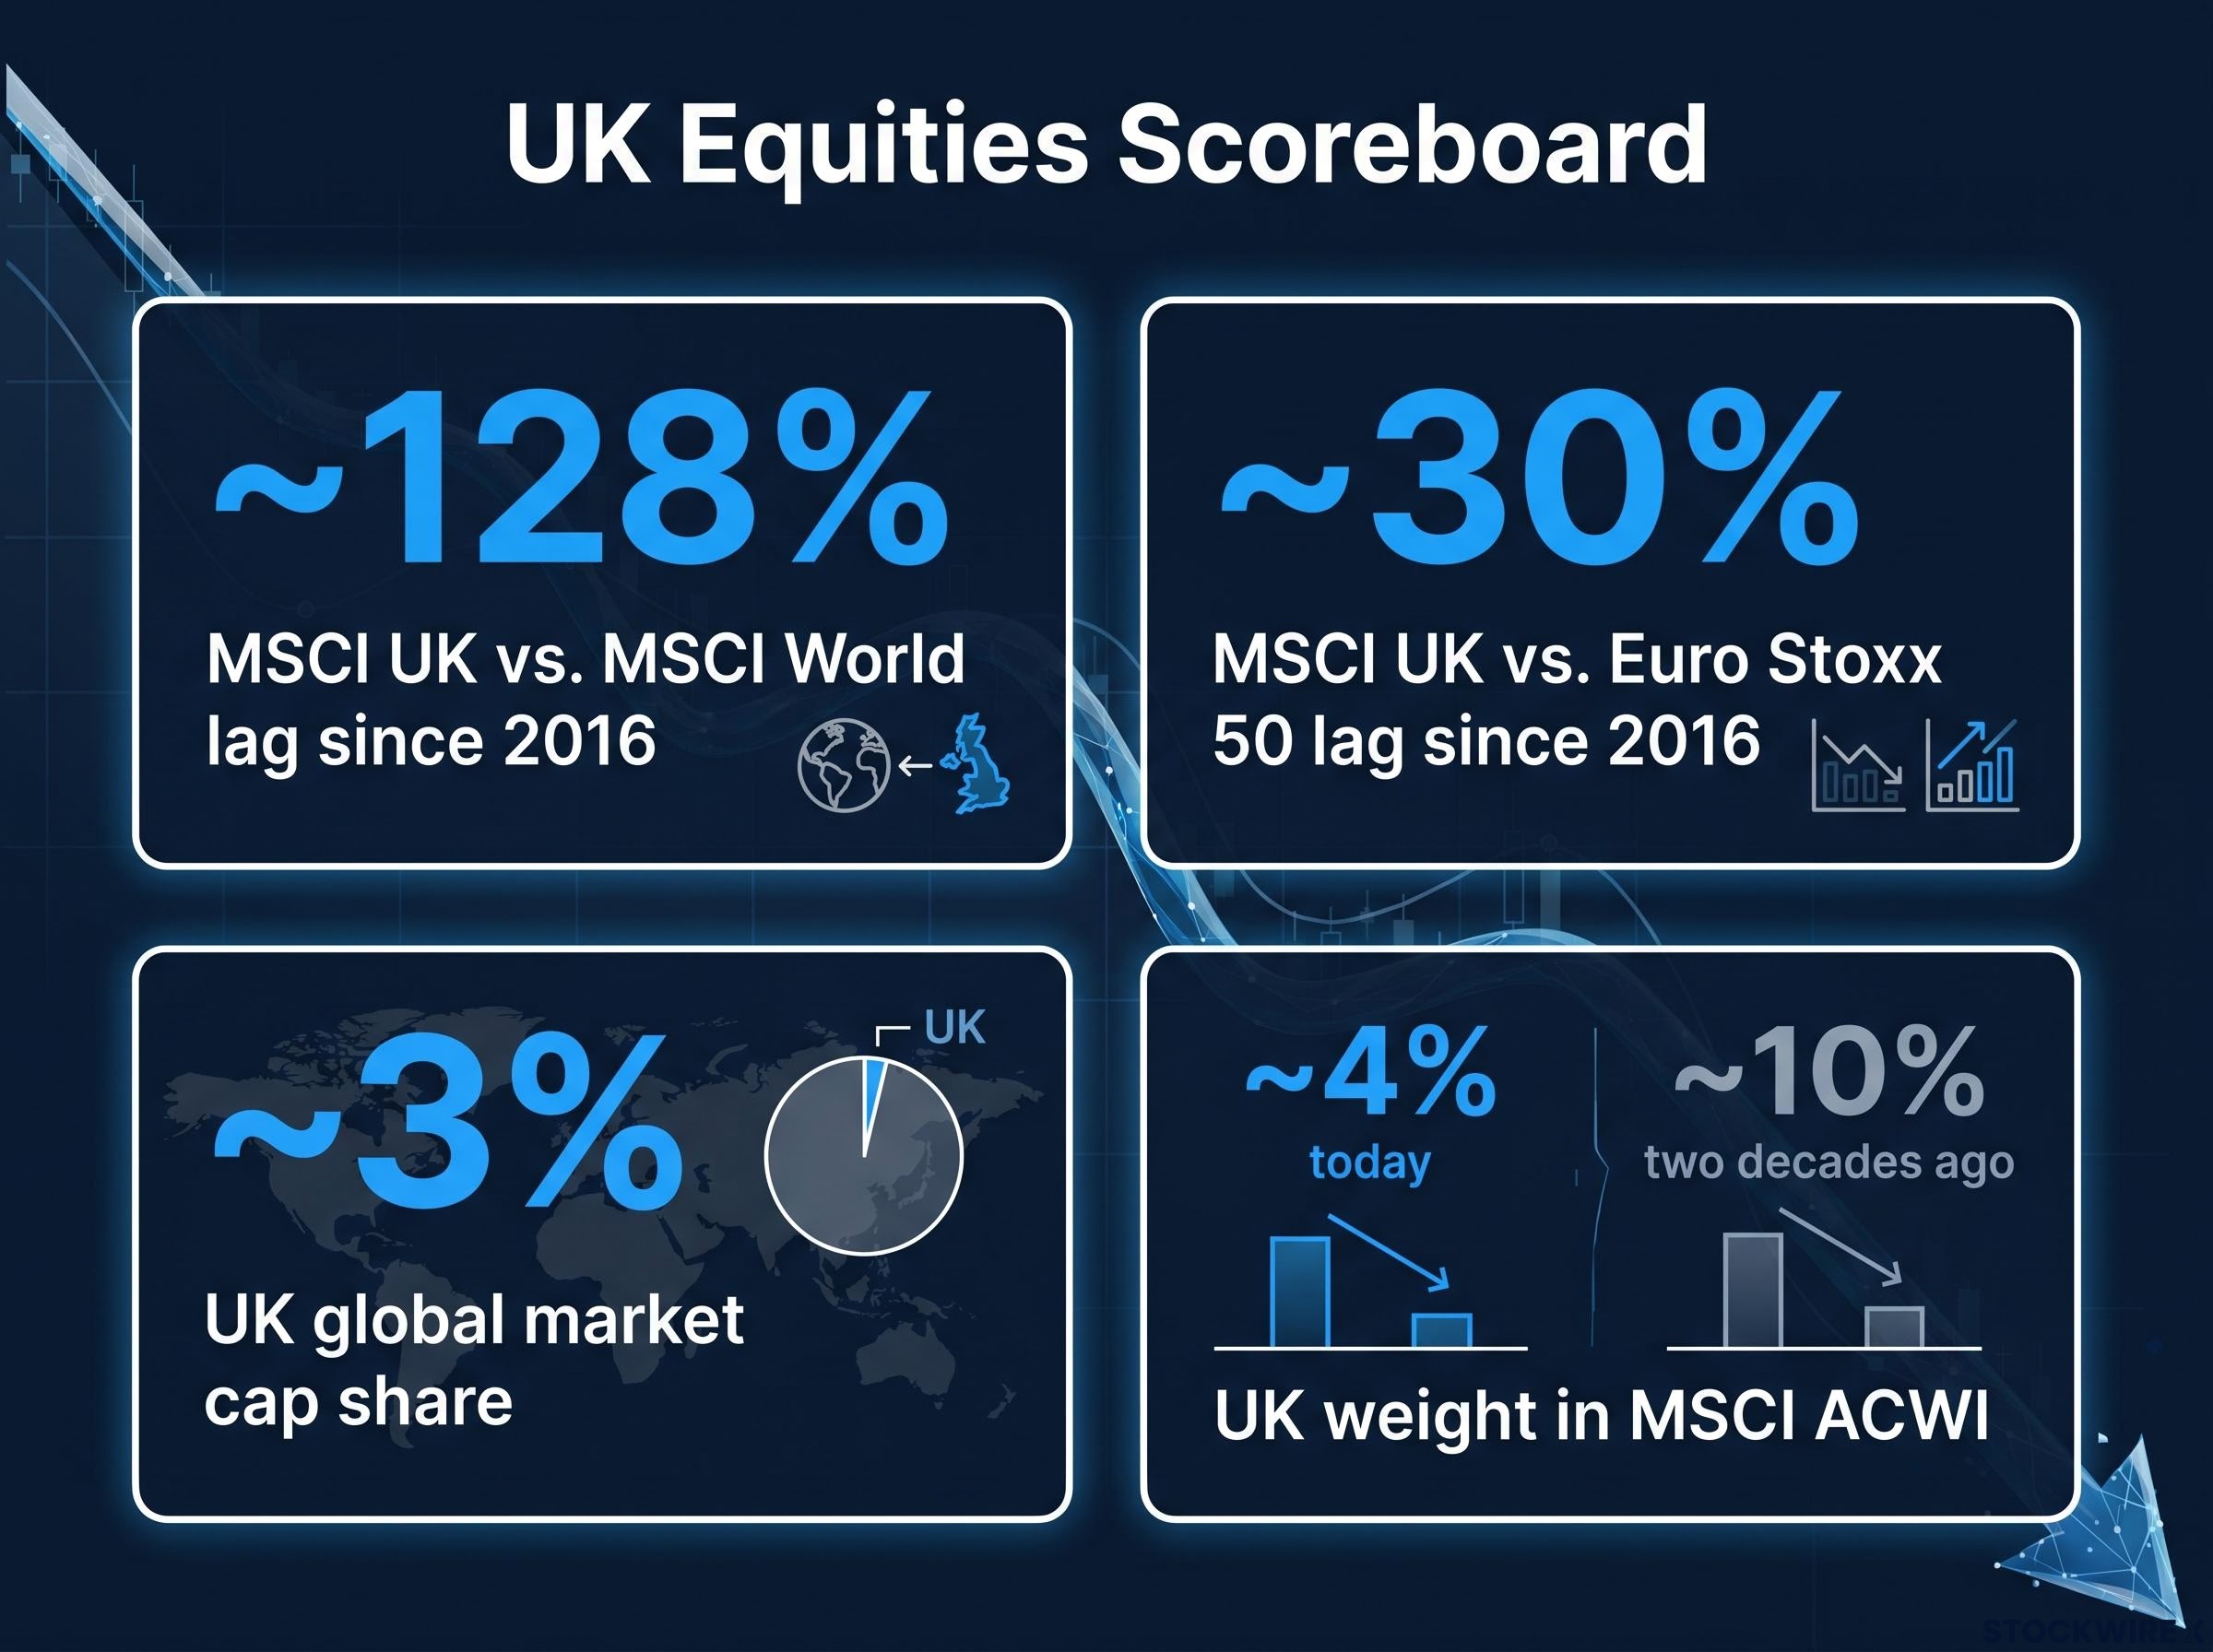
| Metric | Figure | Comparison / Context |
|---|---|---|
| MSCI UK vs. MSCI World lag since 2016 | ~128% | Only Chinese equities performed worse among major markets |
| MSCI UK vs. Euro Stoxx 50 lag since 2016 | ~30% | Continental Europe has pulled away despite sharing many of the same macro headwinds |
| UK global market cap share | ~3% | Record low (Barclays/Investing.com) |
| UK weight in MSCI ACWI | ~4% (vs. ~10% two decades ago) | More than halved in relative index importance (Morningstar) |
These are not abstract index statistics. A UK investor who held a globally diversified portfolio over this decade compounded wealth at roughly two and a half times the rate of one concentrated in domestic equities. That is the real cost of the underperformance, measured in retirement balances and opportunity foregone.
Something deeper than a single political event is at work.
The conventional story is tidy: UK equities were fine, then the country voted to leave the European Union, and markets have been punished ever since. The evidence tells a more complicated story.
Domestic institutional equity ownership was already falling sharply before 2016. London’s competitiveness as a listings venue was eroding through the early 2010s. The rise of global index investing, which funnelled capital disproportionately into US technology, was draining allocations from the UK well before anyone had heard the word “Brexit.”
The structural tilt toward American markets that drained allocations from the UK did not happen in isolation; US equity home bias among retail and institutional investors had quietly turned a nominally global asset class into a concentrated bet on American technology, reinforcing the same capital flow dynamic that left UK weights in global indices at record lows.
What the referendum did was provide a powerful, discrete political shock. It elevated uncertainty about the UK’s trading regime, regulatory alignment with Europe, and London’s status as the continent’s financial centre. That uncertainty produced a multi-year investment chill. FDI flows into the UK, which had peaked around the time of the vote, went into sustained negative territory in the years that followed. Portfolio outflows from UK equity funds became chronic. The valuation discount relative to global peers widened and stayed wide.
Barclays strategists characterise UK equity underperformance as rooted primarily in de-rating, accompanied by substantial capital outflows over the past decade, rather than an earnings collapse.
The distinction between accelerant and architect matters. It implies that simply resolving trade frictions with the EU, even if politically achievable, would not be sufficient on its own to reverse the underperformance. The roots run deeper.
De-rating is the mechanism Barclays identifies as the primary driver, and understanding it explains why the UK has not simply snapped back.
De-rating means investors are willing to pay lower multiples for the same earnings. If a company earns $1 per share and investors previously paid 15 times that, a de-rating to 10 times means the share price falls by a third, even if earnings haven’t changed. Applied across an entire market, the effect is a persistent drag on index-level returns.
Two forces have driven the UK’s de-rating. The first is sector composition. The UK market is heavily weighted toward financials, energy, and materials, and carries low exposure to technology and healthcare. These are the sectors that have driven global equity returns over the past decade.
The second force is the feedback loop that makes the first force self-reinforcing.
UK equities trade at a price-to-earnings (P/E) discount of approximately 30-35% relative to US equities. That sounds like an obvious opportunity. It is not, at least not automatically.
The discount reflects rational pricing of structurally lower earnings growth expectations. Global allocators seeking long-run compounding do not pass over UK equities because they have missed the cheap valuation. They pass over them because they are optimising for a different variable: structural growth.
Bank of England analysis of equity risk premia published in early 2025 finds that elevated US earnings growth expectations, rather than suppressed risk appetite, explain much of the valuation gap between US and UK equities, reinforcing the case that the UK discount reflects structural growth differentials rather than a temporary sentiment overshoot.
Lower valuations, in turn, make London less attractive as a listing venue for high-growth companies. Those companies list in New York instead, where they receive higher multiples. The UK’s sector composition stays tilted toward old-economy sectors, and the de-rating persists. For UK investors, a 30-35% P/E discount is not a mispricing waiting to correct. It is a market pricing in structurally weaker growth, and the structure keeps reinforcing the price.
The UK equity market has lost something most investors never think about: its domestic anchor.
The share of UK equities held by domestic investors has contracted from around 80% in the early 1990s to approximately 42% today, representing one of the most pronounced long-run shifts in the structure of UK capital markets.
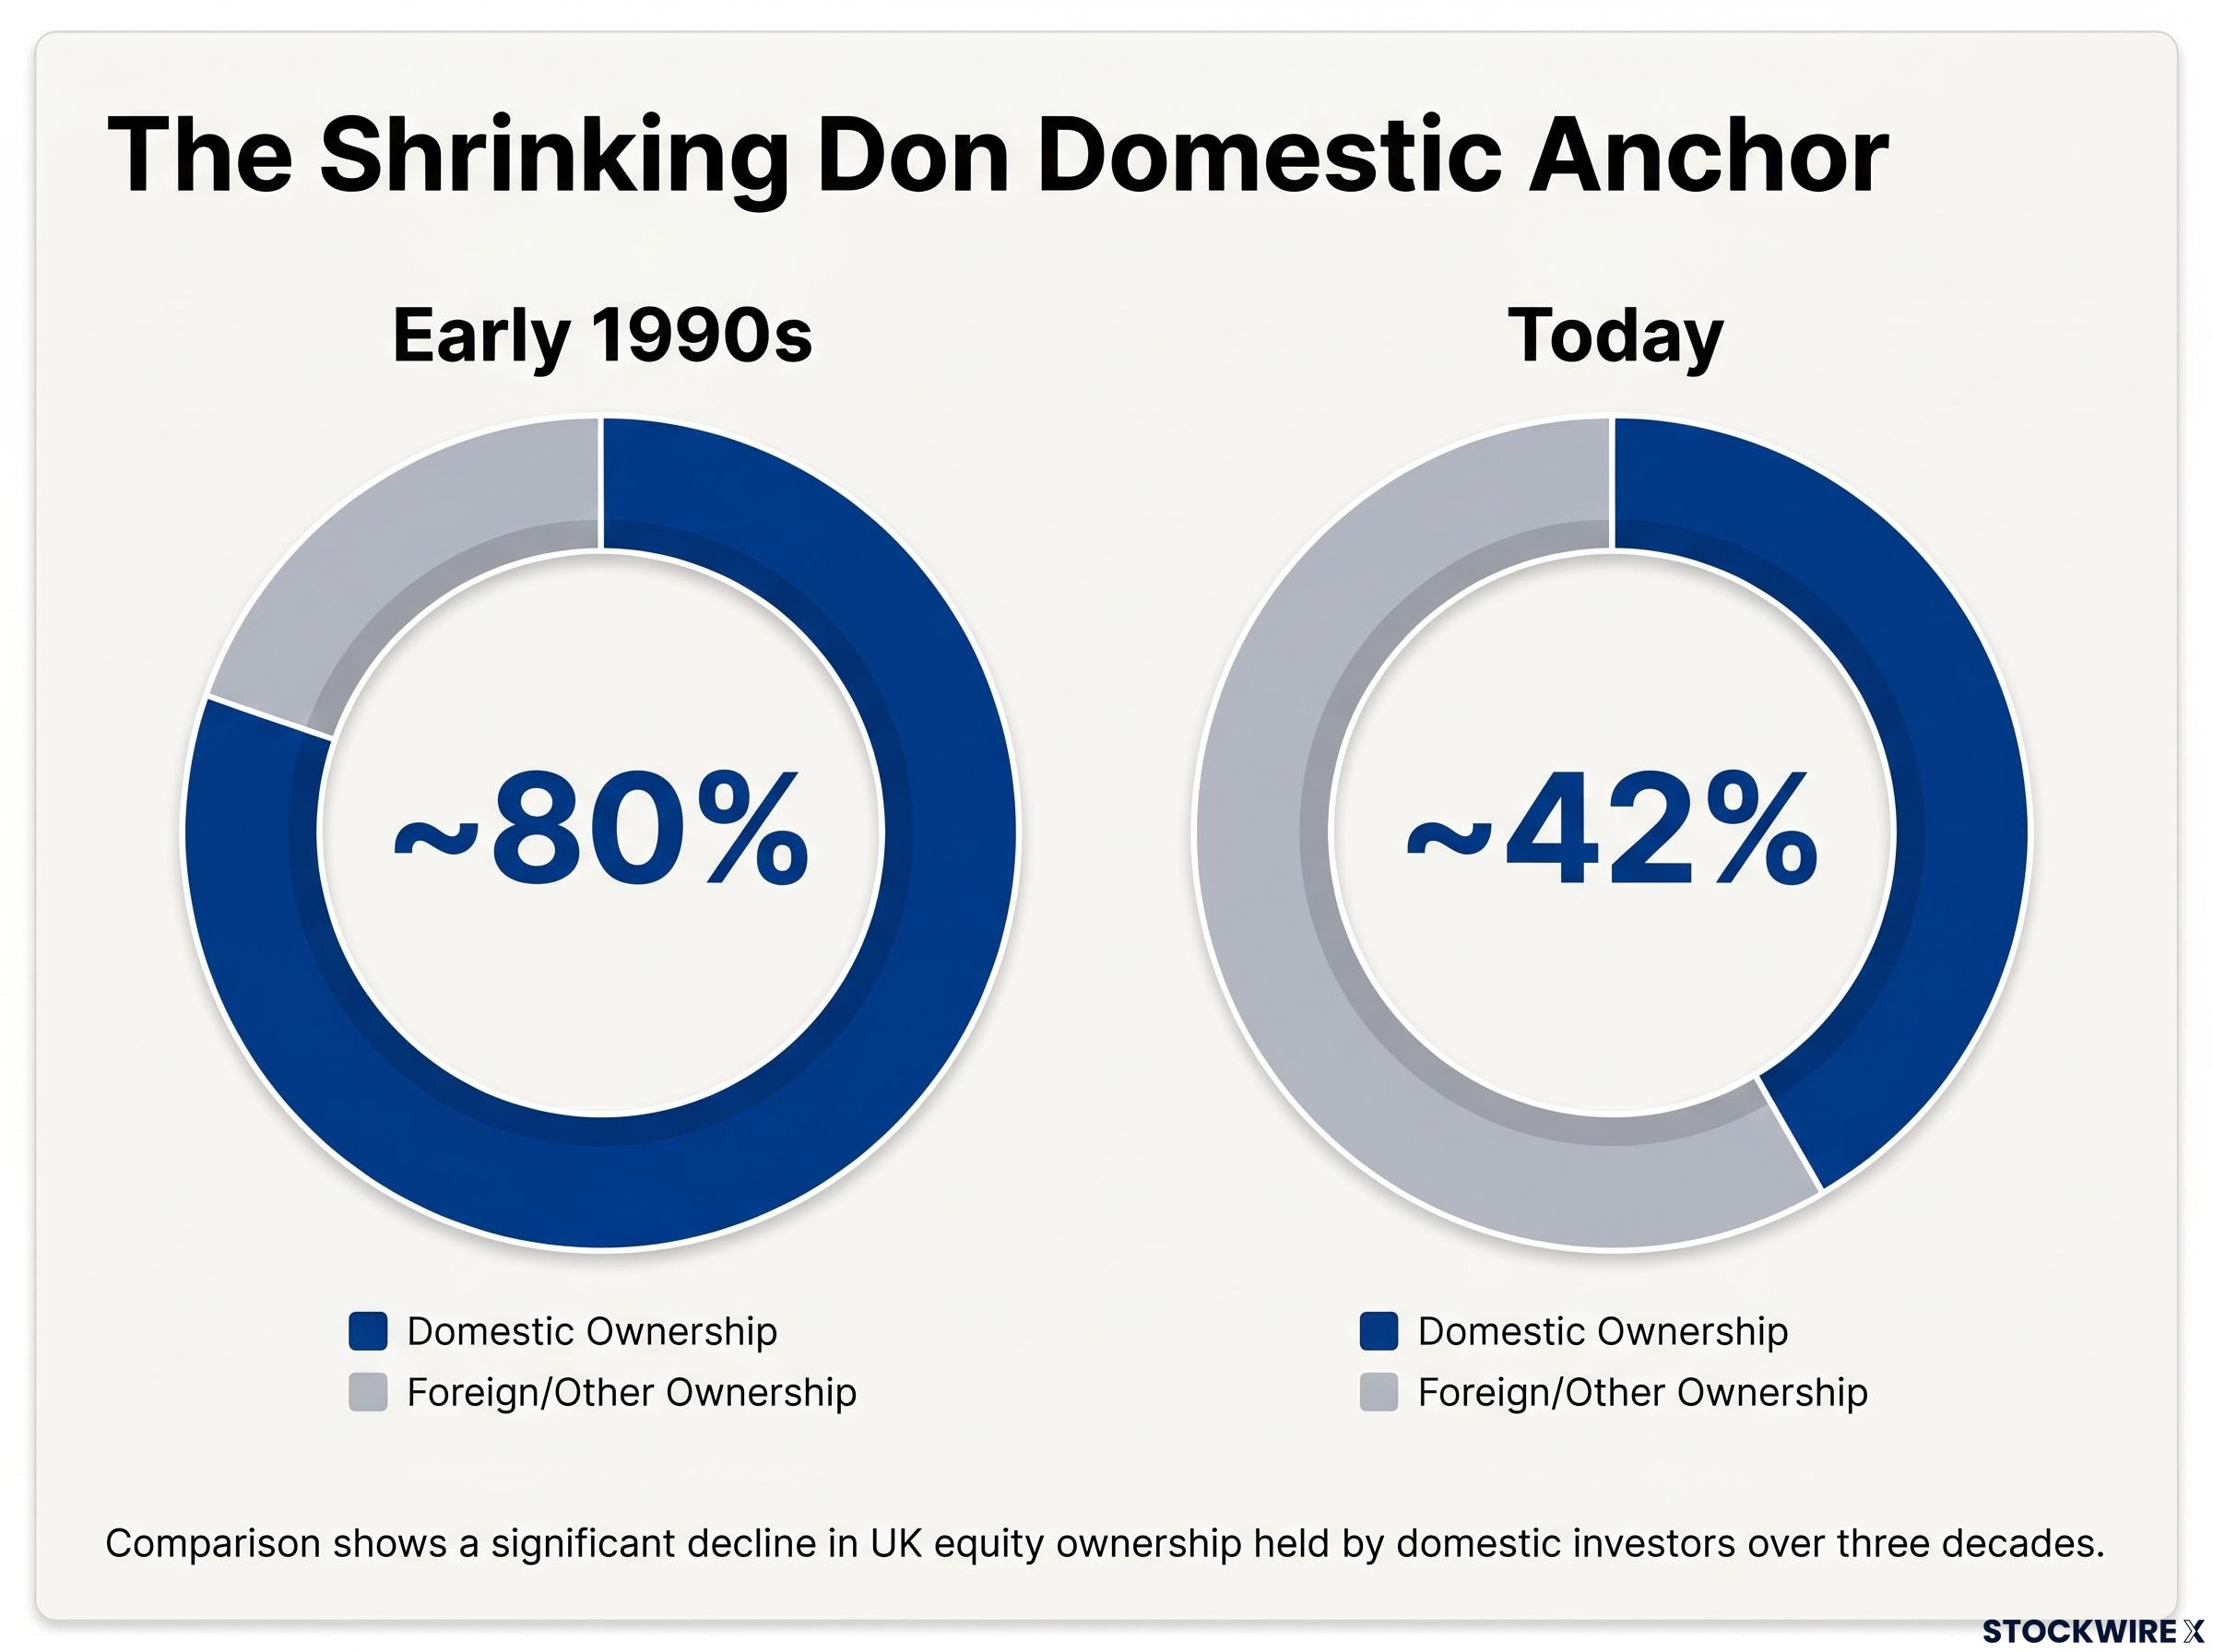
This happened gradually, driven by pension fund de-risking. As defined-benefit pension schemes matured, they shifted from equities into bonds and liability-matching assets. It was prudent fund management, but the cumulative effect was devastating for domestic equity demand.
Capital has moved in the opposite direction elsewhere: US and European Union markets have drawn sustained net inflows during the same period that UK equity funds have seen money flow out on a persistent basis. The Tony Blair Institute has documented chronically low levels of institutional investment in UK listed companies and a growing reliance on overseas investors. Individual UK investors have added to the pressure by directing savings toward cash products rather than stocks and shares.
The consequences cascade in a predictable sequence:
The fall from 80% to 42% means that when global sentiment toward the UK turns negative, there is no deep domestic investor base to absorb selling and stabilise valuations. UK equity drawdowns can overshoot fundamentals in ways that do not happen in markets with stronger home-country bias.
London recorded just 18 IPOs in 2024, according to Dealogic, EY, and PwC data. That is the lowest level in more than 30 years. A brief recovery in late 2025 dried up again in early 2026 amid renewed market volatility.
The forces driving the decline are multiple and mutually reinforcing:
Share repurchase programmes have further reduced the supply of listed equity. London has lost ground to Amsterdam, Paris, and New York as a listing venue, and the trend has accelerated.
Eighteen IPOs in a year means the London market is not just failing to attract new companies. It is failing to replace the ones leaving. That gradually shifts index composition further toward the old-economy sectors that already suppress growth credentials, compounding the de-rating problem from the previous section. For investors, a shrinking listed universe means declining index liquidity over time and fewer opportunities for active stock selection in domestic growth sectors.
The diagnosis is thorough. The prescription is harder.
Analyses by Barclays, the Tony Blair Institute, and policy institutions converge on three reform fronts, all of which would need to show progress simultaneously:
UK equities have shown what upside looks like. The post-2022 period, driven by value rotation and strong dividend income, delivered stretches of outperformance. The 30-35% P/E discount is real. But these rallies have been sentiment-driven, not structurally driven.
Four observable indicators would signal that structural progress is underway, before it shows up in index performance:
These are leading indicators. If they move, the re-rating thesis strengthens. If they do not, the discount persists for structural reasons.
This article is for informational purposes only and should not be considered financial advice. Investors should conduct their own research and consult with financial professionals before making investment decisions.
Brexit was a powerful accelerant of trends that were already deteriorating. Reversing them requires reform on multiple simultaneous fronts, none of which is quick and none of which is guaranteed.
The genuine value case exists. The 30-35% P/E discount is real. Value rotations work. A UK allocation is not irrational. But holding UK equities in hope of mean reversion is a fundamentally different thesis from holding them in anticipation of structural reform. The evidence currently supports the latter framing far more than the former.
Barclays strategists conclude that structural reforms targeting both listings activity and domestic investor participation are necessary to reverse the prevailing downward trend.
The 128% lag against MSCI World and the 3% global market cap share are where this story started. They are also where the honest assessment ends. The UK market is cheap for reasons that are real. The path to re-rating exists but requires political and structural follow-through that has historically been slow. The appropriate investor posture is watchful, monitoring the reform variables identified above, rather than committed to a binary call on UK equities.
For readers ready to act on a reduced UK weighting, our comprehensive walkthrough of European stock markets breaks down Switzerland, Spain, and Italy as three distinct portfolio tools, covering their sector compositions, liquidity profiles, and the specific roles each plays in a diversified international allocation that does not simply substitute one concentrated position for another.
Past performance does not guarantee future results. Financial projections are subject to market conditions and various risk factors.
Barclays strategists identify de-rating as the primary driver, alongside chronic capital outflows, a sector composition tilted toward financials, energy, and materials rather than technology, and the collapse of domestic institutional ownership from around 80% in the early 1990s to approximately 42% today.
MSCI UK has lagged MSCI World by roughly 128 percentage points since the 2016 referendum, underperformed the Euro Stoxx 50 by approximately 30%, and seen the UK's share of global market capitalisation fall to an all-time low of around 3%.
UK equities trade at a price-to-earnings discount of approximately 30-35% relative to US equities, reflecting structurally lower earnings growth expectations rather than a temporary sentiment overshoot, a conclusion reinforced by Bank of England analysis published in early 2025.
Barclays, the Tony Blair Institute, and policy institutions converge on three simultaneous reform requirements: improving London's listing venue competitiveness, rebuilding domestic long-term equity demand through pension and ISA reform, and establishing credible real-economy growth through higher productivity and clearer industrial policy.
Four leading indicators to watch are: growth companies adopting new dual-class listing rules and choosing London over New York, defined-contribution pension scheme equity allocations trending higher, a reversal in FDI or productivity data, and shifts in global allocator positioning toward overweight UK equity.