Oil does not always announce itself. There is no embargo headline, no tanker seizure splashed across the wires, no midnight strike on a refinery. And yet West Texas Intermediate (WTI), the benchmark grade that sets the tone for North American crude, has climbed into the mid-90s over the past several weeks through a slow, methodical ascent that most equity investors barely registered.
That quiet is the story. The physical oil market is genuinely tight, OPEC+ is holding millions of barrels off the table by design, and stock indices keep rising as though Middle East hostilities carry no premium at all.
This tension between constrained supply and market complacency is where the risk lives. Any credible crude oil price prediction now hinges less on demand growth and more on how little separates today’s price from the triple-digit threshold.
This analysis maps the exact conditions required for crude to break above $100, reads what the futures curve is signalling about the health of the physical market, and shows you where your portfolio is most exposed if a single geopolitical spark closes the remaining gap.
The mechanics driving WTI to the mid-90s
Start with what this rally is not. It is not a demand shock, and it is not runaway global growth pulling barrels off the market faster than they can be produced. The front-month NYMEX WTI contract closed at approximately $96.05 per barrel on 9 September 2026, according to Investing.com data, and it got there through supply management rather than a surge in consumption.
The architect of that floor is OPEC+, and the group has been deliberate about it. Roughly 3.24 million barrels per day of voluntary cuts remain in force, equivalent to about 3% of global demand. That is oil the world could be consuming but simply is not producing.
The cuts come in two distinct layers:
- A 2 million bpd group-wide reduction that stays in place through the end of 2026.
- A residual 1.24 million bpd, the remaining portion of a 1.65 million bpd cut from eight member nations. Those eight had started returning barrels in October 2025, releasing roughly 2.9 million bpd since April 2025, before pausing further increases.
The August 2026 OPEC+ production increase of 188,000 BPD formally closed the three-year voluntary cut cycle, yet compliance remains self-enforced with no formal sanctions, meaning the gap between announced quota and physical barrels reaching the market is the variable that actually determines how tight the supply balance remains.
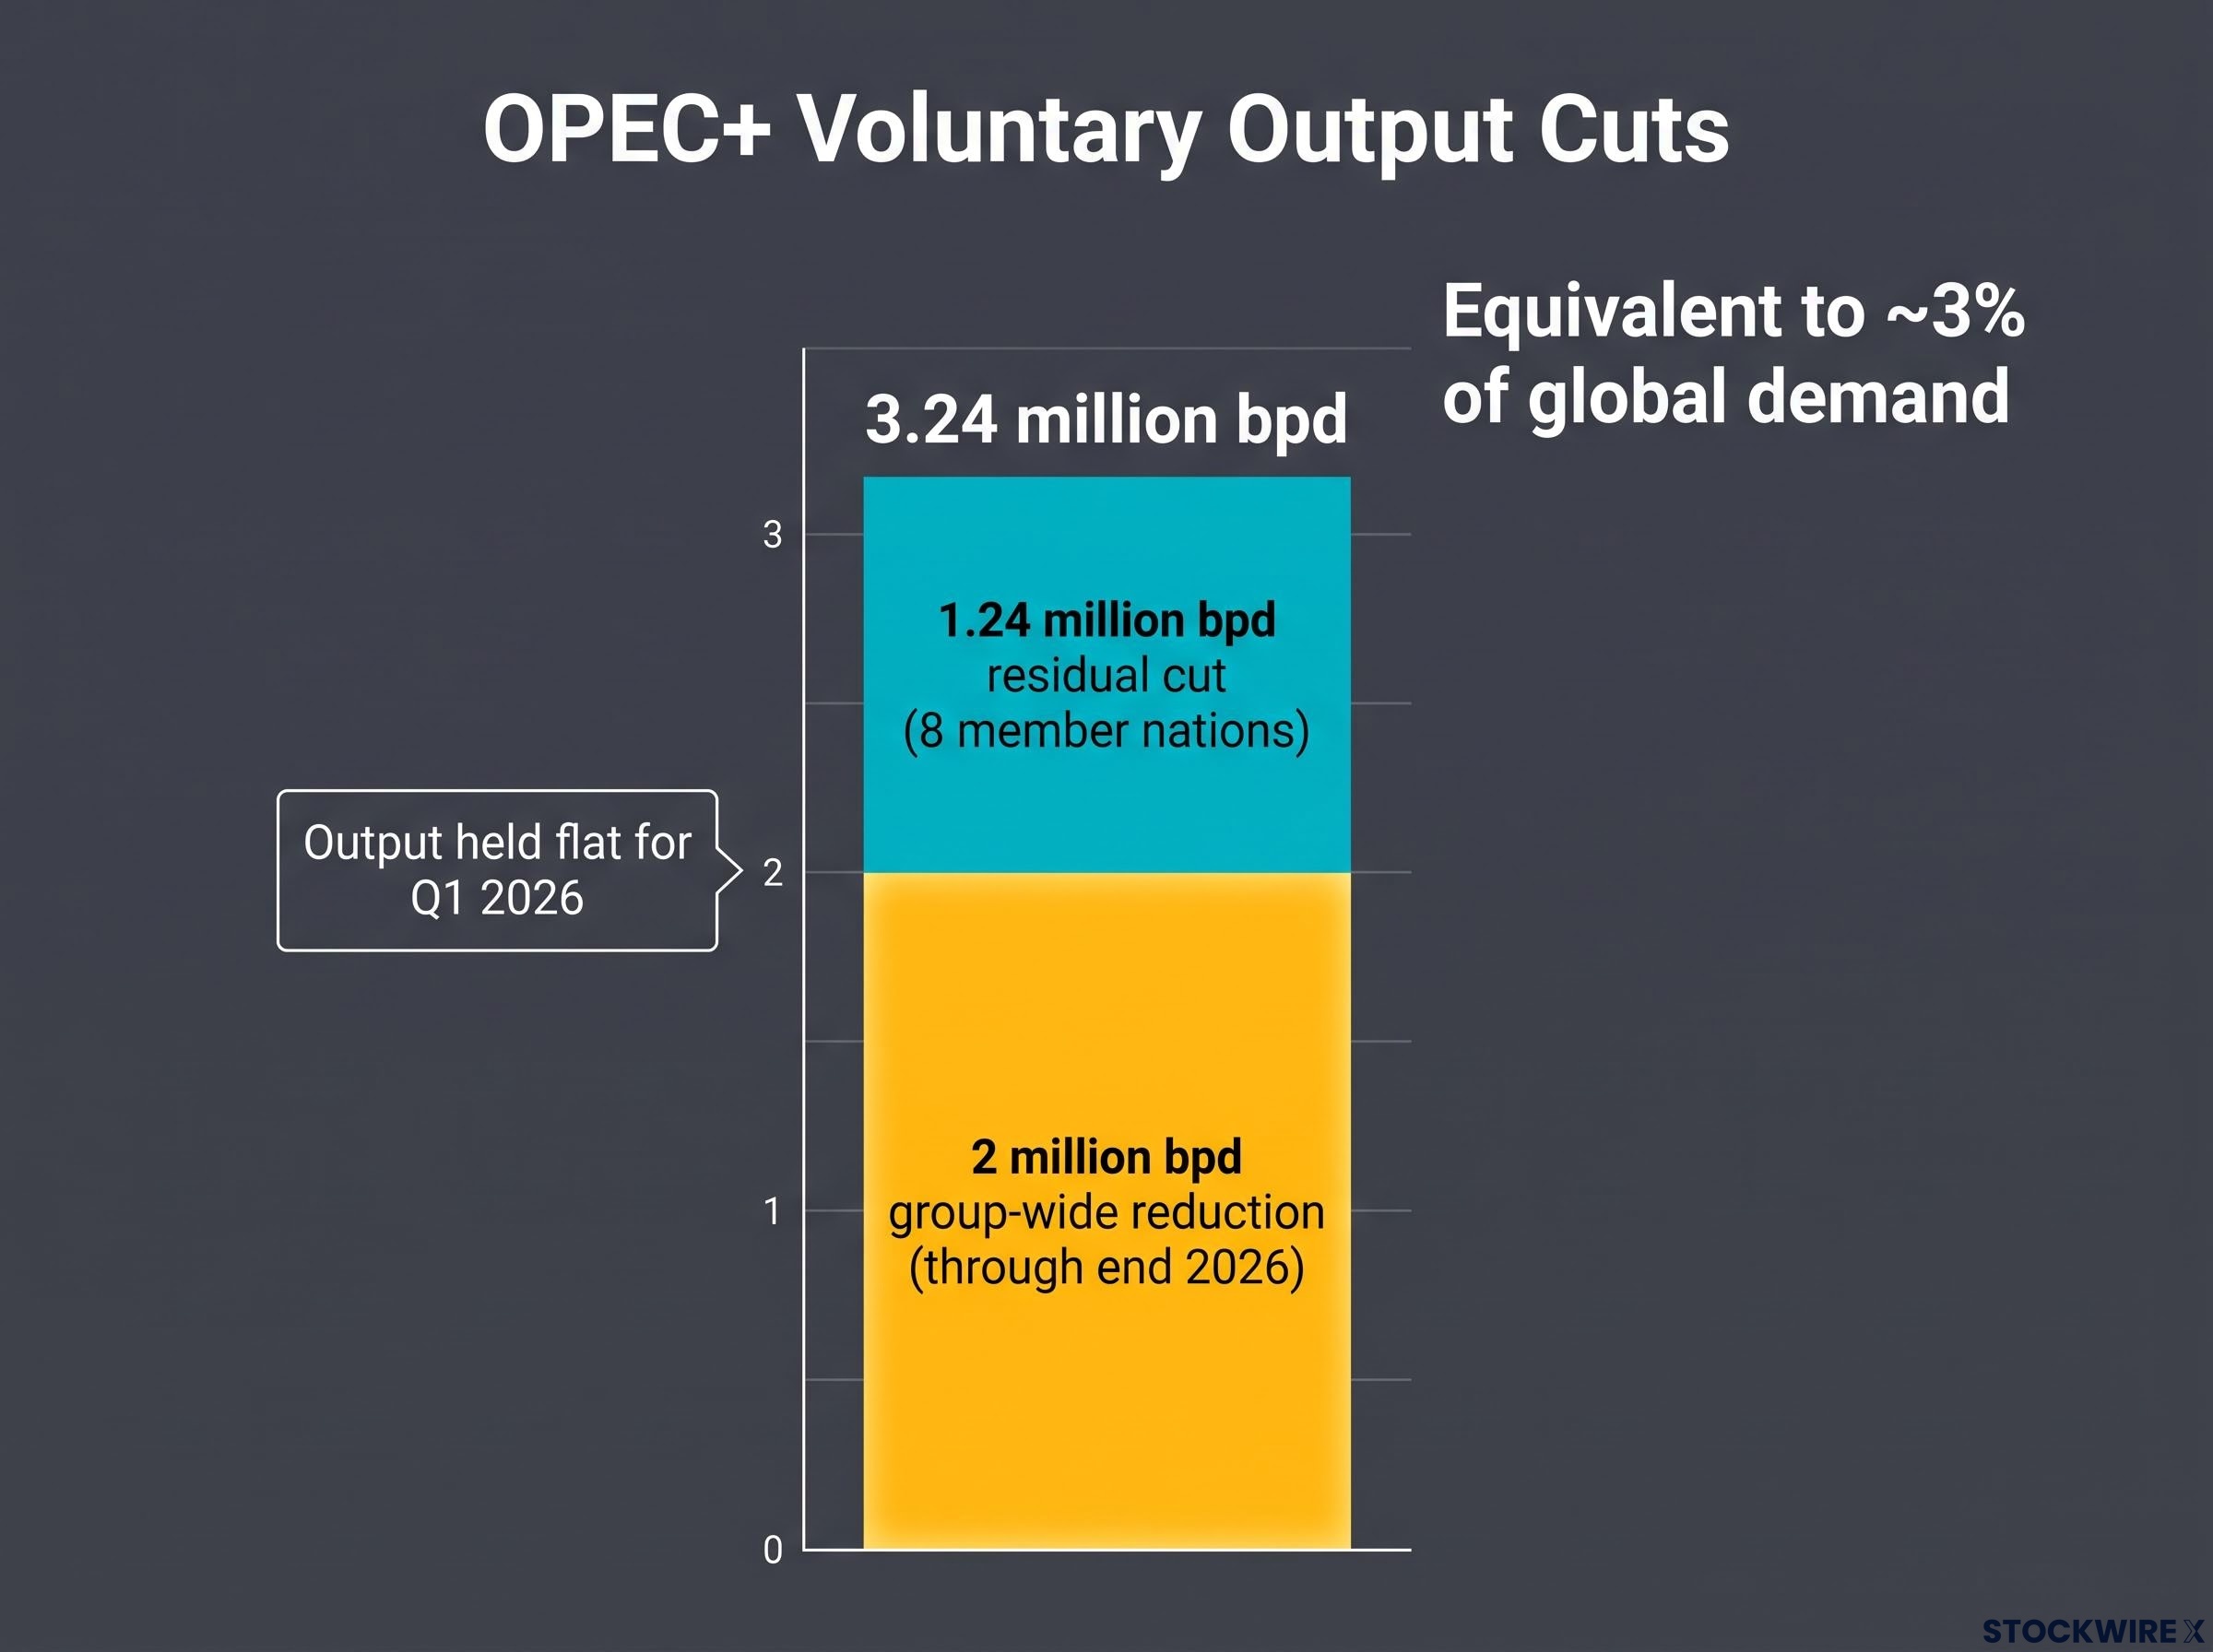
That pause is the tell. According to Reuters reporting from 30 November 2025, OPEC+ agreed to hold output flat for the first quarter of 2026, explicitly slowing its push to regain market share out of concern over a looming supply glut. The group cited a steady demand outlook while acting cautiously to avoid flooding the market.
Read that carefully, because it exposes a real tension. The cartel wants market share, but it fears oversupply more, and so it is choosing scarcity over volume. The price floor beneath WTI is therefore engineered, not earned by fundamentals.
For you, that distinction matters. Artificial supply constraints, not organic economic strength, are what make energy costs vulnerable to sudden upward shocks. When you look at energy names in your portfolio, the question is whether their valuations are pricing genuine demand-led growth or simply policy-driven scarcity that could evaporate the moment OPEC+ decides to open the taps.
When big ASX news breaks, our subscribers know first
Reading the futures curve and physical market signals
Pull up a trader’s screen and the clearest signal is not the headline price. It is the shape of the curve running out into next year, and right now that shape is telling you the physical market is strained.
The curve is in backwardation. Backwardation is a market structure where contracts for immediate delivery trade at a premium to contracts maturing further out. When near-term oil costs more than oil a year forward, it means buyers are paying up to get barrels in their hands today rather than waiting.
The numbers make the point. With the prompt contract near $96 in early September, the September 2026 contract (CLU26) was quoted at $87.83 on 20 August 2026, per Barchart data. That is a front-to-back spread of roughly $8 per barrel.
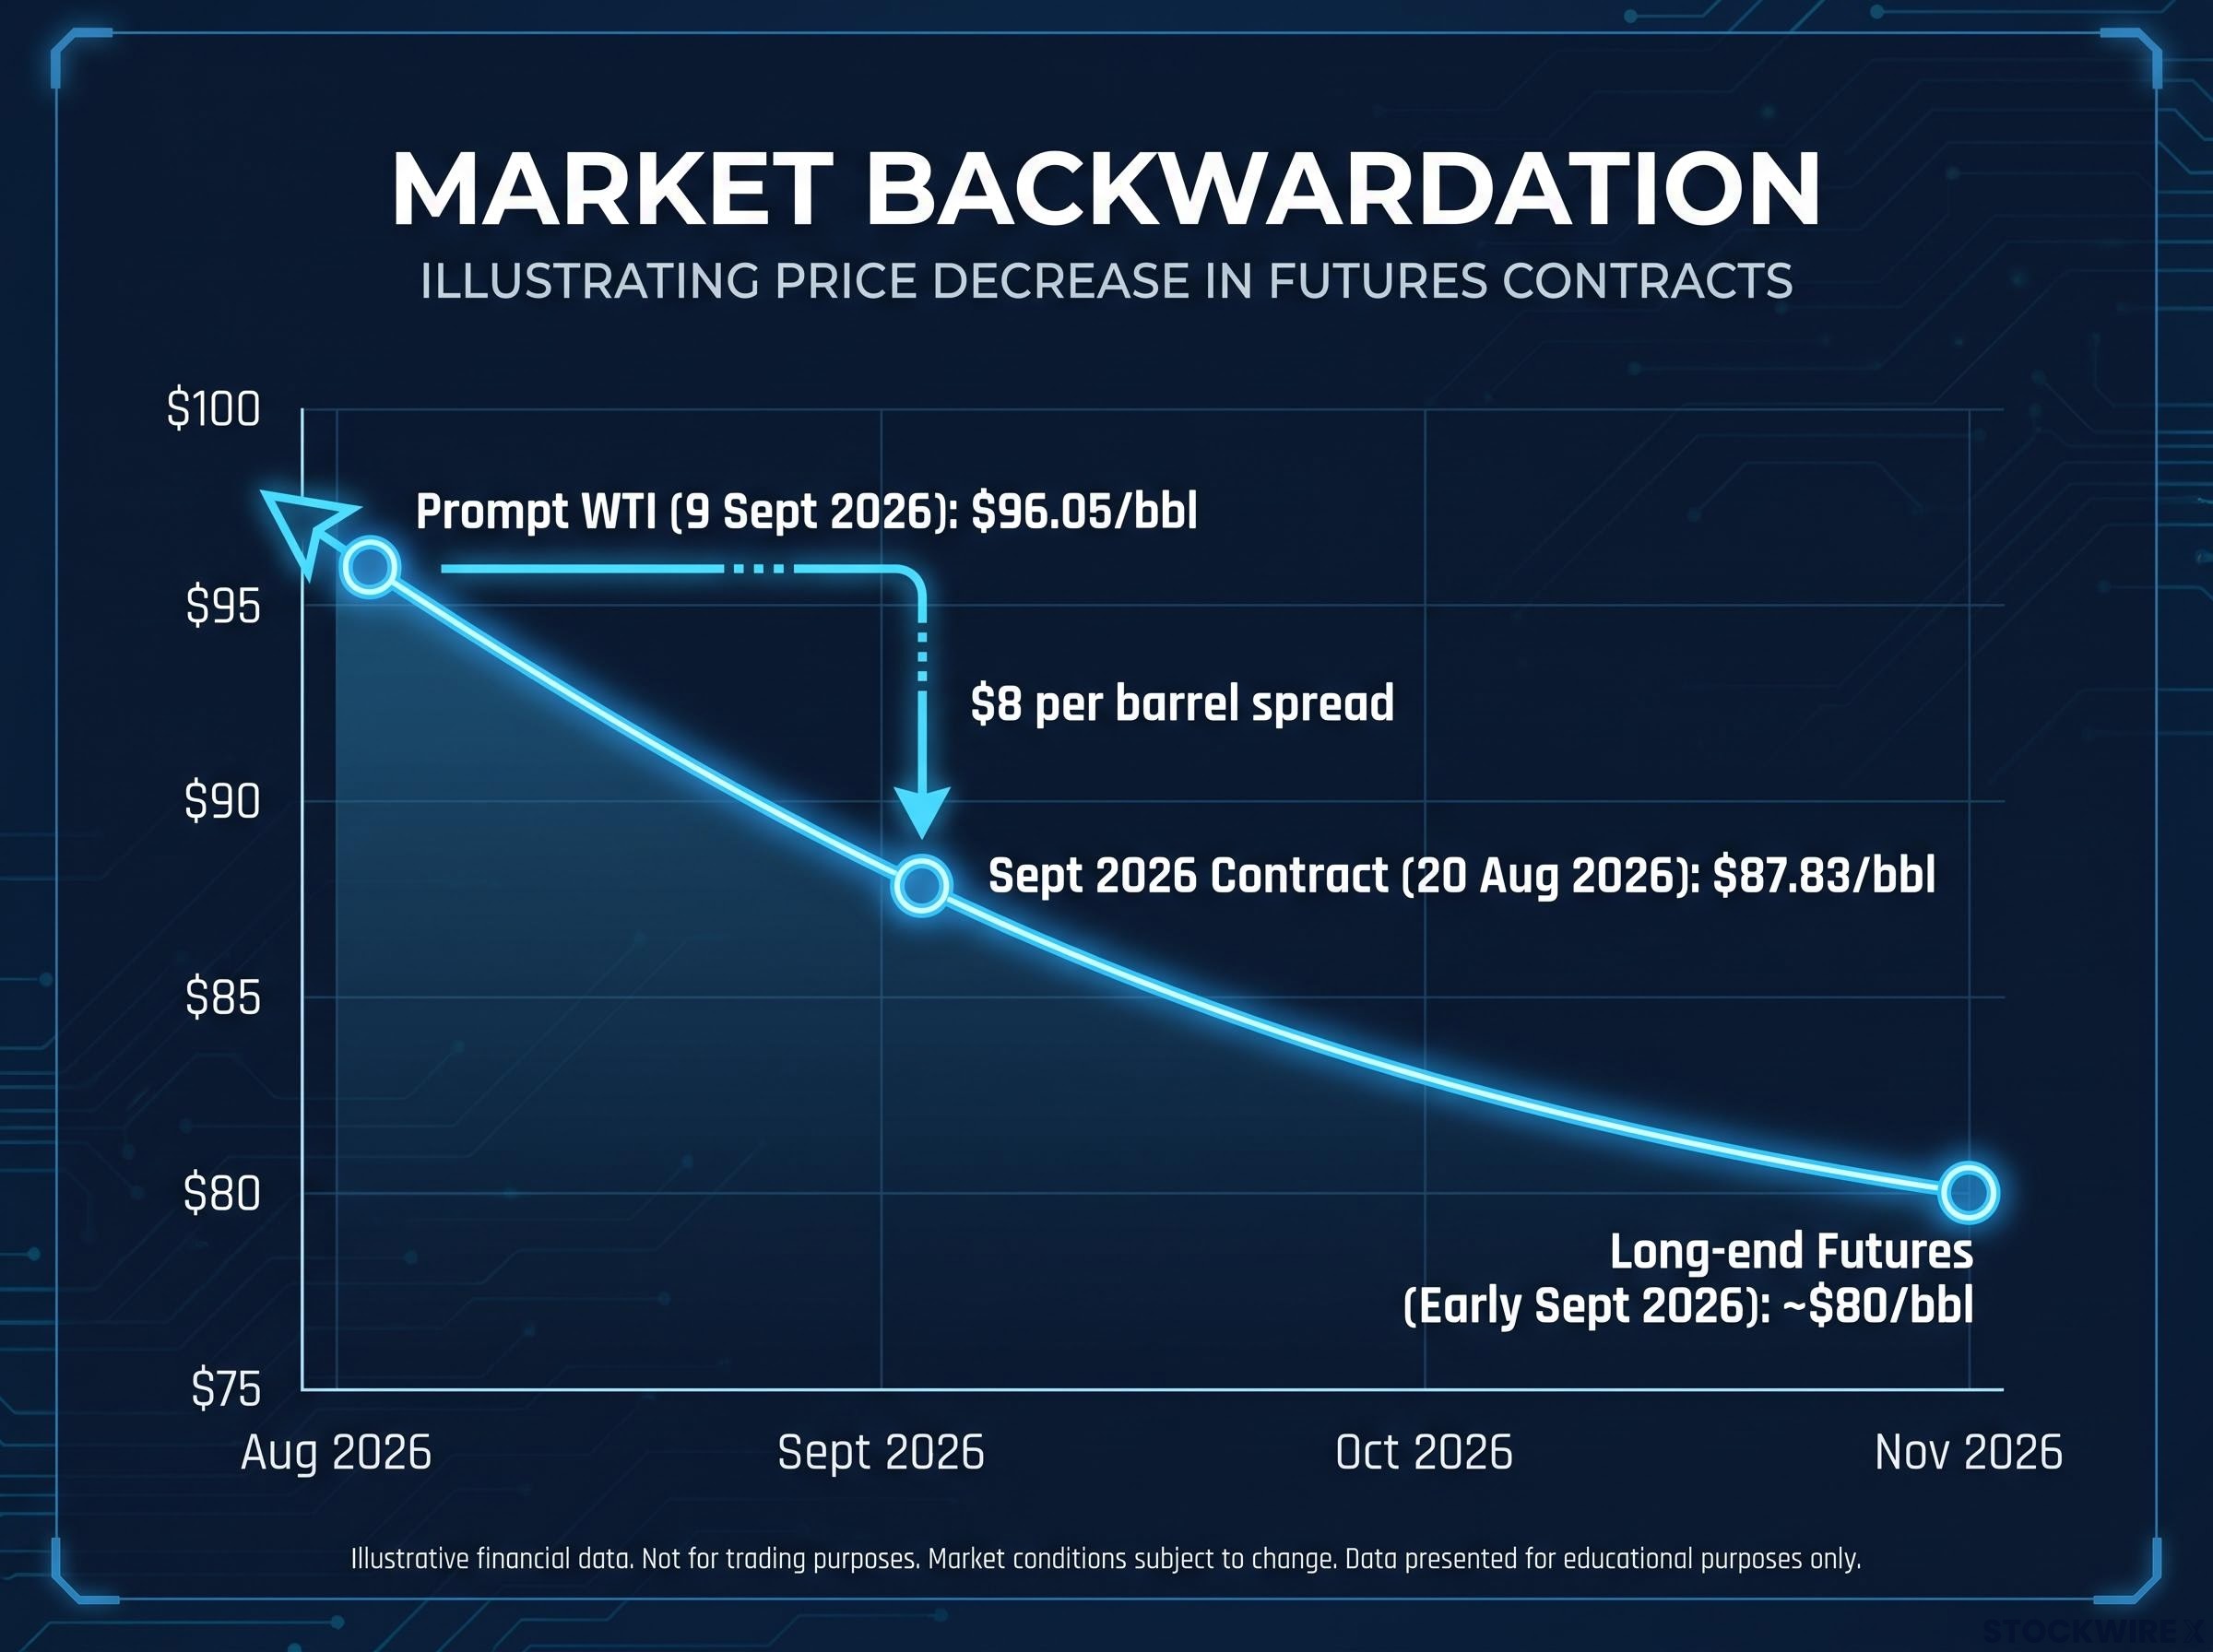
| Contract type | Observation date | Approximate price |
|---|---|---|
| Front-month WTI (prompt) | 9 September 2026 | $96.05/bbl |
| September 2026 contract (CLU26) | 20 August 2026 | $87.83/bbl |
| Long-end futures | Early September 2026 | ~$80/bbl |
Notice the long end. Those further-dated contracts have climbed toward $80 from the high $60s and low $70s just weeks earlier, so the whole curve is lifting even as the front end holds its premium. The market is repricing higher across every maturity, but it is repricing the present most aggressively of all.
Here is what that structure tells you. Institutional buyers are willing to pay a heavy premium to secure oil immediately, and that behaviour only makes sense when barrels are genuinely scarce at the point of delivery.
A backwardated curve is the physical market’s own confession. It cuts straight through the media noise about future supply gluts, because whatever traders fear about next year, their money says the tightness is real now. When you assess crude’s direction, this is the signal that separates measurable strain from speculative narrative.
Deeply backwardated Brent futures, confirmed in IEA July 2026 data, are signalling that the market is not pricing any near-term supply relief, and the simultaneous deterioration across supply, refinery throughput, and inventories recorded that month makes the case that demand destruction alone cannot close the structural gap.
Regional retail friction and the California disconnect
A barrel of crude is an abstraction until it reaches a fuel pump. That is where the wholesale story turns into something households feel, and the translation is far from even across the map.
The US national average for regular gasoline sat at $4.22 per gallon on 9 September 2026, according to AAA’s daily dashboard. Uncomfortable, but broadly stable. California tells a different story entirely.
| Fuel grade | US national average | California average |
|---|---|---|
| Regular gasoline | $4.22/gal | $5.88/gal |
| Premium gasoline | Not specified | $6.30/gal |
| Diesel | Not specified | $7.87/gal |
California regular averaged $5.88 per gallon in early September, with diesel approaching $7.87 per gallon, per AAA state data. That is a market where high fuel taxes and heavy regulation stack a permanent surcharge on top of the underlying crude cost.
Treat California as a leading indicator. It shows you the point of maximum consumer friction, the place where a global crude spike bites hardest and fastest. If WTI breaks into triple digits, the states already carrying regulatory premiums are where demand destruction and inflationary pressure will surface first.
For anyone holding retail or logistics exposure, this is not background colour. Mapping regional price disparities is how you forecast margin compression and softening consumer demand in specific corridors, because a national average masks exactly the local shocks that hit spending patterns.
The equity market paradox and geopolitical latency
Something does not add up. Crude is grinding higher, the Middle East remains volatile, and global stock indices keep climbing as if none of it registers on the risk radar.
That complacency is the paradox worth sitting with. Equity markets are currently pricing Middle East geopolitics as a non-event, which works right up until the moment it does not.
History suggests the repricing can be violent. The original market commentary points to a 1987 Iranian oil rig strike as a reference case, an episode whose single-session equity damage scales to something staggering by today’s index levels.
A 1987 Iranian oil rig strike contributed to a one-day Dow Jones Industrial Average decline that, scaled to the modern index, would equate to a drop of roughly 12,000 points.
Sit with that figure. It is a reminder that oil-driven geopolitical shocks have historically moved equities with a speed and severity that current pricing does not appear to contemplate.
The uncomfortable implication for you is direct. If your portfolio is benefiting from a market that has decided Middle East risk is irrelevant, then you are carrying exposure to a sudden, sharp repricing should hostilities disrupt physical infrastructure. The question is whether the risk premium you are being paid today adequately compensates you for that possibility.
Geopolitical risk investing frameworks built around single-shock scenarios consistently underestimate transmission speed, as the May 2026 Hormuz episode demonstrated when ECB rate hike signals, Asian equity selloffs, and stagflationary demand data arrived simultaneously rather than sequentially.
The catalyst required for triple digits
The gap to $100 is narrow. From its mid-90s base, WTI needs a move of only $4 to $7 per barrel to cross the threshold, which is well within a single session’s range on a meaningful headline.
That is what makes the current floor fragile. A price built on OPEC+ discipline holds only so long as discipline holds, and it leaves the market thin on spare buffer if physical supply is interrupted.
The final push, then, is far more likely to come from a supply disruption than from organic demand growth. Demand has been a slow, steady tailwind; a geopolitical event affecting production or transit infrastructure is the kind of catalyst that closes a $4 to $7 gap in hours, not months.
Assessing portfolio resilience in a tighter energy regime
Two forces now define the crude picture, and they pull in opposite directions. A physical market held tight by deliberate OPEC+ supply management sits alongside a latent geopolitical risk that equities have chosen to ignore, and that combination leaves prices coiled rather than settled.
The pivot point to watch is the end of the Q1 2026 output pause. Whether OPEC+ extends its restraint or begins returning barrels will reset the supply-demand balance heading into the fourth quarter, and that single decision could either reinforce the floor or crack it.
Frame your exposure around both tails. Upstream energy producers benefit from an engineered price floor but carry the risk of policy reversal, while inflation-sensitive consumer stocks, particularly those exposed to high-friction regions like California, sit most vulnerable to a spike. Weigh whether each position is pricing scarcity that is durable or scarcity that is merely on loan from OPEC+.
For investors wanting to translate the supply-constraint thesis into specific equity positioning, our dedicated guide to energy stocks as an inflation hedge covers the free cash flow upgrades building in upstream producers, the NBER empirical evidence on energy sector returns during inflation shocks, and the indirect transmission lag into logistics and consumer stocks.
This article is for informational purposes only and should not be considered financial advice. Investors should conduct their own research and consult with financial professionals before making investment decisions. Past performance does not guarantee future results, and financial projections are subject to market conditions and various risk factors.