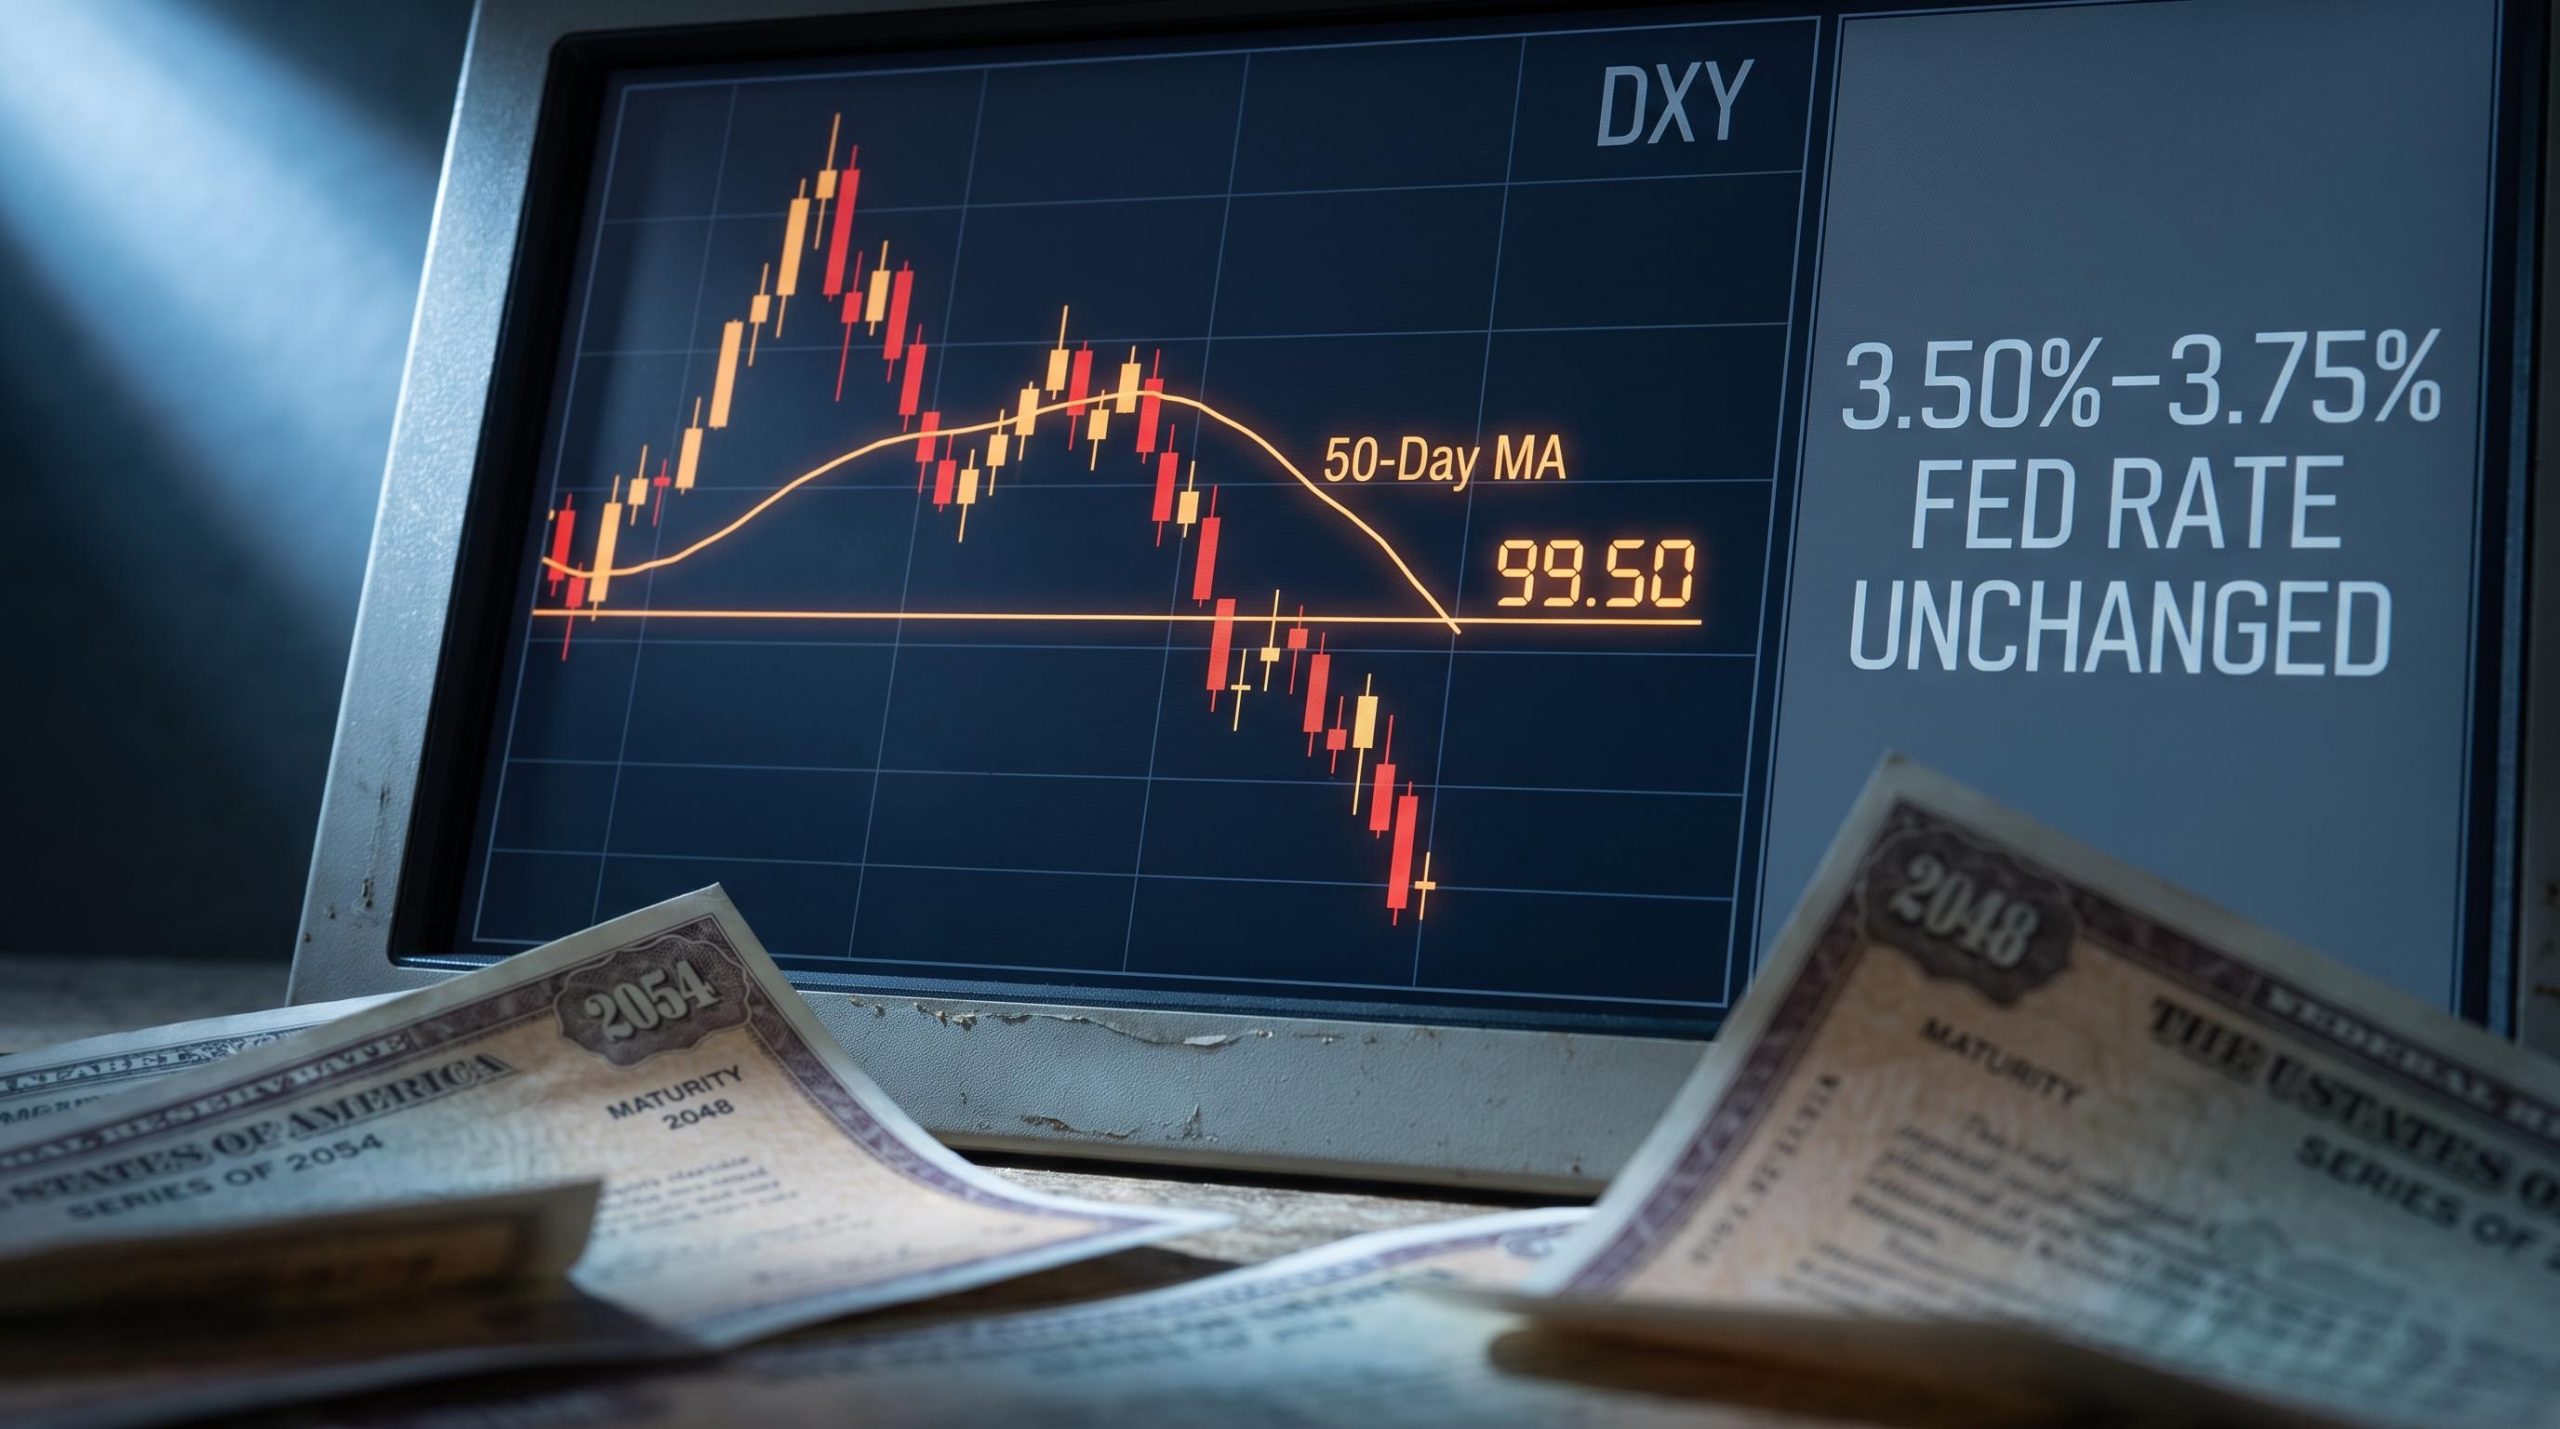
Long-end Treasury yields fell and the Dollar Index broke below its 200-day EMA in the same session. Under conventional rate-differential logic, those two moves should not have happened together. When US yields drop, the dollar’s yield advantage narrows, and capital flows should weaken the currency. The dollar did weaken, but not for the reason the standard model predicts.
The Federal Reserve has not moved. The policy rate sits at 3.50%-3.75%, and the Fed’s asset holdings are unchanged. The force reshaping dollar liquidity right now sits at the Treasury Department, where a quietly expanded bond buyback programme has been running since 9 September. This is a story about what moves the dollar when the Fed is on hold.
Here is the transmission chain the standard rate-differential model misses: the Treasury General Account (TGA) drawdown, the near-zero Reverse Repo (RRP) facility, and the maturity-shortening effect, three mechanisms that together explain why financial conditions are shifting without a single basis point of Fed action.
What the Treasury’s buyback expansion actually does
The Treasury operates two types of buyback operations:
- Liquidity support buybacks: These target off-the-run longer-dated nominal coupon Treasuries (bonds that are no longer the most recently issued at a given maturity) to improve secondary-market functioning after periods of volatile yields and market stress.
- Cash management buybacks: These adjust the profile of bill issuance and the TGA cash balance, reducing volatility in the TGA over time rather than simply draining a one-off surplus.
On 9 September, the Treasury doubled the per-operation ceiling on liquidity support buybacks from $2 billion to at least $4 billion, effective through 4 November. The stated purpose was to support liquidity in longer-dated nominal coupon Treasuries following a period of volatile yields. The overall Treasury market exceeds $32 trillion, which means the programme is small relative to the total stock of debt. But the mechanism through which it operates matters more than the headline scale.
The TGA drawdown and reserve injection
The TGA is the Treasury’s operating account at the Federal Reserve. When the Treasury spends from it, whether on buybacks or anything else, the Fed’s liability to the Treasury (the TGA balance) falls and its liabilities to commercial banks (reserves) rise. That is a reserve injection into the banking system, and it originates from the fiscal side without requiring any Fed action.
The TGA currently holds approximately $950 billion, compared to the $550-$600 billion working balance maintained under the prior administration. That surplus above operational requirements is the load-bearing assumption of the entire liquidity thesis. If buybacks draw from that surplus rather than being offset by new bill issuance, the reserve injection is real and net positive.
The funding source caveat matters here. If buybacks are funded by new bill issuance rather than a TGA surplus drawdown, the net reserve effect is two-sided: auctions drain reserves while buybacks inject them. The net impact depends on the full cash path, and could be neutral. The strongest version of this thesis relies on the TGA being drawn down, not recycled through new issuance.
Why shorter maturity means more dollar liquidity
When the Treasury buys back longer-dated bonds and refinances at the front of the curve, the weighted average maturity of the overall debt stock contracts. An increasing share of outstanding debt therefore reprices in line with the policy rate, and short-term Treasury bills function as near-cash substitutes for money market funds and in repo markets. They are high-quality collateral, they roll rapidly, and they reprice alongside short-term rates.
Expanding the supply of these money-like instruments is a form of fiscal-side easing through safe-asset supply, distinct from anything the Fed does through its rate channel. It increases the quantity of dollars circulating in the financial system without altering the official policy rate.
When big ASX news breaks, our subscribers know first
How the drained RRP facility amplifies the effect
The overnight Reverse Repo (RRP) facility is a standing option where money market funds can park cash at the Fed overnight. At its peak, it absorbed over $2 trillion, buffering the system from swings in reserves and bill supply. When the TGA moved or bill issuance shifted, much of the resulting liquidity simply recycled into the RRP rather than flowing through to bank reserves and private funding markets.
That buffer is now functionally gone. Money market funds shifted to higher-yielding bills and private repo as relative yields changed, and RRP usage has collapsed to near zero. The facility still exists; the mechanism has not disappeared. But when usage sits near zero because of yield incentives, new liquidity injections from buybacks express more directly in bank reserves and private funding conditions rather than being absorbed by the RRP.
Precision note: The RRP facility is low, not eliminated. Its near-zero usage reflects yield incentives and collateral preferences, not the disappearance of the mechanism itself.
This is why a programme that looks modest relative to the $32 trillion Treasury market can still influence dollar conditions. The amplification is environmental, not intrinsic to the buyback scale. The same operation conducted in 2022, when over $2 trillion sat in the RRP, would have had a far more muted effect on bank reserves and funding conditions.
Reserve drain mechanisms operating outside conventional monetary policy are not unique to the Treasury’s buyback channel: Deutsche Bank projects that intraday tokenized repo markets could eliminate approximately $250 billion in precautionary reserve balances currently parked at the Federal Reserve, a structural shift that would alter the same funding conditions the buyback analysis depends on.
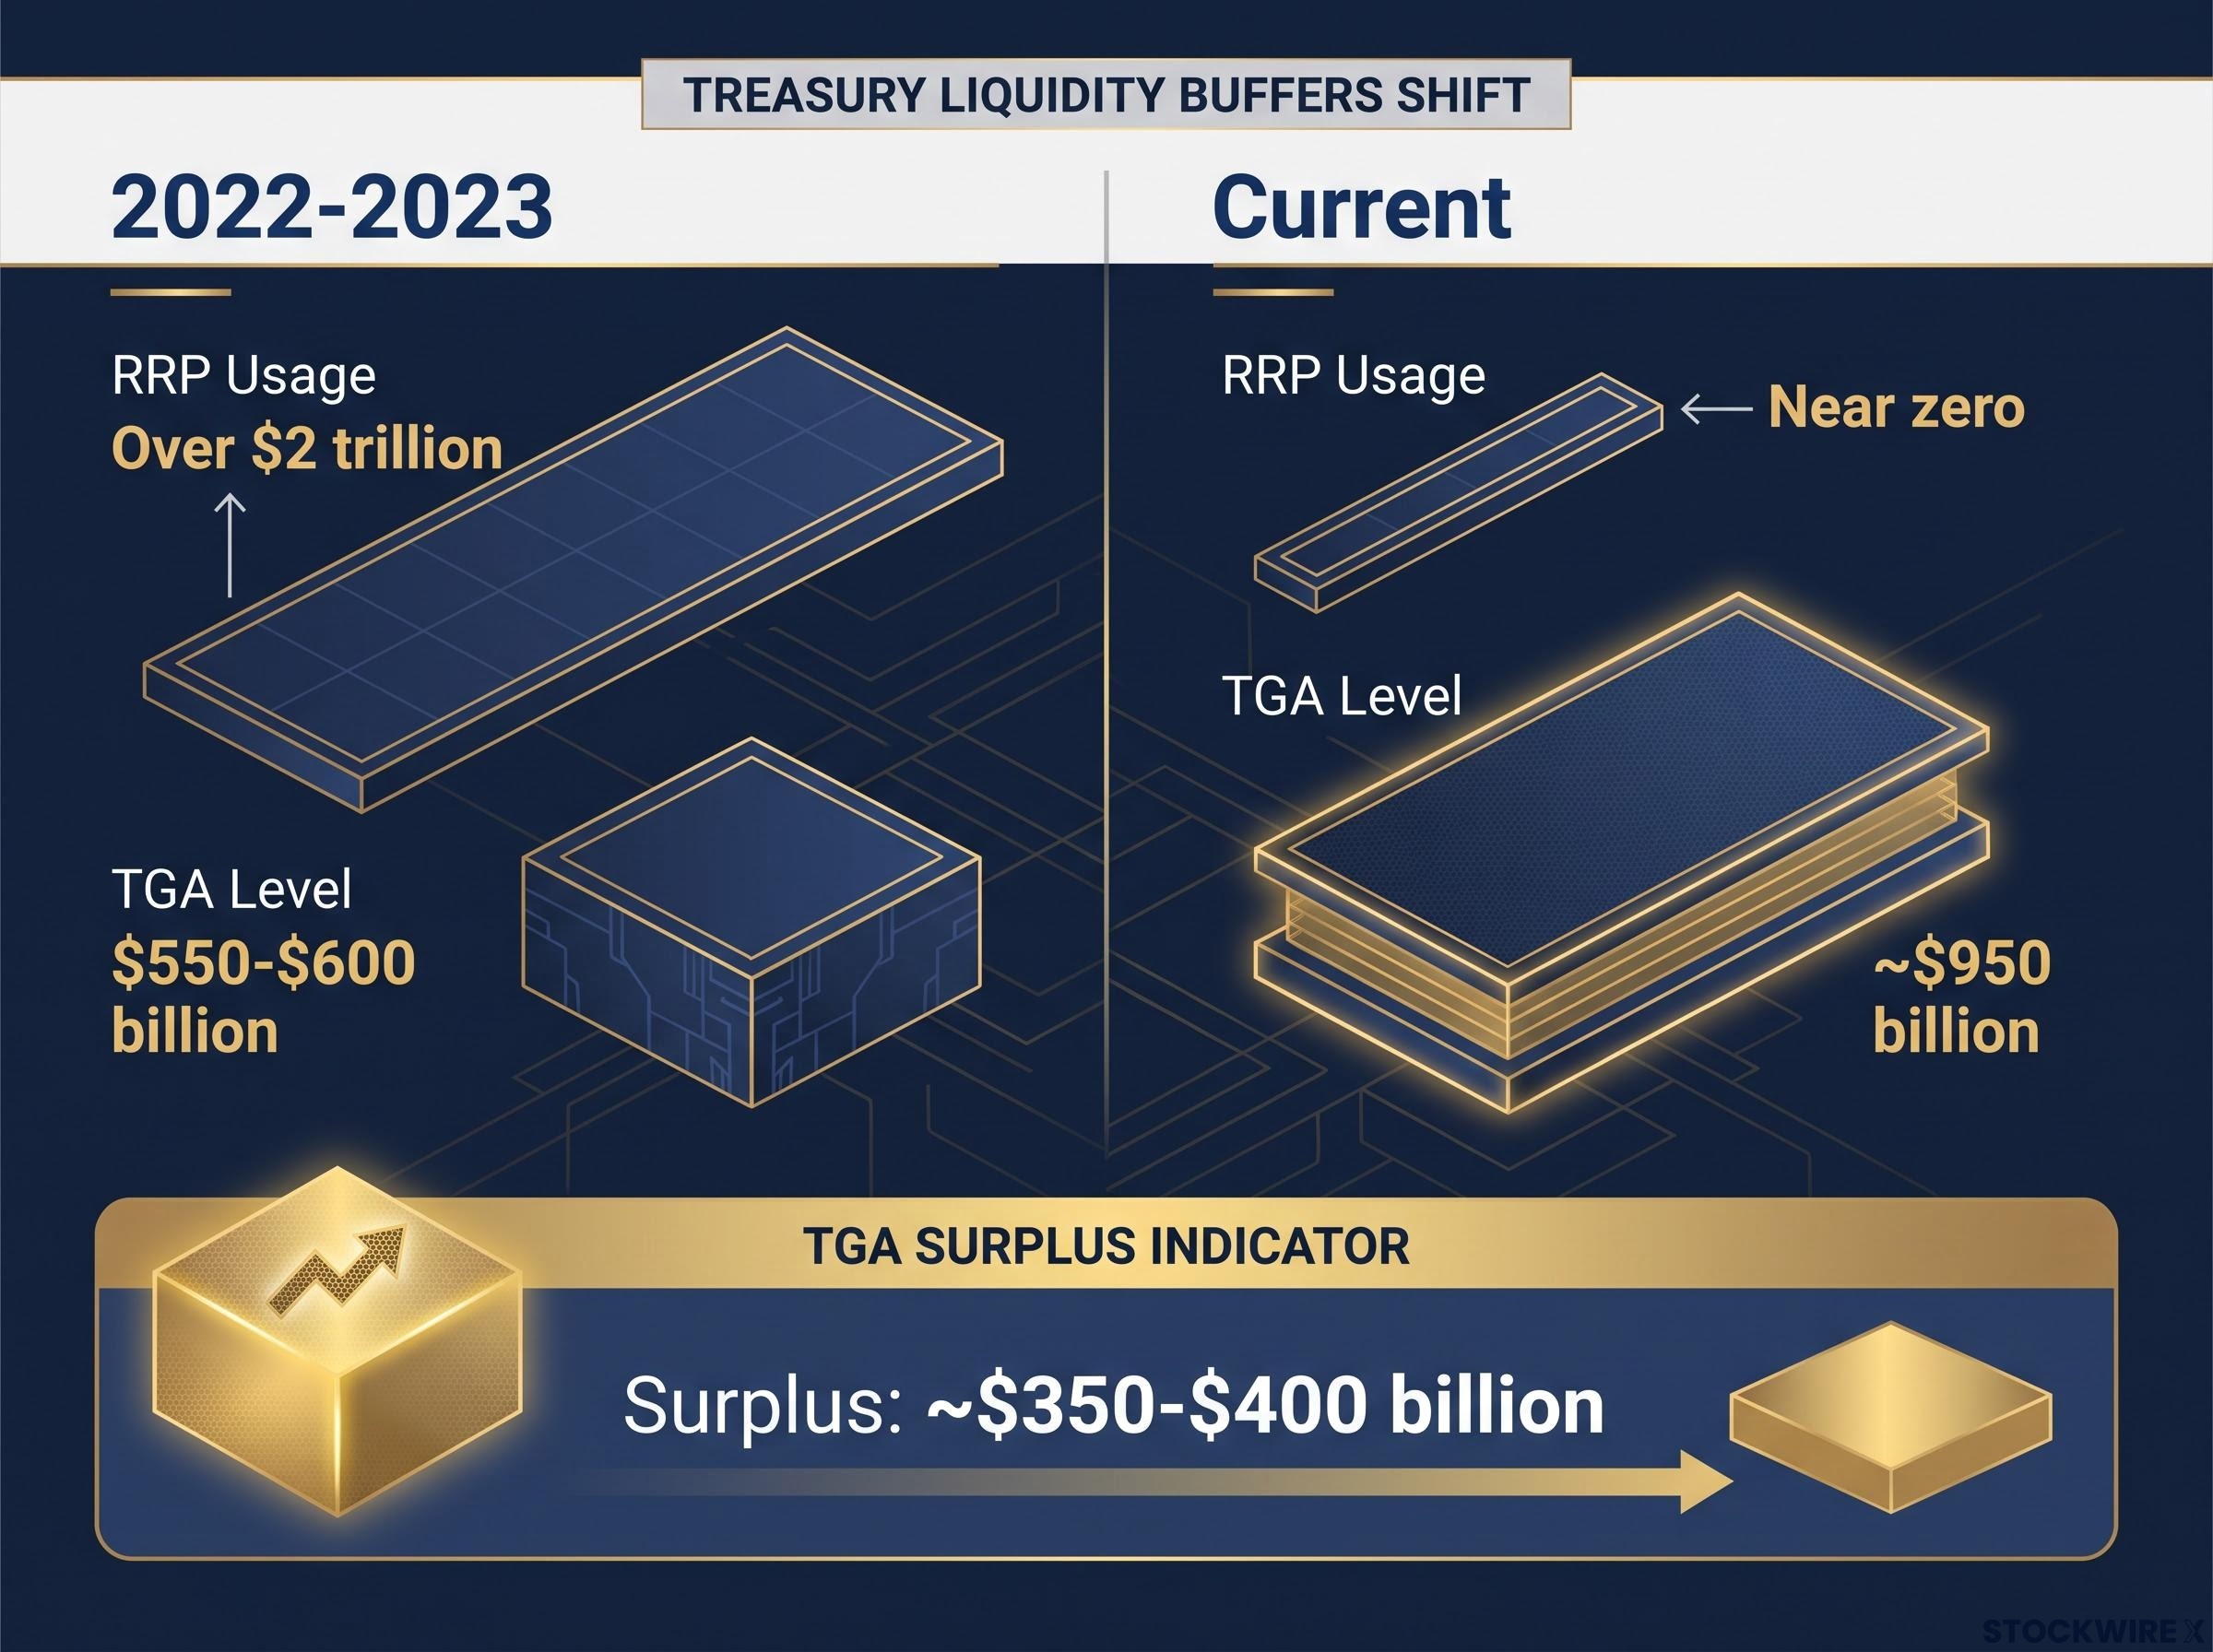
| Period | RRP Usage (Approx.) | TGA Level (Approx.) | Net Transmission Effect |
|---|---|---|---|
| 2022-2023 (peak RRP) | Over $2 trillion | $550-$600 billion | Liquidity recycled into RRP; muted reserve impact |
| Current (near-zero RRP) | Near zero | ~$950 billion | Liquidity flows directly to bank reserves; amplified impact |
The yield-dollar divergence and why rate-differential logic breaks down here
The yield moves came fast. When the buyback upsizing was announced, the 10-year note fell approximately 5-6 basis points and the 30-year fell approximately 9 basis points. During a separate recent session, the 10-year yield dropped by over three basis points to 4.70%, with the 30-year giving up more than four basis points to close around 5.23%.
Under the standard rate-differential framework, that sequence should weaken the dollar. Lower US yields reduce the return on dollar-denominated assets, narrowing the yield advantage that attracts foreign capital. When yield declines reflect reduced investor demand for Treasuries, that logic holds cleanly. The dollar weakens because investors are choosing to go elsewhere.
But when yields fall because a government entity is purchasing bonds, the interpretation is different. The move in yields reflects the mechanics of bond pricing under official buying pressure, rather than any deterioration in investor appetite for dollar assets. Price discovery is being led by the sovereign buyer, not by the market.
Bond price mechanics determine why official buying pressure compresses yields independently of investor demand: because coupon payments are fixed, any sovereign buyer willing to pay above the prevailing market price automatically drives the yield lower, regardless of whether private investors would have accepted that price.
When a government entity rather than the market is the force moving bond prices, the yield signal carries a different informational content for currency traders. Rate-differential models built on investor-driven yield movements can systematically misread sessions where Treasury buybacks are the primary force.
The two scenarios produce opposite readings:
- Yield falls driven by reduced investor demand: Conventional dollar-weakness prediction holds. Investors are reallocating away from dollar assets.
- Yield falls driven by government purchase: Bond pricing mechanics dominate. The yield decline does not signal reduced demand for dollar assets, and dollar behaviour diverges from the standard model.
The Dollar Index broke below its 200-day EMA during the sessions when the expanded ceiling was announced and has remained below that level since. If you trade or position around rate-differential models, this distinction matters before the next buyback operation cycle.
What the DXY technical structure confirms and what it leaves open
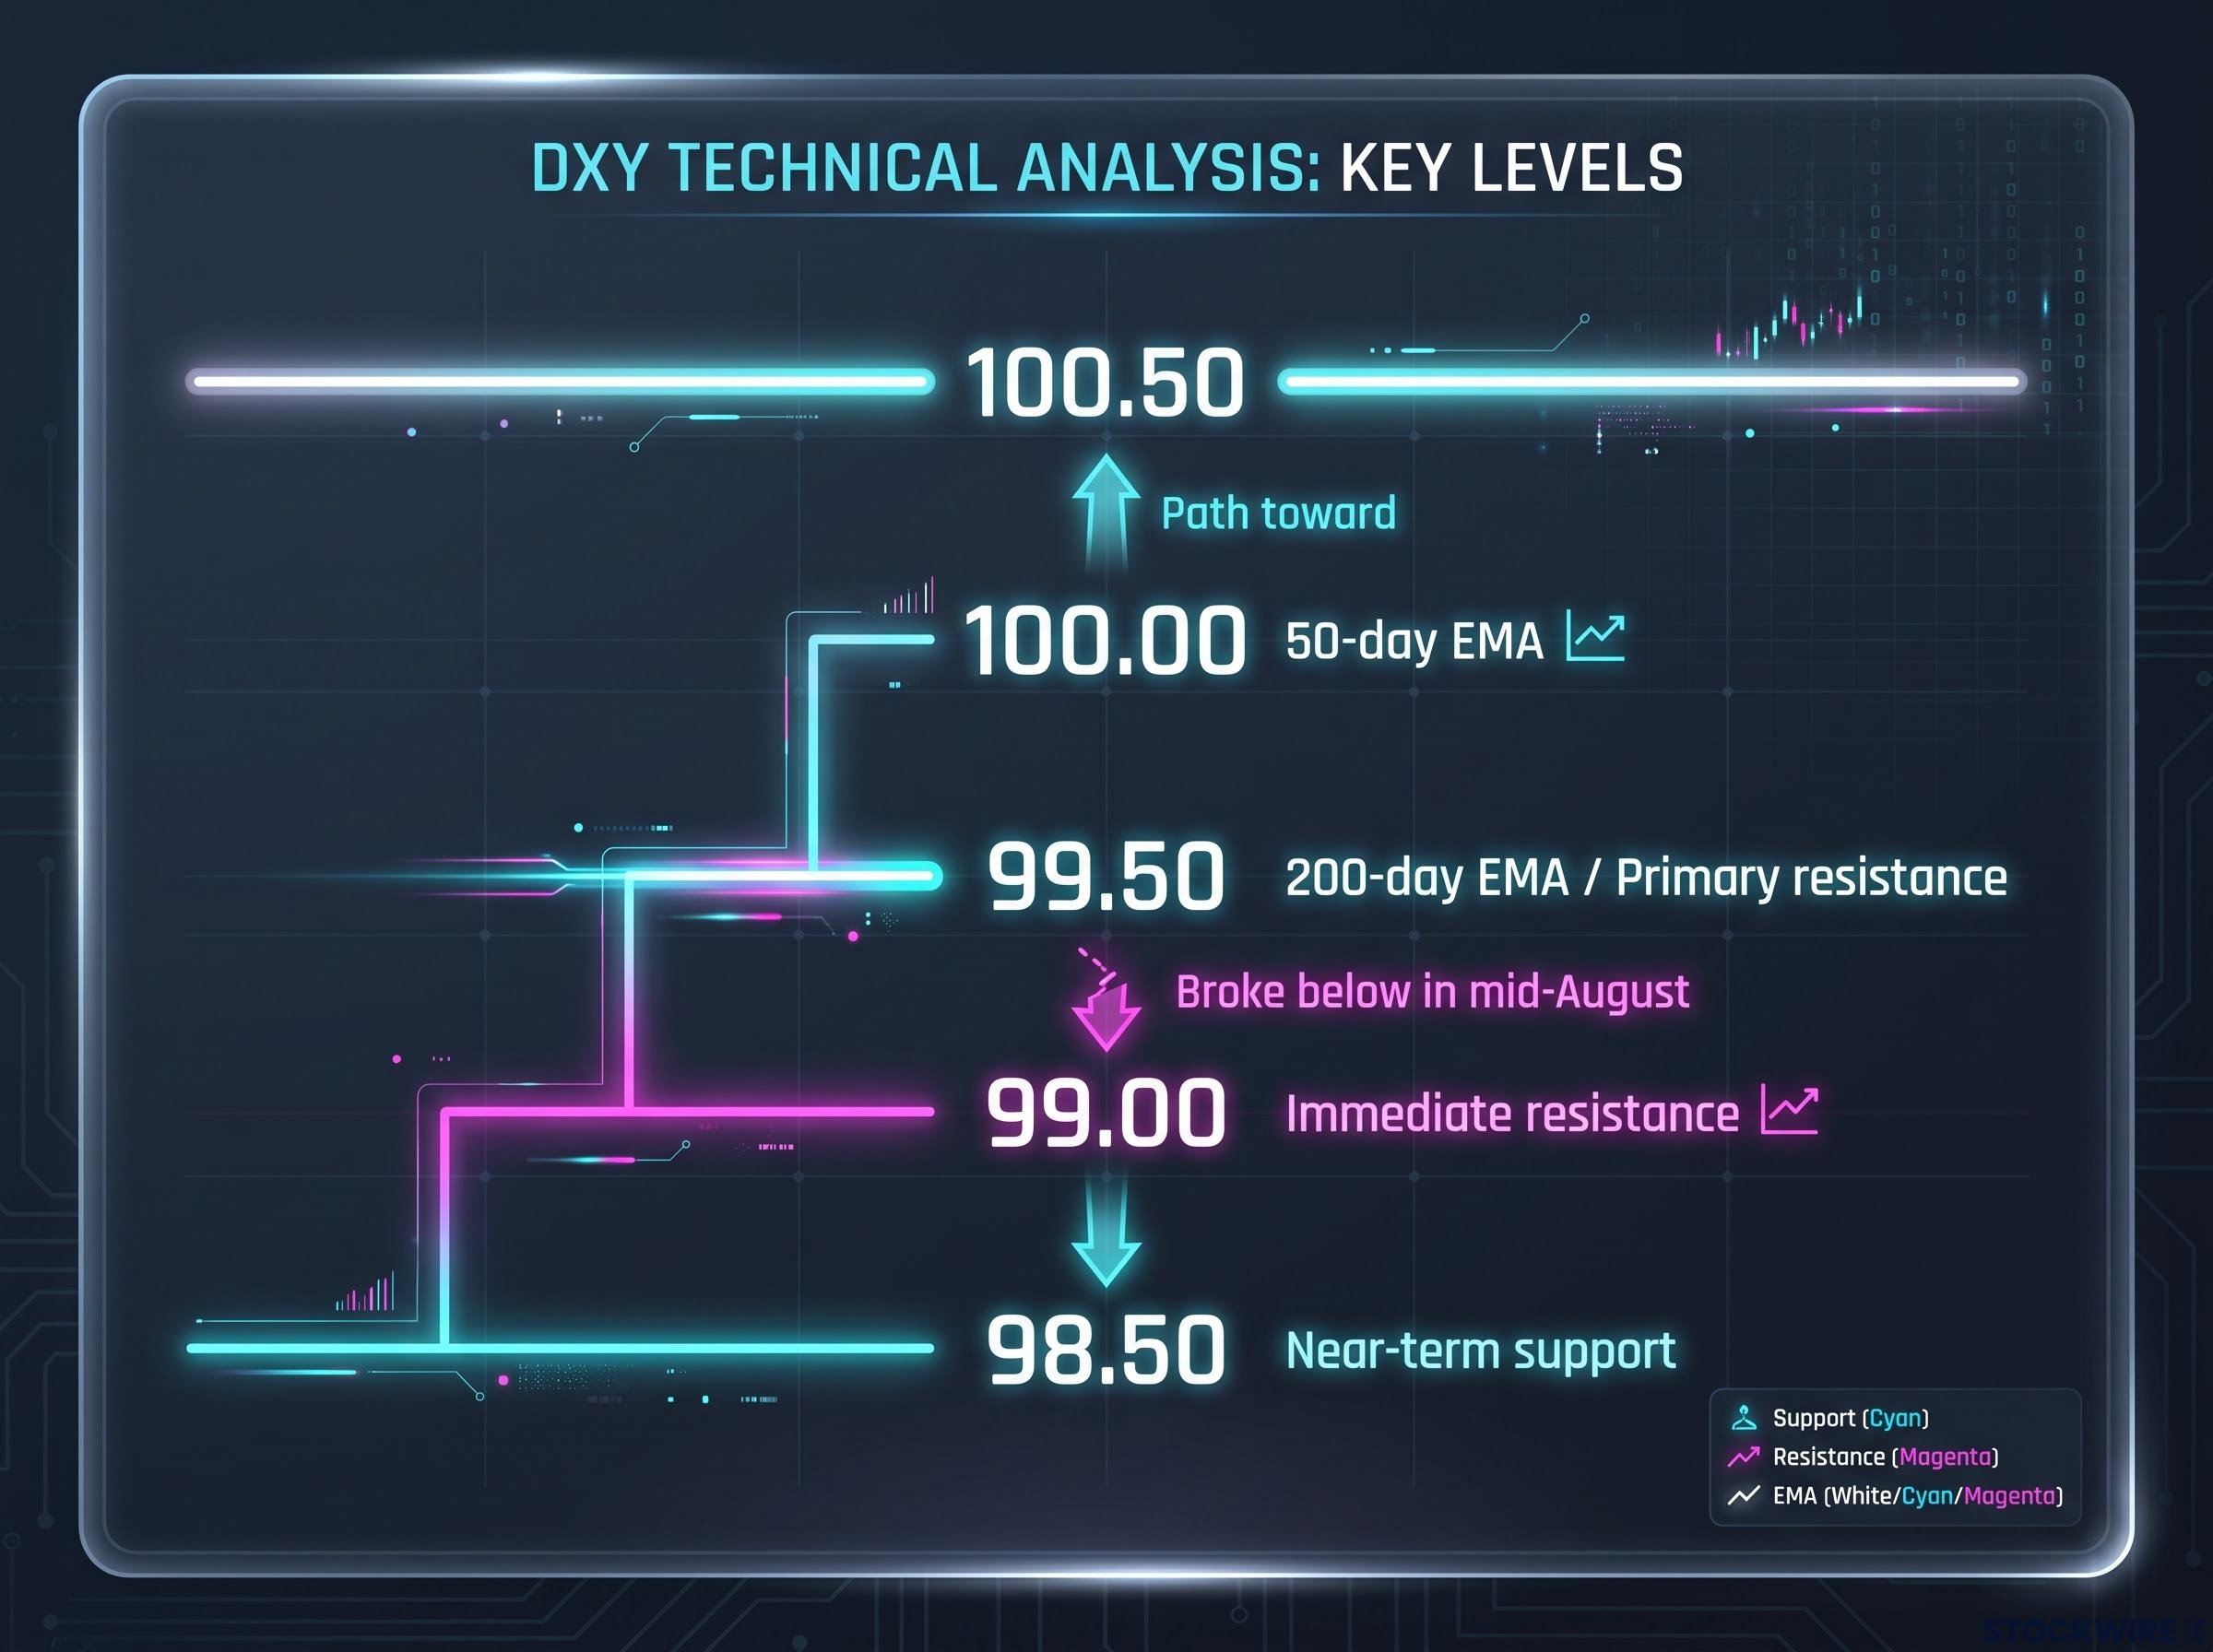
With price continuing to hold beneath the 200-day EMA near 99.50, the technical bias for the DXY remains bearish. Price has run into a ceiling at roughly 99.00, where the bounce has so far run out of momentum, and the index has so far failed to reclaim the 200-day EMA level that it broke below in mid-August.
| Level | Value (Approx.) | Significance |
|---|---|---|
| Near-term support | 98.50 | Session low near 98.75; broader move low at 98.50. Below this, no meaningful reference levels in current window |
| Immediate resistance | 99.00 | Current bounce stalled here |
| 200-day EMA (primary resistance) | 99.50 | Sustained daily close above required to reopen upside; bearish bias invalidation level |
| 50-day EMA | 100.00 | A close above 99.50 would open the path toward 100.50 |
The DXY slipping below its 200-day EMA and failing to reclaim it is consistent with the shift toward easier dollar liquidity conditions described by the buyback mechanism. Technicals confirm the directional move.
The multi-factor caveat on DXY causation
Technicals do not establish causation. The Dollar Index is driven by macro data releases, Fed communication, global risk appetite, and relative growth differentials alongside the buyback channel. A sustained daily close above 99.50 would not merely be a technical signal; it would require you to reassess whether the fiscal-easing transmission is being offset by other factors, particularly new bill issuance that neutralises the TGA drawdown or a shift in Fed communication.
The buyback channel is one important and under-discussed contributor. It is not the single dominant driver.
What the buyback channel tells you that the Fed narrative misses
The three-part mechanism assembles into a coherent account. The Treasury draws from an elevated TGA to fund buybacks, injecting reserves into the banking system. The maturity shift toward bills expands the supply of money-like instruments. The near-zero RRP means that injected liquidity flows directly into bank reserves and private funding markets rather than being absorbed by the standing facility.
The Fed’s policy rate remains at 3.50%-3.75% with no change in asset holdings. The buyback channel is operating independently of official monetary policy.
The limits of the thesis matter as much as the thesis itself. These are formally debt-management and liquidity-support operations, not monetary policy actions. The empirical evidence on buybacks themselves is modest: estimated approximately 0.2 basis points of narrowing in bid-ask spreads for off-the-run securities. The macro transmission is a hypothesis amplified by current environmental conditions, not a settled equivalence to Fed easing.
The policy architecture behind sustained yield suppression through sovereign buying has a historical precedent in financial repression, the 1942-1951 regime in which a heavily indebted US government used institutional tools to hold borrowing costs below what an unfettered market would demand, generating negative real returns for creditors while eroding the real debt burden over time.
The three conditions you should monitor to assess whether the fiscal-easing thesis remains valid:
- TGA balance versus working balance estimate: The current surplus of roughly $350-$400 billion above the $550-$600 billion working balance is the fuel. If the TGA begins rebuilding rather than drawing down, the reserve injection thesis weakens materially.
- RRP facility usage: Near-zero usage keeps the transmission channel open. A meaningful increase in RRP usage would signal the buffer is reabsorbing liquidity.
- Buyback funding source: TGA drawdown-funded buybacks are net reserve injections. Bill-issuance-funded buybacks are two-sided and potentially neutral. Watch whether Treasury’s cash management approach draws from surplus or offsets with new issuance.
“The upsized long-end buybacks, funded in part from an elevated TGA and operating in a world of minimal RRP usage, are an important and under-discussed source of dollar liquidity. They do not replace Fed policy, but they do help explain why financial conditions and currency behaviour can shift even when the Fed’s stance appears unchanged.”
Three conditions to watch before the next buyback cycle ends
The current expanded ceiling runs through 4 November. That date is the natural next inflection point, and what happens between now and then will either reinforce or undermine the fiscal-easing thesis in real time.
Here is what to monitor, and what each reading tells you:
- TGA balance trajectory: A declining TGA toward the $550-$600 billion working balance signals the surplus is being deployed and reserves are being injected. A rising or stable TGA above $950 billion signals buybacks are being funded by offsetting new issuance, weakening the net reserve injection significantly.
- RRP facility usage: Sustained near-zero usage confirms the amplification channel remains open. Any meaningful increase above $50-$100 billion would suggest the system is reabsorbing liquidity and the transmission effect is dampening.
- Subsequent buyback programme announcements: Watch whether Treasury maintains, expands, or reduces the $4 billion per-operation ceiling after 4 November. A reduction would signal the temporary support window is closing.
The FRED Treasury General Account balance data, published weekly by the Federal Reserve, provides the real-time TGA readings that underpin the surplus-versus-working-balance comparison central to this transmission thesis.
No single variable provides a clean signal. The multi-factor nature of DXY means the 99.50 level on the 200-day EMA will either confirm or challenge the macro thesis if reclaimed before the programme window closes.
The broader point is structural. The Treasury’s debt-management operations are now a material input to dollar liquidity analysis. If you monitor only the Fed’s rate path, you are working with an incomplete picture, and the current environment, with the Fed on hold and the Treasury actively reshaping the maturity profile of its debt, is precisely when that gap costs you the most.
This article is for informational purposes only and should not be considered financial advice. Investors should conduct their own research and consult with financial professionals before making investment decisions. Past performance does not guarantee future results. Financial projections are subject to market conditions and various risk factors.