The July 2026 retail sales report landed a –0.6% month-over-month decline, and if you stopped reading at the headline, you probably concluded the US consumer is finally cracking. That number deserves more scrutiny than most coverage gave it.
This particular data release, published by the Census Bureau on 14 August 2026, is unusually easy to misread. It arrives at a moment when recession anxiety is already elevated, it carries two overlapping distortions that both happen to drag in the same direction, and the most-cited figure is the one least suited to telling you what is actually happening with household spending.
Here is how to read this data honestly. What follows are the specific components that produced the headline, the adjusted measures that strip them out, and the forward-looking indicators that matter more than any single retail print for assessing where US consumer health stands heading into late 2026.
The headline number that is doing the most damage
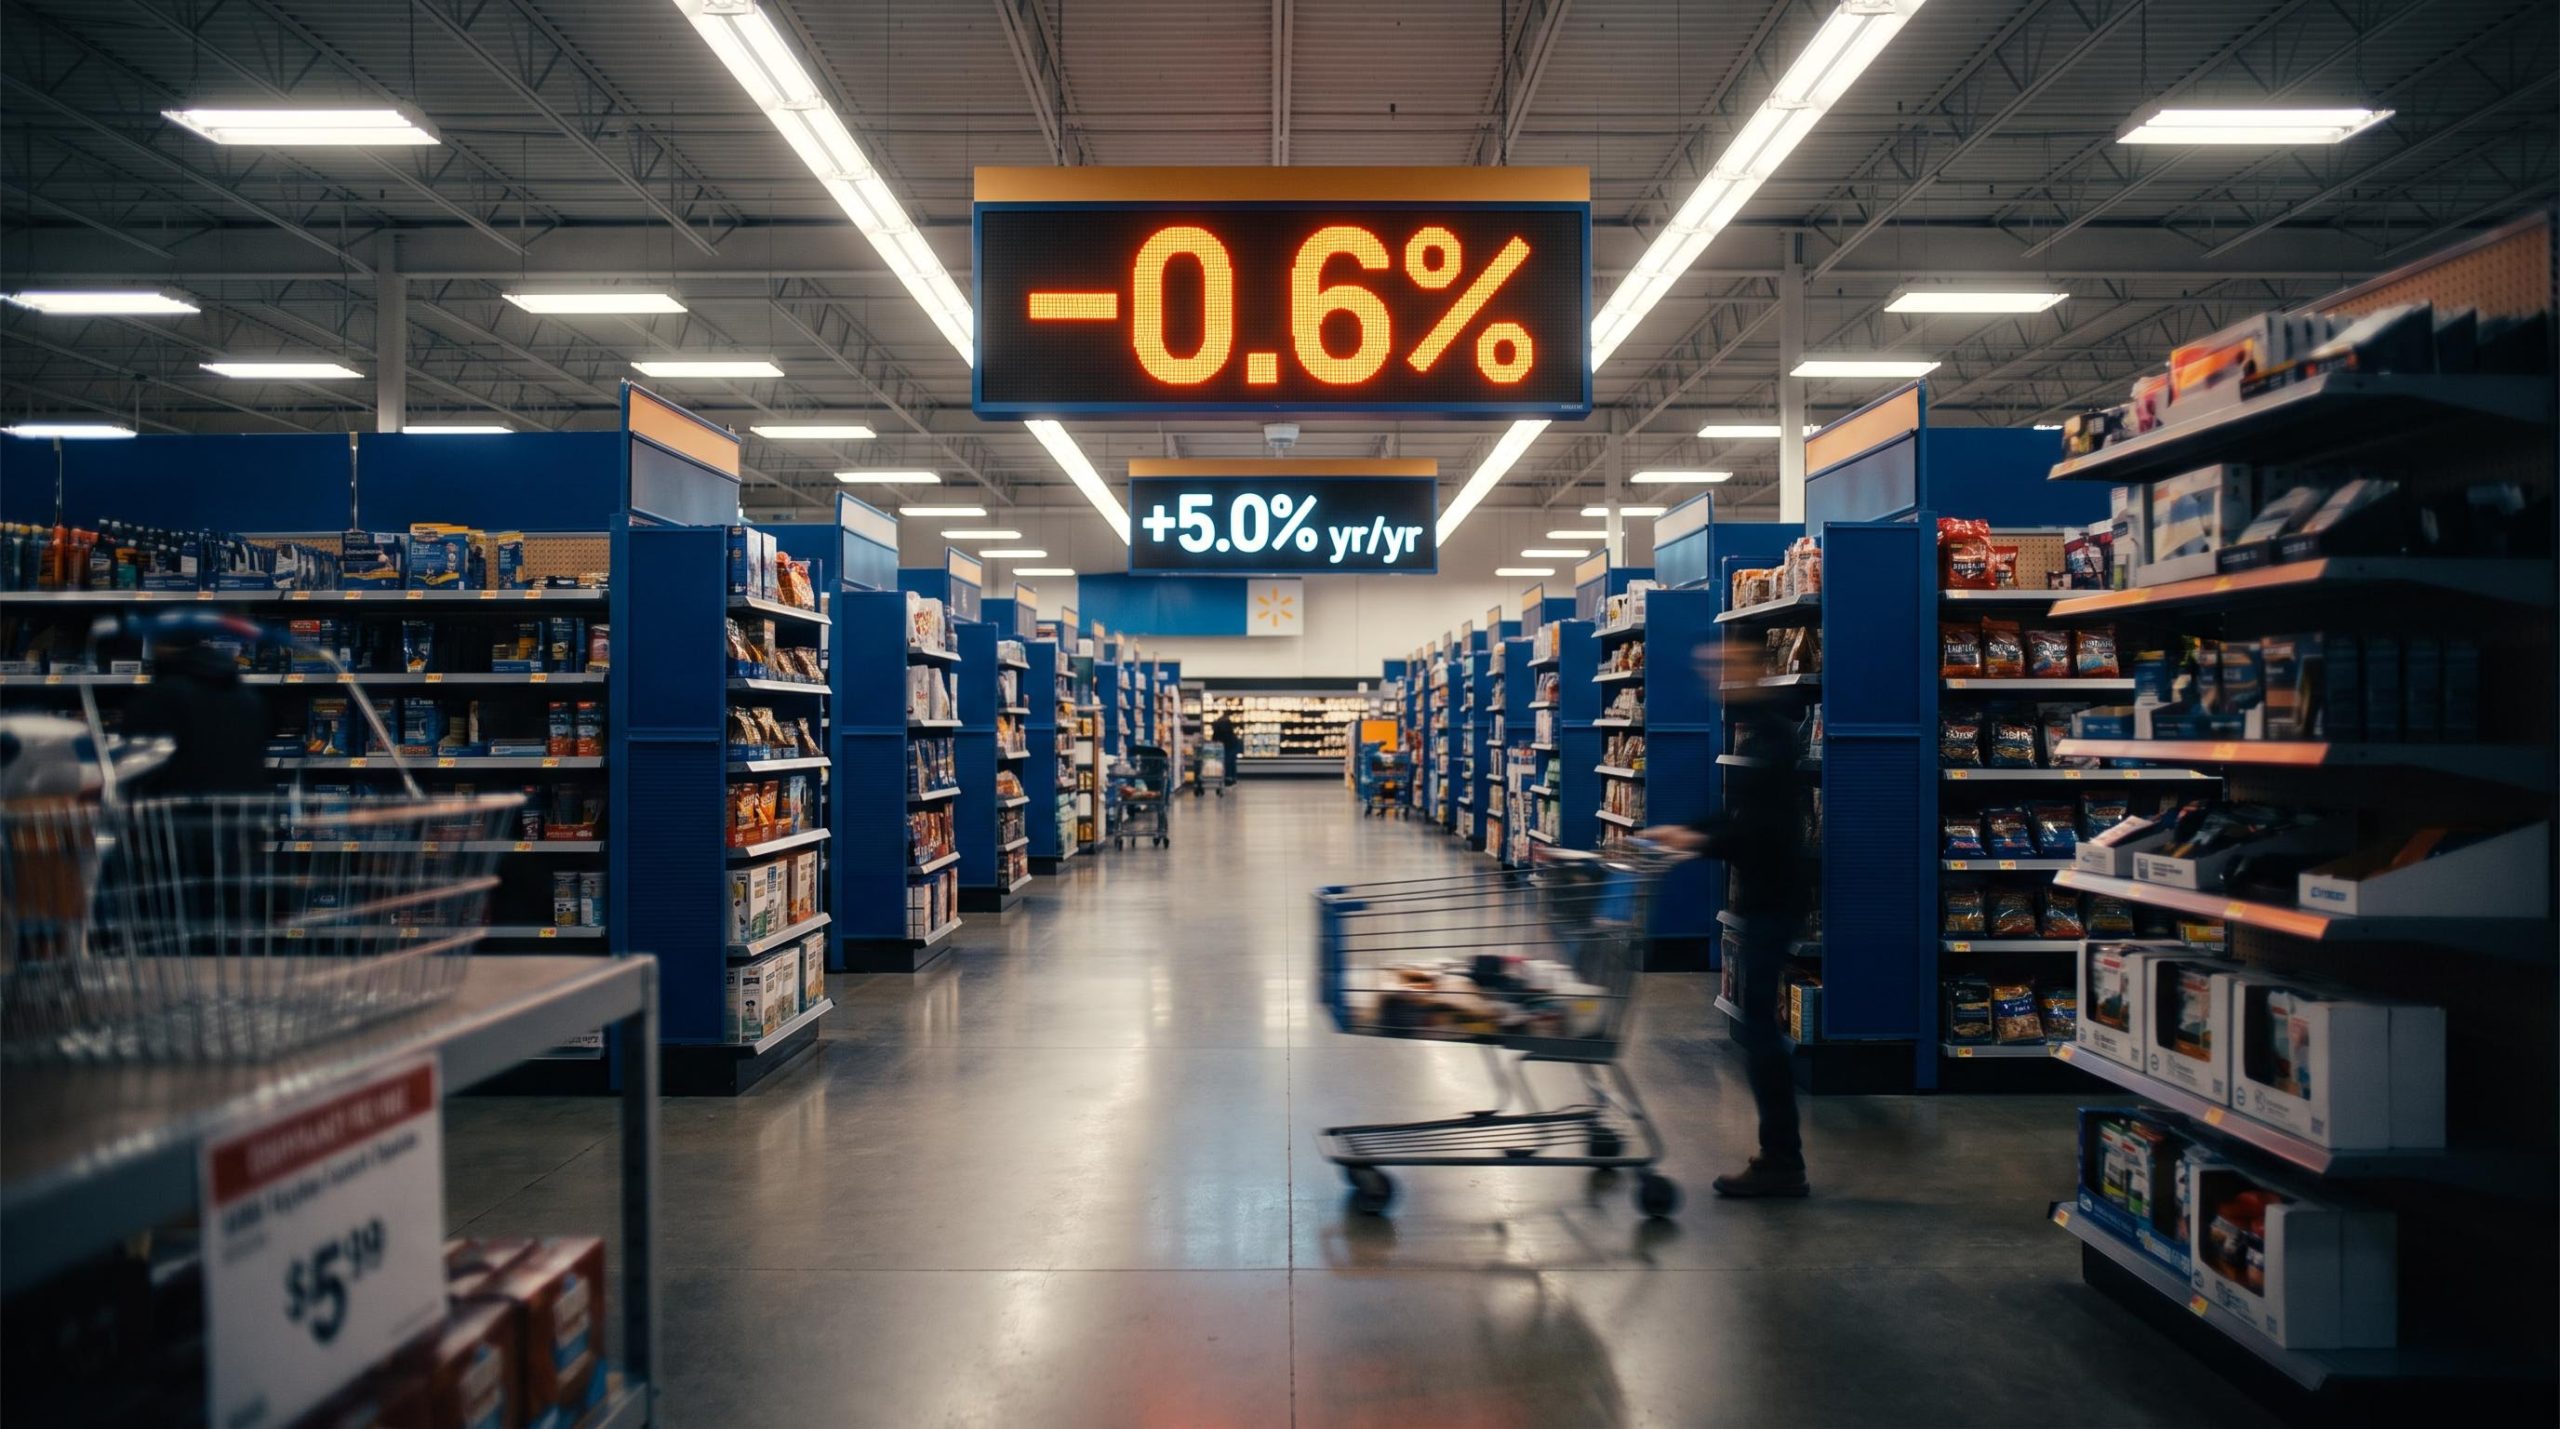
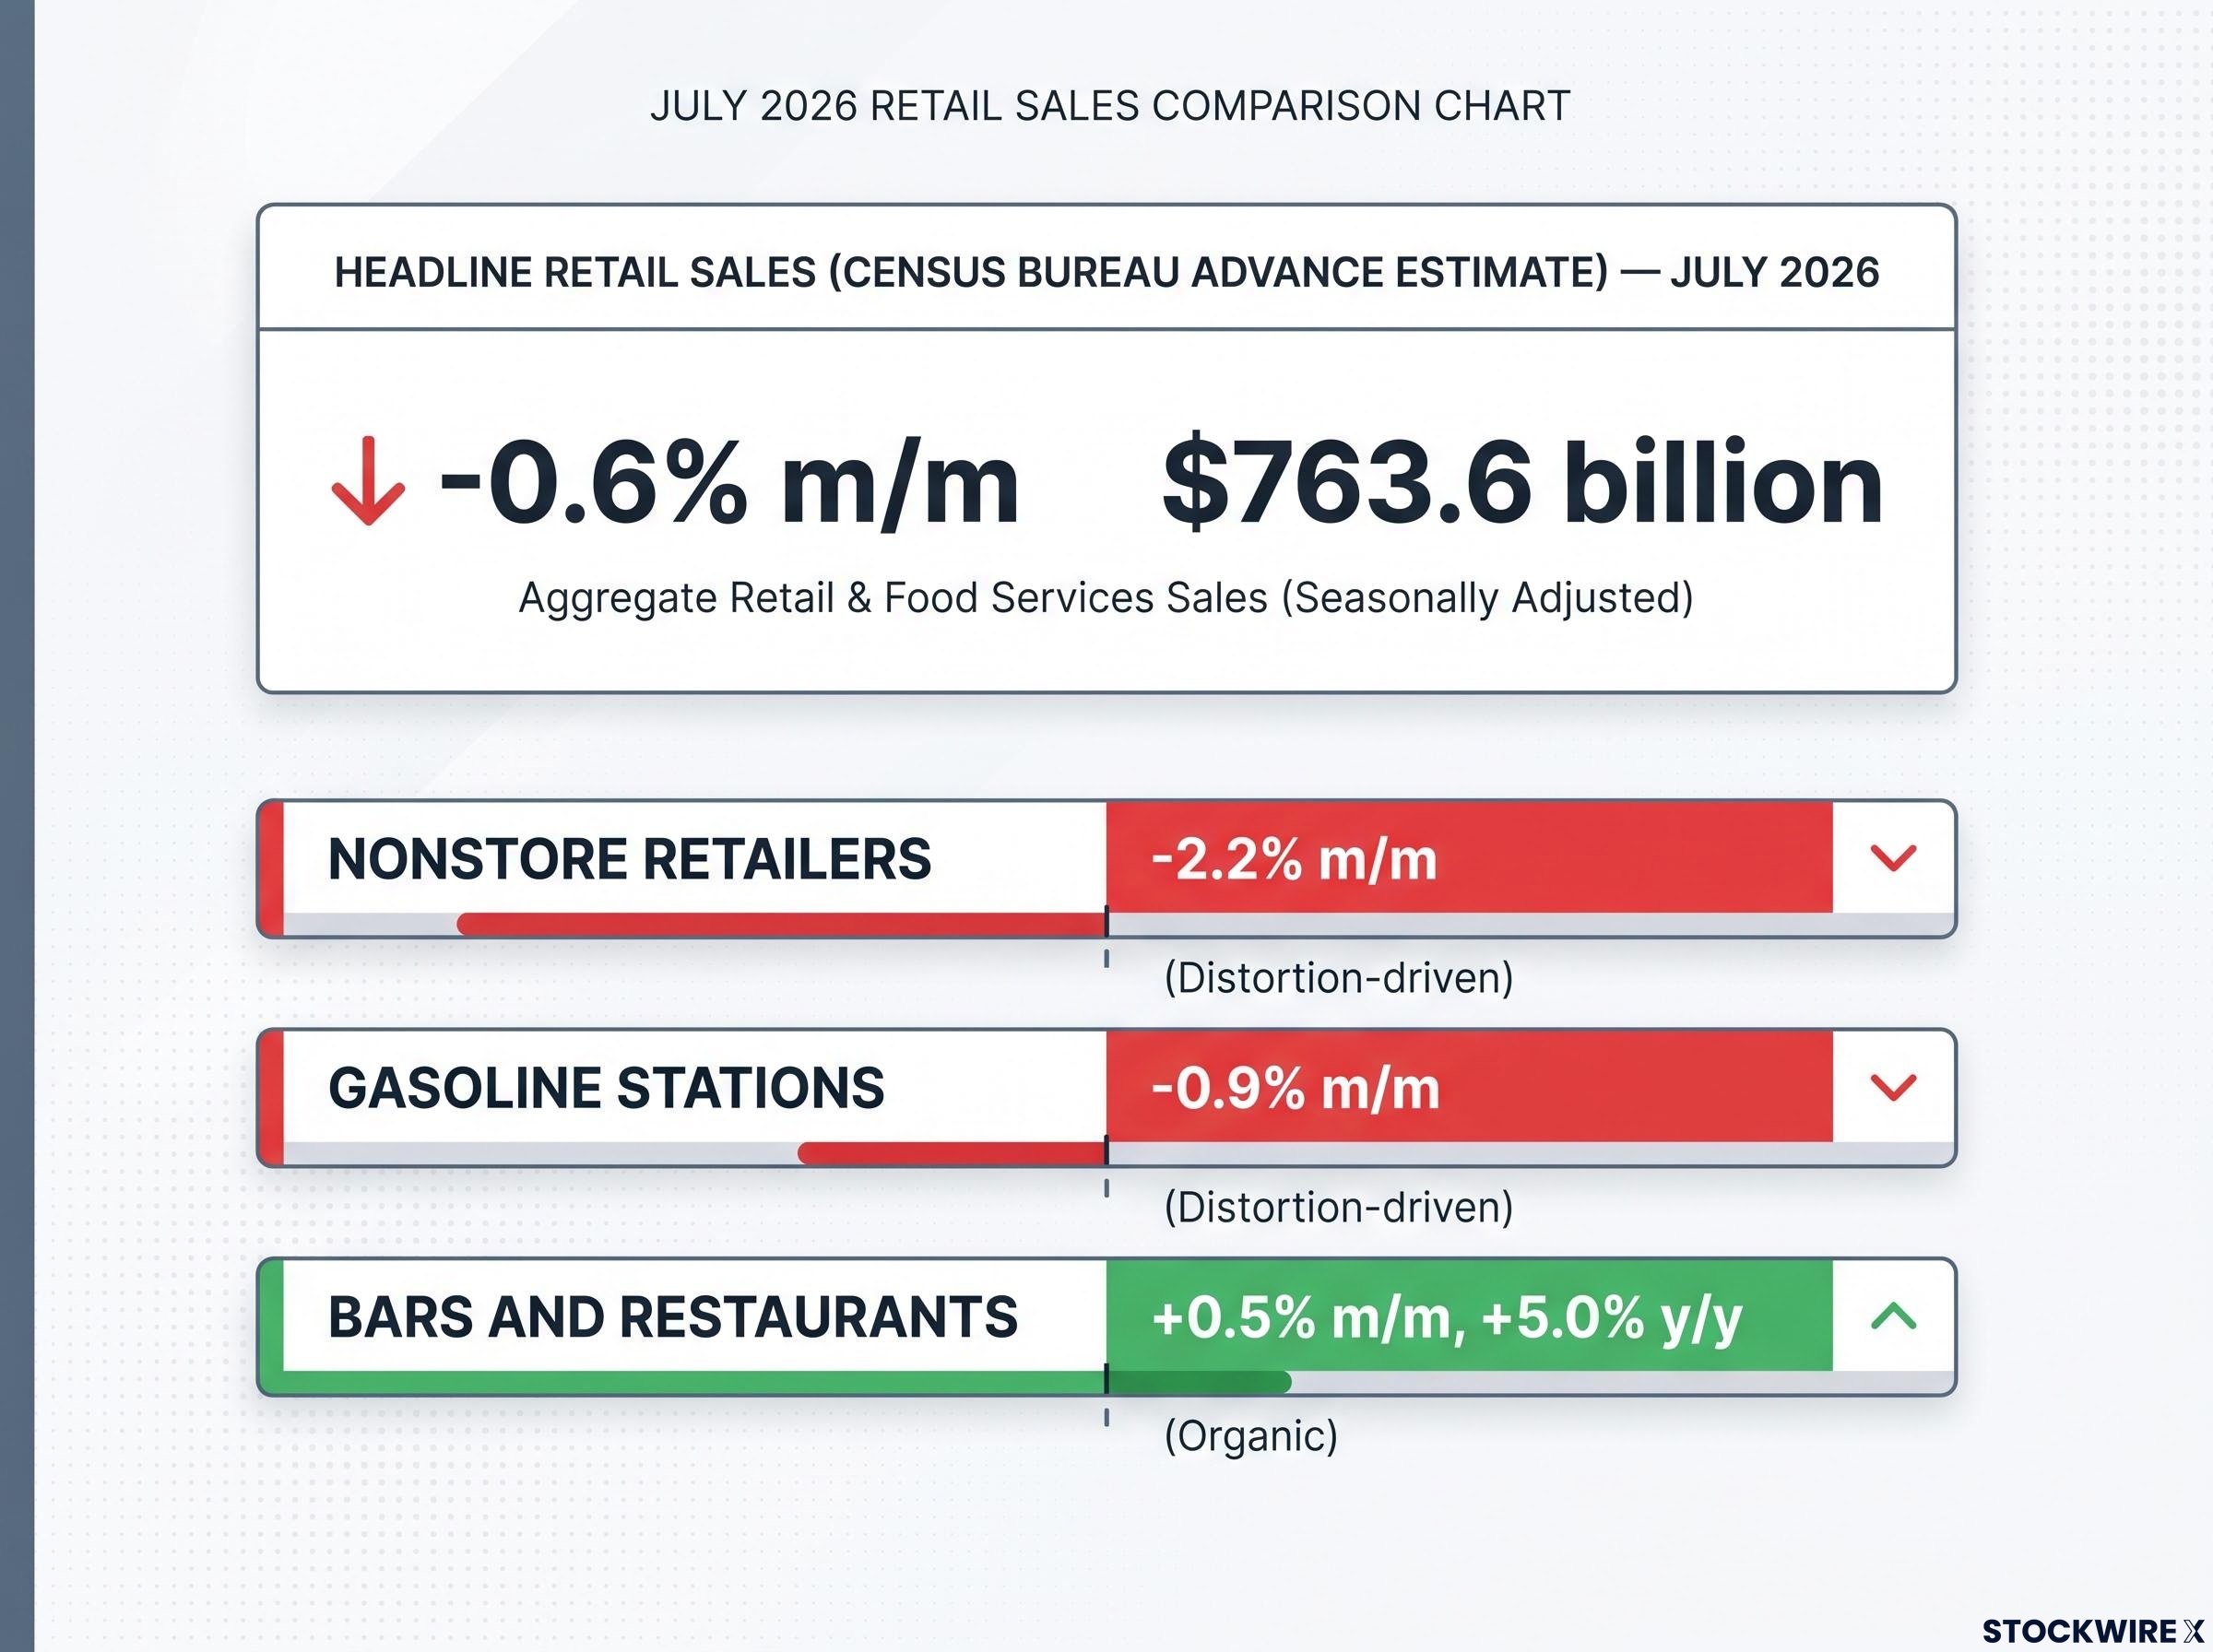
The Census Bureau’s advance estimate showed retail and food services sales fell 0.6% month-over-month in July to $763.6 billion, the first monthly decline in nine months. That figure landed well below expectations and gave ammunition to every bearish consumer thesis circulating on financial media.
But look at what produced it.
Two categories account for the bulk of the decline: gasoline stations (–0.9% m/m) and nonstore retailers (–2.2% m/m). Each carries a distinct mechanical explanation that has nothing to do with whether American households are pulling back. Most other retail categories held flat or rose modestly, a structural counter-signal that got buried under the aggregate.
- Headline retail sales: –0.6% m/m, $763.6 billion (Census Bureau advance estimate)
- Gasoline stations: –0.9% m/m
- Nonstore retailers: –2.2% m/m, the single largest drag
- Bars and restaurants: +0.5% m/m, approximately +5.0% y/y
Year-over-year, retail sales were still up +5.0%. That longer baseline tells a fundamentally different story from the monthly figure that dominated headlines.
| Category | July m/m Change | Signal Type |
|---|---|---|
| Headline retail sales | –0.6% | Distortion-driven (aggregate of below) |
| Gasoline stations | –0.9% | Distortion-driven (price effect) |
| Nonstore retailers | –2.2% | Distortion-driven (calendar shift) |
| Bars and restaurants | +0.5% | Organic (undistorted demand signal) |
The –0.6% headline is not a reliable signal of consumer retrenchment. Its two largest drags reflect price mechanics and a calendar shift rather than any change in household willingness or ability to spend. Reading the headline alone produces a systematically misleading conclusion about consumer momentum.
When big ASX news breaks, our subscribers know first
Two distortions, one misleading print
The two distortions that landed in July are independent of each other, but they happened to compound in the same monthly report, making the print look worse than either would have produced alone.
Why falling gas prices pull down the retail headline
Census Bureau retail sales data is nominal, meaning it captures dollar receipts, not physical volumes.
- When pump prices fall, gas station dollar receipts decline even if consumers are driving exactly the same number of kilometres and filling up just as often.
- The –0.9% decline at gasoline stations in July reflects lower prices at the pump, not reduced fuel demand.
- This effect reverses automatically when prices rise, which makes it a poor trend signal in either direction.
The gasoline drag is pure price-level arithmetic. It tells you what petrol cost in July, not whether consumers changed their behaviour.
What Amazon Prime Day’s move to June did to July’s numbers
Amazon’s 2026 Prime Day ran 23-26 June, rather than in July as in most prior years. That created a spending pull-forward.
- A large volume of online consumer spending, and the wave of promotional activity that surrounds Prime Day across the retail sector, shifted into June’s figures.
- July’s nonstore retail category was left comparatively depleted, producing the –2.2% monthly decline.
- Analysts at TD Economics explicitly attribute a large share of the nonstore weakness to this timing shift rather than to any genuine deterioration in consumer demand.
The nonstore weakness primarily reflects when consumers shopped, not whether they shopped. Both distortions are mechanical: one reflects price-level arithmetic, the other a calendar accident. Neither tells you anything about whether US households are financially stressed or spending freely.
What the adjusted data actually show about underlying demand
Two different measures of the underlying consumer picture exist for July, and they point in opposite directions. Understanding which one to use, and why, is where precision matters most.
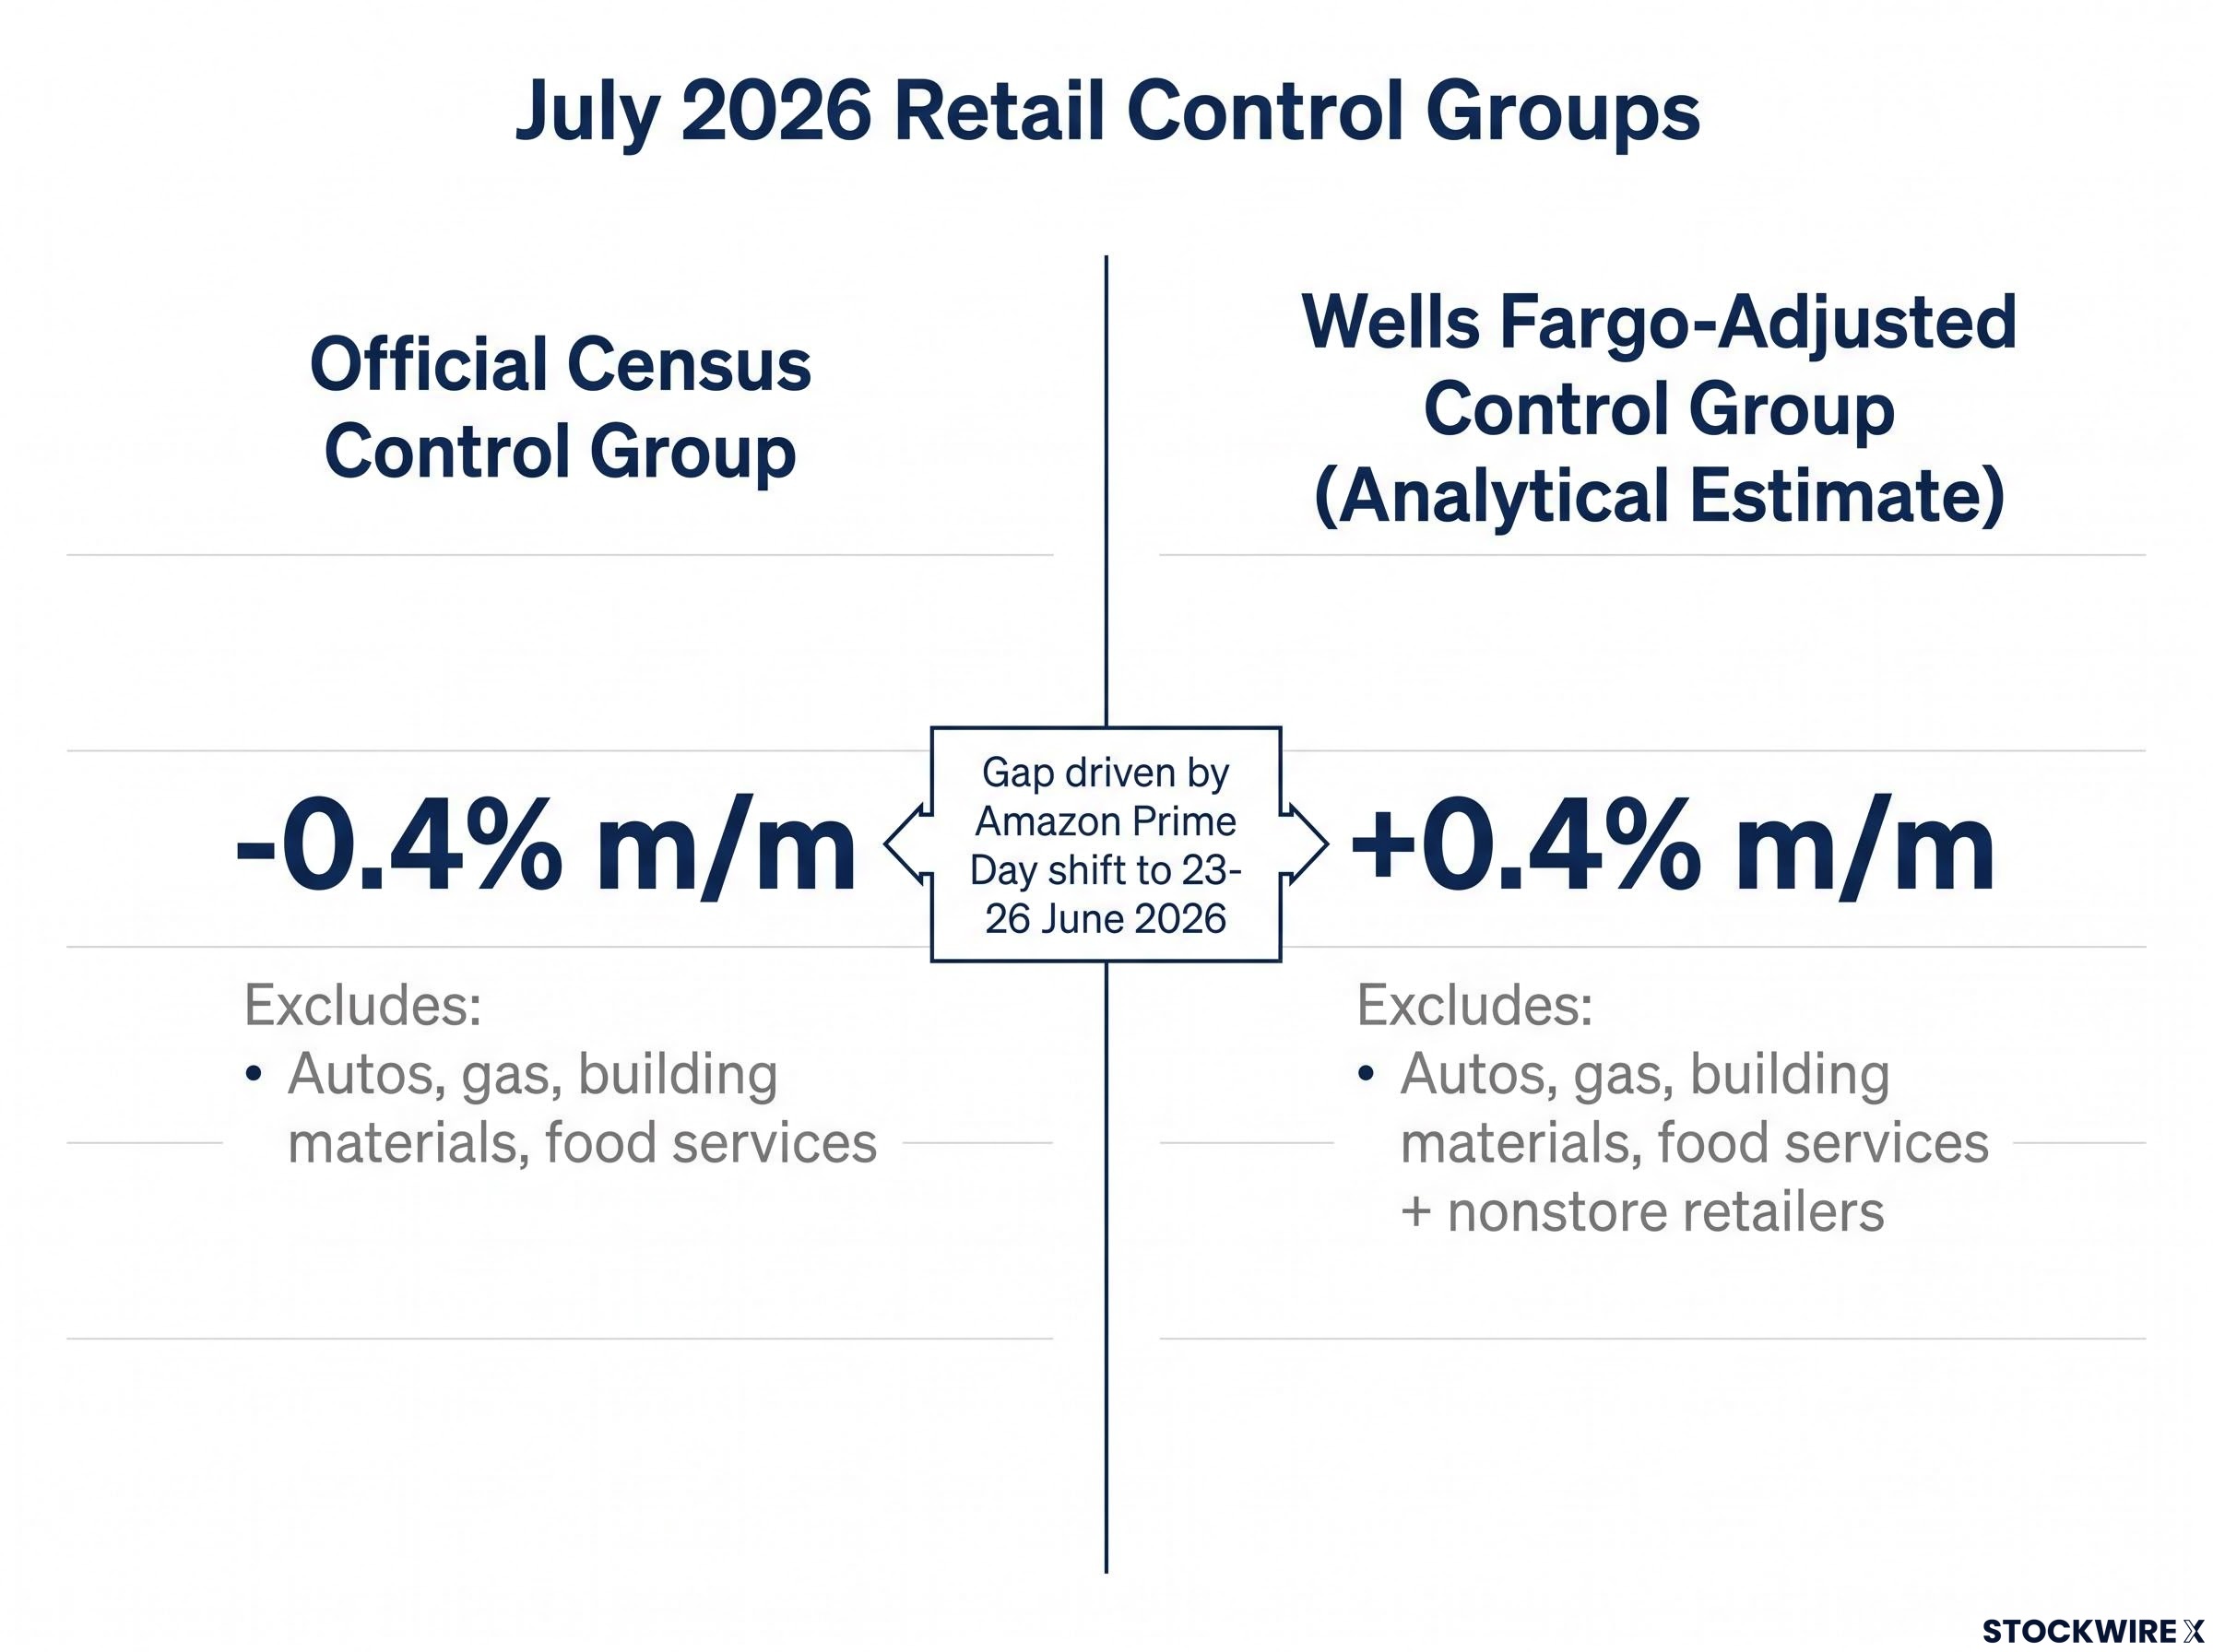
The official Census Bureau control group (retail sales excluding autos, gasoline, building materials, and food services) fell –0.4% month-over-month. This is the published government figure. It declined.
A separate measure from Wells Fargo Economics, which applies the same exclusions but goes a step further by removing nonstore retailers to account for the Prime Day calendar distortion, came in at +0.4% month-over-month, running marginally ahead of the trend recorded over the preceding six months. This is an analytical construct, not an official statistic.
The gap between –0.4% and +0.4% is entirely explained by one data series (nonstore retailers) and one calendar event. The two figures are telling the same story from different vantage points rather than contradicting each other.
Corroborating the adjusted picture: bars and restaurants rose +0.5% month-over-month and approximately +5.0% year-over-year, a category-level data point that requires no adjustment and points to continued consumer engagement in discretionary services spending. Separately, the CNBC/NRF Retail Monitor reported its core measure rose +0.3% month-over-month in July, though this figure has not been independently confirmed.
Analytical estimate, not official data: The Wells Fargo-adjusted control group figure of +0.4% month-over-month additionally excludes nonstore retailers from the standard Census control group. It is a defensible analytical choice given the Prime Day distortion, but it is not a government statistic and should not be treated as one.
| Measure | July 2026 Result | Data Type | What It Excludes |
|---|---|---|---|
| Official Census control group | –0.4% m/m | Realised (Census advance) | Autos, gas, building materials, food services |
| Wells Fargo-adjusted control group | +0.4% m/m | Analytical estimate | Same as above + nonstore retailers |
| Bars and restaurants | +0.5% m/m | Realised (Census advance) | N/A (standalone category) |
| CNBC/NRF Retail Monitor core | +0.3% m/m | Alternative measure (unverified) | Methodology differs from Census |
Knowing which control group measure to reference, and being explicit about which one you are citing, separates a confident reading of this data release from one that either dismisses the weakness entirely or overstates it.
Income, inflation, and the labour market variable that now matters most
The retail data look backward. The question that matters for the consumer outlook is structural: what determines whether spending holds up through the rest of 2026, and what would cause the picture to deteriorate quickly.
What the PCE and income projections say about household buffers
Wells Fargo Economics, led by Tom Porcelli and colleagues, projects the following for July, pending the Bureau of Economic Analysis (BEA) Personal Income and Outlays release:
- Nominal consumer spending: projected +0.2% m/m
- Nominal personal income: projected +0.3% m/m
- Overall PCE deflator: projected +0.1% m/m / approximately 3.6% y/y
- Core PCE: projected +0.2% m/m / approximately 3.3% y/y
Income outpacing spending is a marginally positive signal for household balance sheet stability, suggesting some modest preservation of financial buffers rather than drawdown.
Core PCE at approximately 3.3% year-over-year remains materially above the Federal Reserve’s 2% target. The direction of travel is toward disinflation, but the process is incomplete, and real purchasing power continues to be modestly eroded even as nominal wages provide some offset.
These are projections, not realised data. They are grounded in CPI and PPI data already available but remain estimates until the BEA publishes.
Why the labour market is now the critical variable
Through the first half of 2026, households drew support from tax refunds that ran larger than typical, giving consumer spending a temporary lift that helped offset other pressures. That support has now largely run its course and dissipated.
With the fiscal cushion gone and limited remaining support from pandemic-era savings, real spending growth depends on two things: employment continuity and real wages modestly outpacing inflation. The consumer story has shifted from a savings-and-fiscal-support narrative to a wages-and-employment narrative.
The downside risk is direct. Any meaningful deterioration in the labour market would flow quickly into spending pressure with fewer buffers to absorb the shock. That makes the monthly payrolls report and real wage data more analytically important than any single retail sales release for the rest of 2026.
What this data actually tells you about the consumer heading into late 2026
“Less bad than the headline suggests” is the accurate framing for the July retail print. Not resilient. Not strong. But not the consumer capitulation that the –0.6% figure implied on first reading.
The precision you now have is threefold. You know that the headline is distorted by gasoline price mechanics and a Prime Day calendar shift. You know which adjusted measures offer a cleaner read, and where the boundaries of official versus analytical data sit. And you know that the forward-looking consumer picture hinges on labour market continuity and real wage dynamics rather than on any single month’s retail figure.
The US consumer is bending, not breaking. The July retail report is a data point worth understanding carefully, not one worth acting on directly.
The income-outpacing-spending configuration provides a marginally positive structural note. But with core PCE still running well above the Fed’s target and fiscal tailwinds gone, the margin for error has narrowed. The next few payrolls reports carry more analytical weight than any retail release for determining whether this steady-but-fragile picture extends into Q4 2026.
This article is for informational purposes only and should not be considered financial advice. Investors should conduct their own research and consult with financial professionals before making investment decisions. Financial projections referenced in this article, including those from Wells Fargo Economics, are subject to revision and should not be treated as confirmed outcomes.