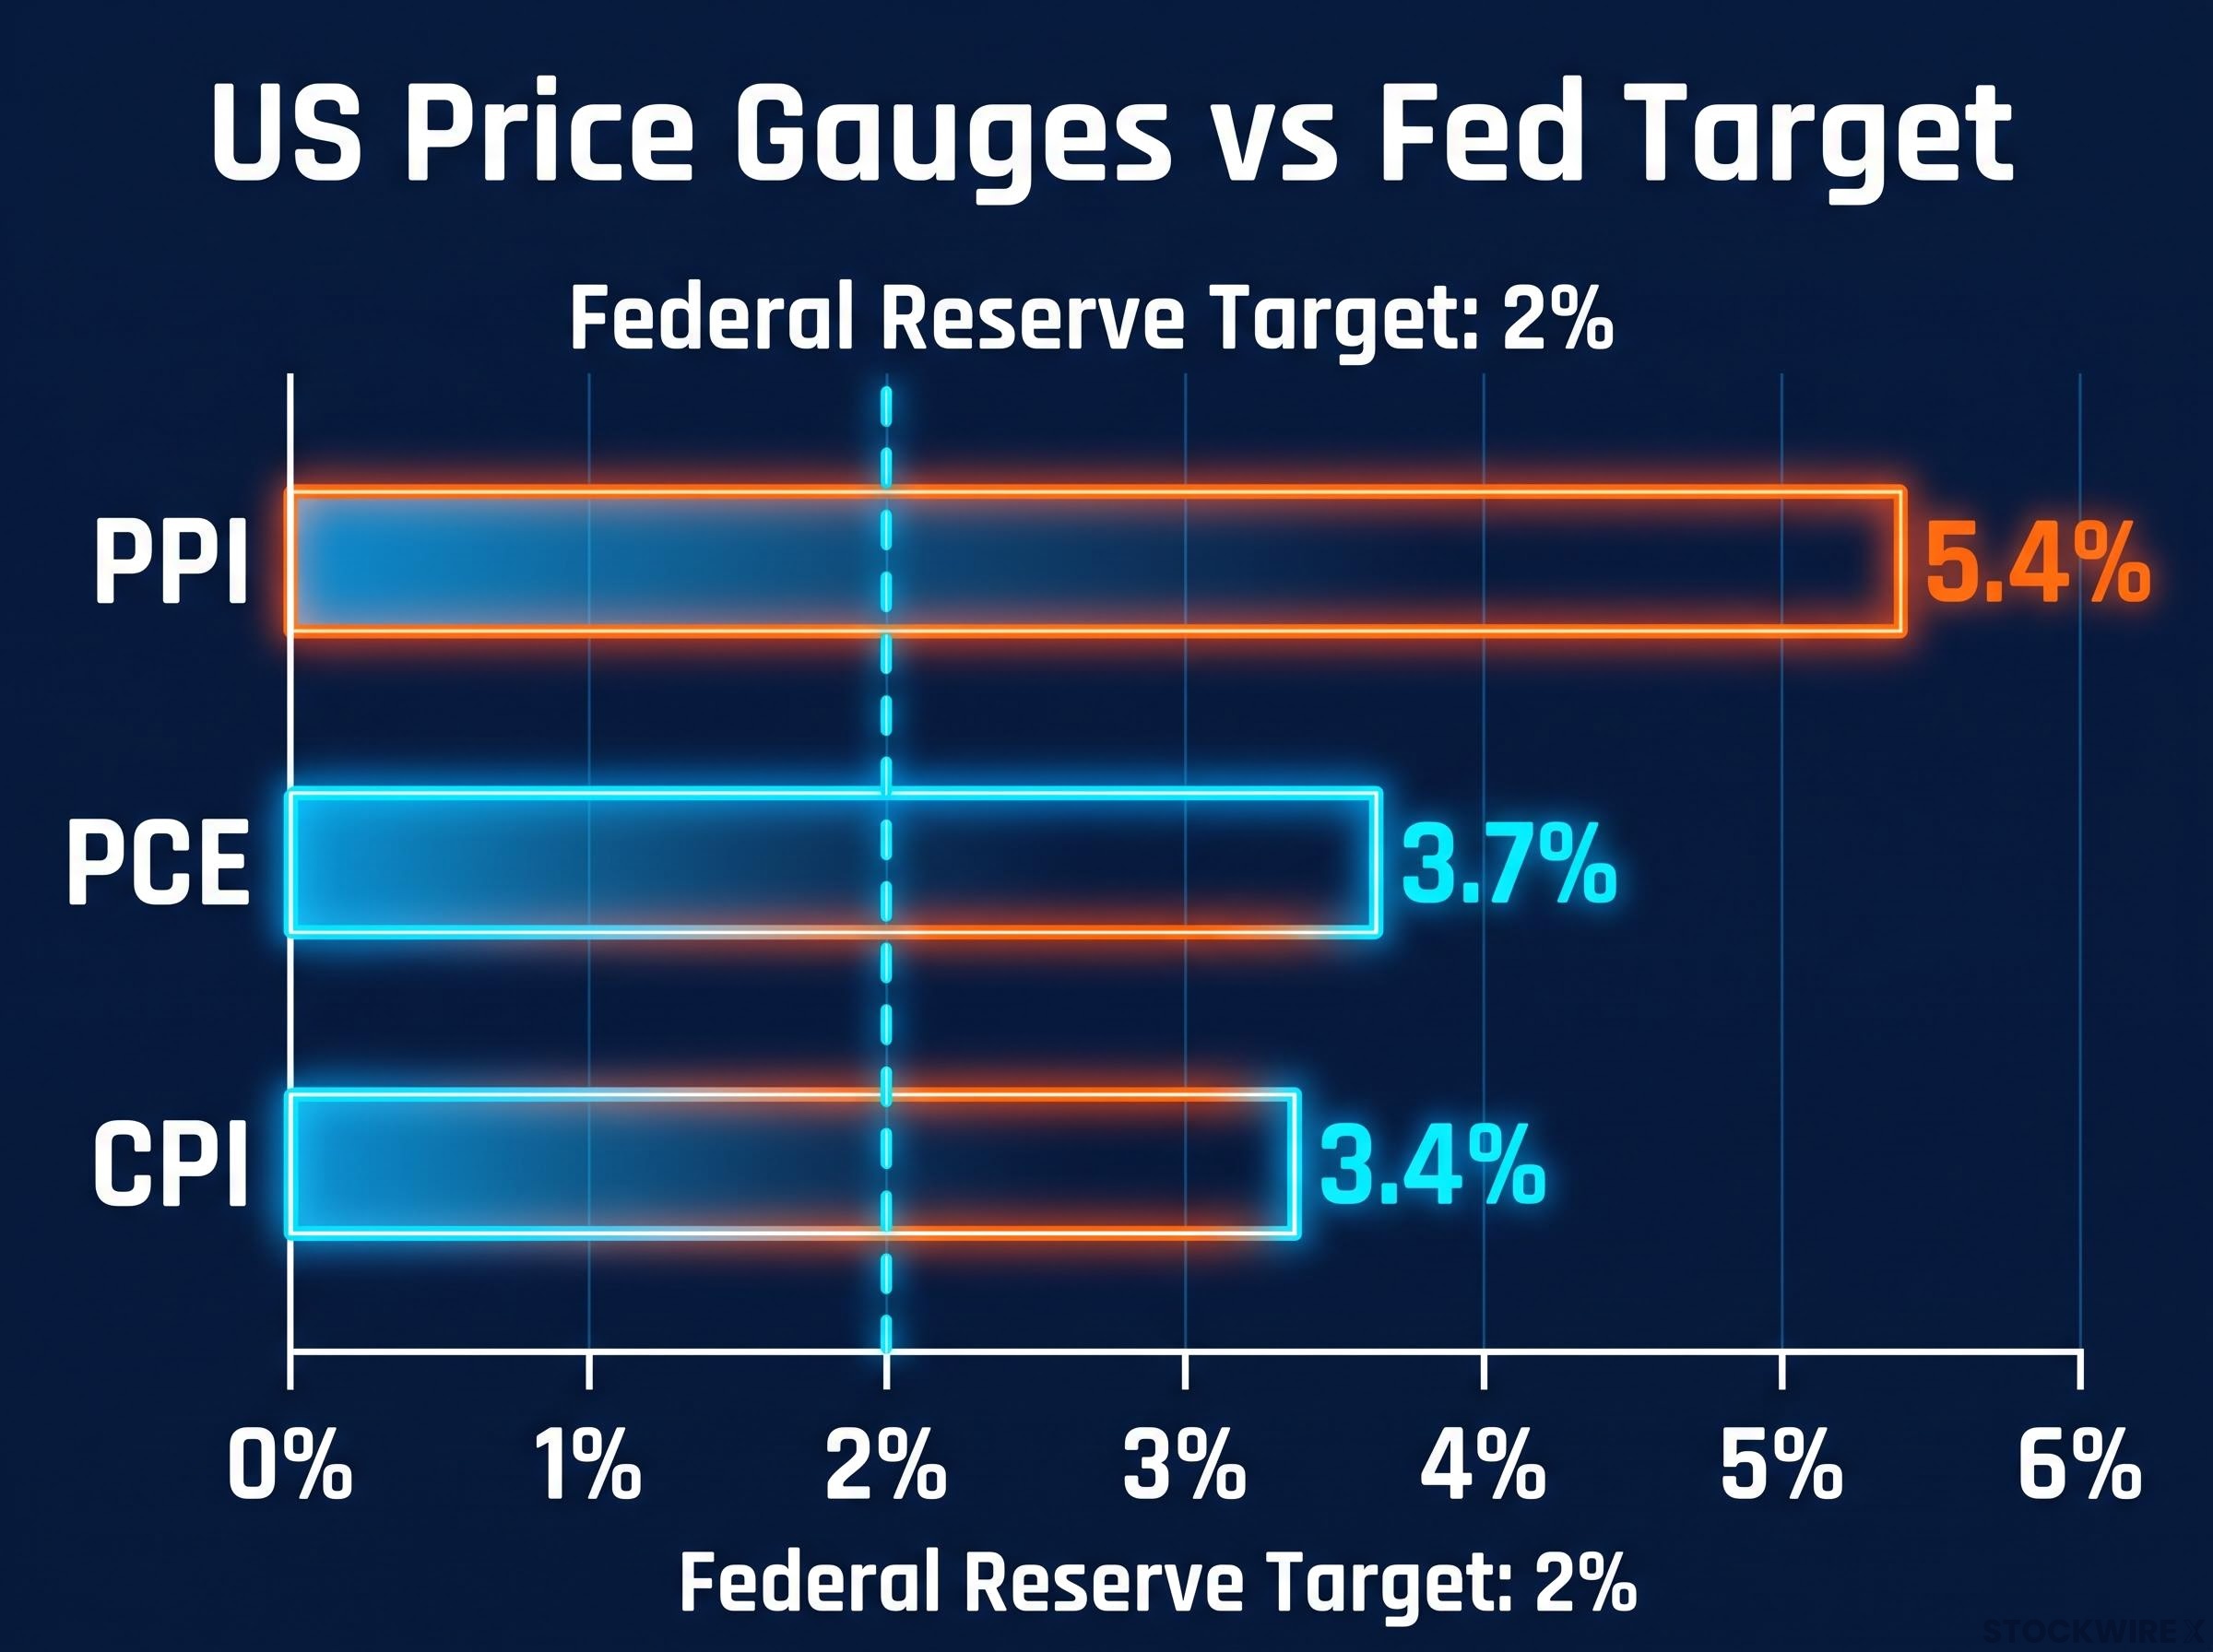
Three of America’s headline price gauges are running hot at the same time. The Consumer Price Index (CPI) sits at 3.4%, the Personal Consumption Expenditures (PCE) index at 3.7%, and the Producer Price Index (PPI) at 5.4%, all above the Federal Reserve’s 2% target. Meanwhile, the 10-year Treasury yield has climbed to its highest level since 2007.
For years, the working assumption was that this bout of inflation was temporary, a supply-chain hangover that would fade. As of September 2026, it is starting to look structural. Professor Steve Hanke’s monetary framework offers a specific, testable reason why, and that same logic explains why bond yields are stuck at multi-decade highs.
That connection matters for anyone building an inflation investment strategy right now. What you get here is a clear analytical lens for why inflation is not retreating on schedule, the six forces keeping yields elevated, and which bond instrument the current environment actually favours, along with the reasoning behind it.
Why money supply growth, not rate hikes alone, explains sticky inflation
Start with a question most investors skip: where does inflation actually come from? The mainstream answer points to the Fed’s policy rate. Hanke’s answer points somewhere else entirely, to the quantity of money circulating in the economy.
The distinction is not academic. When a bank has spare lending capacity and finds a creditworthy borrower, it issues a loan. That loan credits the borrower’s account with new money that did not exist a moment earlier. Broad money expands. Crucially, this happens regardless of where the Fed has set its benchmark rate.
That is why rate hikes alone have not shut off the tap. Credit demand from the artificial intelligence sector has been immense, and lending against that demand keeps creating money even as policy tightens.
The Warsh-era Fed framework formalises what Hanke has long argued from outside the institution: Divisia M4 and M2 are active policy co-signals, not background noise, and investors who read Fed intent solely through rate guidance are now working with an incomplete map.
Hanke’s benchmark is a clean one: broad money growing faster than roughly 6% a year makes a 2% inflation target mechanically hard to hit.
Hanke’s rule of thumb: broad money growth above 6% annually is inconsistent with a 2% inflation target. Above that line, the arithmetic of the quantity theory works against price stability.
Where does US money growth sit now? Center for Financial Stability data shows Divisia M4, a broad measure, growing at 6.8% year-over-year as of June 2026, easing slightly from 6.9% in May. The original source flagged an even sharper reading, 7.4% and accelerating from 5.6% a year earlier. The precise figure is contested, but the direction is not: money is expanding above Hanke’s threshold. The narrower M2 aggregate grew at roughly 5.5% as of July 2026, per St. Louis Fed data, with total M2 at $23,342.8 billion.
| Divisia M4 reading | Hanke threshold |
|---|---|
| Current (June 2026): 6.8% | 6% |
| Prior year: 5.6% (per original source) | 6% |
Now line that up against the price data:
- CPI: 3.4% headline, 2.4% core
- PCE: 3.7% headline, core PCE near 3.3%
- PPI: 5.4%
The headline CPI looks moderate. The six-month annualised CPI trend at 5.1% does not, and that acceleration is the tell. With Divisia M4 sitting above Hanke’s line, the Fed’s hikes have not fully choked off money creation. That means the conditions for above-target inflation remain in place regardless of what the policy rate does next. If you anchor your inflation expectations to Fed decisions alone, you are watching the wrong variable.
When big ASX news breaks, our subscribers know first
Six converging forces driving Treasury yields to levels not seen in decades
Above-target money growth feeds inflation, and inflation is only the first of six pressures bearing down on the bond market. As of 29 September 2026, the 10-year Treasury yield sat between 5.24% and 5.28%, its highest since 2007, while the 30-year reached 5.55% to 5.6%, a 24-year high. Sources differ slightly on the exact figures, but both point to the same multi-decade extreme.
Hanke identifies six forces, and they compound rather than sit in isolation:
- Underlying inflation, sustained by the above-threshold money growth already described.
- AI-driven credit demand, with individual AI-sector issuances now topping $1 trillion, dwarfing the roughly $500 billion in equity and debt issuances seen in earlier years.
- Ad hoc policy impacts, chiefly tariffs, which function as a tax on American consumers.
- Geopolitical energy shocks, including US engagement with Iran and Ukrainian strikes on Russian refining infrastructure, both feeding through to fuel prices.
- China trade reversals, where an adversarial stance yielded limited leverage and forced partial rollbacks.
- Deteriorating confidence, with the Conference Board’s consumer reading at its lowest since 2014, below COVID-era levels, and University of Michigan sentiment among the weakest on record.
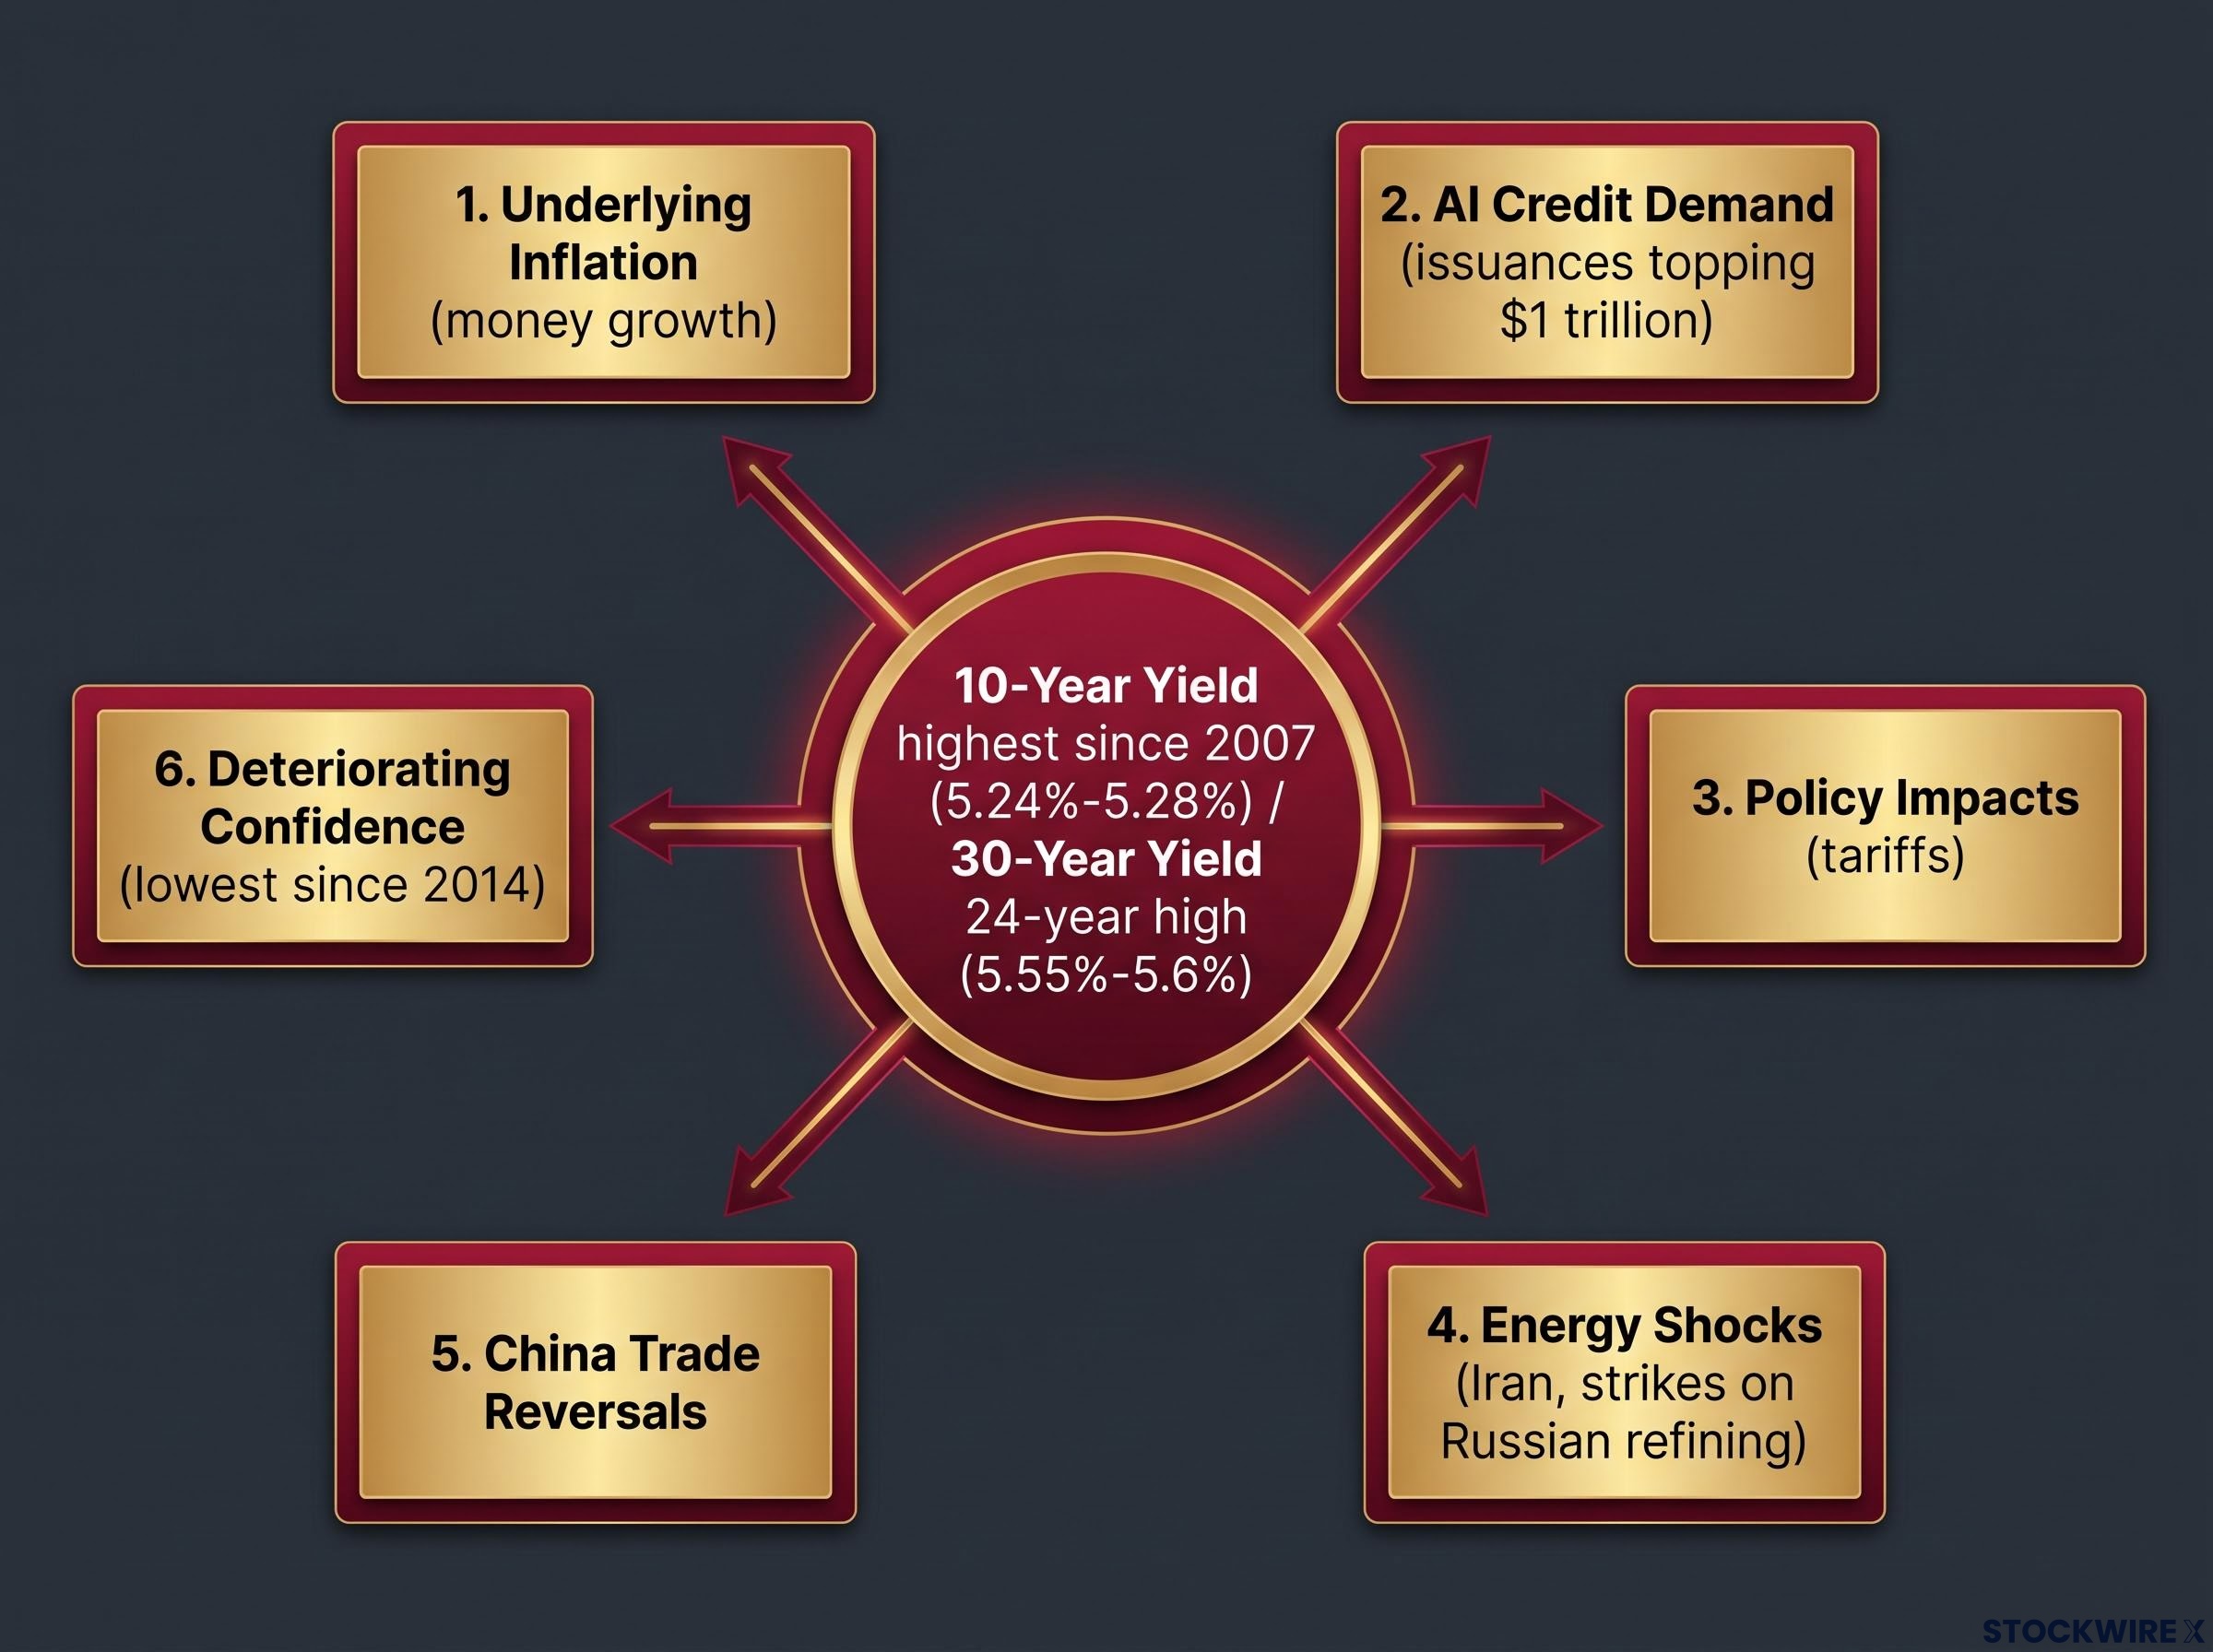
Each factor reinforces the others. AI credit demand feeds money growth, which feeds inflation, which feeds yield expectations, while geopolitical shocks and tariffs keep supply-side prices sticky. No single policy lever, not a rate cut, not a tariff rollback, resolves all of them at once. That is the point most consensus forecasts miss, and it is why yields may stay elevated longer than the market expects.
Ben Shabbat, a former Chicago Fed economist, describes a tail risk worth naming: a “bond market run” or buyer strike, where investors refuse new Treasury issuance without substantially higher yields. The danger is that such a strike can become self-fulfilling.
How quantitative tightening amplifies the structural yield repricing
There is a mechanical reason the term premium, the extra yield investors demand for holding longer-dated bonds, has expanded. Under quantitative tightening (QT), the Fed has stepped back as a dominant, price-insensitive buyer of duration. Someone else now has to absorb heavy issuance, and they want compensation for the uncertainty.
Layered on top is a fiscal-risk component. Large structural deficits and a rising debt-to-GDP ratio push investors to demand more yield simply for holding long-term government debt.
Term premium dynamics, the extra yield investors demand for holding longer-dated bonds rather than rolling shorter-term paper, have expanded materially as the Fed stepped back as a price-insensitive buyer under QT, forcing private investors to absorb heavy issuance at compensation levels not seen since 2007.
Traditional absorbers are also pulling back. Foreign official institutions and banks, once reliable buyers of Treasury supply, have shown weaker appetite, thinning the demand side just as issuance climbs. For anyone sizing a bond allocation over the next 12 to 24 months, these are structural pressures, not passing ones.
What the inflation persistence debate means for how you read the data
Here is why two credible analysts can look at the same numbers and disagree entirely: they are using different frameworks. Understanding which lens is in play is the fastest way to calibrate your own conviction.
Three schools dominate the debate.
The monetarist view, associated with Hanke and John Greenwood, rests on the quantity theory of money. Its equation, MV = PY, is the conceptual anchor.
MV = PY: money supply times velocity equals the price level times real output.
In plain terms, if the amount of money grows faster than the economy’s output, prices tend to rise to fill the gap. Monetarists treat broad money growth above output plus target as a leading indicator of inflation, with a lag of roughly one to two years.
The New Keynesian view, held by most Fed officials and mainstream academics, argues the link between simple aggregates and inflation has weakened. They watch whether the policy rate sits above the neutral rate, alongside survey-based inflation expectations and real economic slack.
The fiscal-dominance view points to large, persistent deficits, supply shocks, and corporate pricing power in concentrated industries as the real drivers.
Why does Hanke favour Divisia M4 over the more familiar M2? Divisia M4 weights monetary assets by how liquid they are, giving a more precise measure of effective money than M2’s simple sum. It is a sharper instrument for the same job.
Hanke’s critique of standard money supply measures lays out the analytical case for preferring Divisia M4 over simpler aggregates like M2, arguing that simple-sum measures systematically understate the effective money stock and therefore mislead policymakers about inflationary pressure.
| Framework | Primary driver | Key indicator | Policy implication |
|---|---|---|---|
| Monetarist | Broad money growth | Divisia M4 vs 6% threshold | Restrain money growth directly |
| New Keynesian | Rate channel, expectations | Policy rate vs neutral rate | Set rates above neutral |
| Fiscal-dominance | Deficits, supply shocks | Debt-to-GDP, deficit path | Fiscal consolidation |
History shows how differently these episodes resolve. The Great Inflation of the late 1960s and 1970s ended only through Volcker-era tightening. The post-WWII period leaned on financial repression, yield caps and directed credit, eroding real purchasing power to manage debt. Today’s environment is a hybrid of fiscal transfers, QE-driven money growth, and supply shocks. The existence of three frameworks should not paralyse you. It should push you to identify which set of assumptions the market has priced in, then decide whether you agree.
TIPS versus nominal bonds: what the current environment actually recommends
So what do you do with this? Hanke’s recommendation is direct: avoid nominal bonds and prefer Treasury Inflation-Protected Securities (TIPS), because they guarantee a real, inflation-adjusted yield in an environment where realised inflation is likely to outrun what the market currently discounts.
TIPS are not a free lunch, and the risks deserve equal billing:
The TIPS real yield advantage sharpens at current 30-year levels near 3.05%, placing investors in the top quartile of real yield opportunity since 2000, a window that Hanke’s above-threshold money growth reading argues will remain open only as long as realised inflation continues to outrun the 2.25% breakeven the bond market has priced.
- Breakeven risk: TIPS only outperform if realised CPI exceeds the current breakeven rate. If inflation undershoots that, nominal Treasuries win.
- Real-yield risk: TIPS still carry duration. Rising real yields hurt TIPS prices just as they hurt nominal bonds.
- Liquidity: The TIPS market is smaller, and bid-ask spreads widen under stress.
- Phantom income: For taxable US investors, the annual inflation accretion to principal is taxed yearly, even though the cash is not received until maturity.
- Basis risk: TIPS track headline CPI with a lag, so investors benchmarking to wage growth or core PCE hedge imperfectly.
The nominal case is the mirror image. If disinflation or recession arrives, nominal Treasuries outperform. The TIPS bet rests entirely on money supply growth keeping realised inflation above the current breakeven.
| TIPS | Nominal Treasuries | |
|---|---|---|
| Inflation protection | Principal adjusts with CPI | None; fixed nominal payout |
| Primary risk | Realised CPI below breakeven | Inflation erodes real value |
| US taxable treatment | Phantom income taxed annually | Interest taxed as received |
| Best scenario | Inflation exceeds market pricing | Disinflation or recession |
Where is the bet being placed? Against a 3.4% headline CPI and a 5.1% six-month annualised trend, the breakeven becomes the pivot: if realised inflation tracks that faster trend, TIPS reward the holder. The phantom-income issue also means placement matters. Holding TIPS inside an IRA or 401(k) sidesteps the annual tax drag that hits taxable accounts.
Gold offers a corroborating signal. It fell roughly 5% in a single Monday session before partially recovering to near $4,200 per ounce, about 15% below its level four weeks earlier.
Hanke projects gold peaking at $6,000-$7,000 per ounce in a continued secular bull market. Treat this as a speculative long-range call, not a near-term target.
The practical question for a US investor holding nominal Treasuries today is simple: do you believe Divisia M4 growth will fall back below 6% before your bond matures? If you cannot answer that with conviction, Hanke’s framework points to TIPS.
This article is for informational purposes only and should not be considered financial advice. Investors should conduct their own research and consult with financial professionals before making investment decisions. Past performance does not guarantee future results. Financial projections are subject to market conditions and various risk factors, and forward-looking statements are speculative and subject to change.
What changes this picture, and when to revisit the call
The case built here is not permanent, and the signals that would break it are specific. The distance between Divisia M4 at 6.8% and Hanke’s 6% threshold is the measure of how far this environment has to travel before the framework flips.
Watch these conditions:
- Divisia M4 falling sustainably below 6% for two or more consecutive quarters
- Corresponding deceleration across CPI, PCE, and PPI
- Credible fiscal consolidation, a smaller deficit path
- Supply-shock resolution, easing energy and tariff pressures alongside recovering confidence
The last one matters because sentiment is currently a warning light, not a green one, with Conference Board confidence at its lowest since 2014 and University of Michigan sentiment among the weakest on record.
The genuine shift will show up in money supply data before it appears in equity valuations or consensus forecasts. That is the edge: an investor who watches the leading indicator can act before the market reprices.
How each historical analogue resolved, and what resolution would require today
Each precedent points to the same uncomfortable truth about how these episodes end. The Great Inflation broke only when Volcker pushed the policy rate to extreme levels, and the cost was a severe recession. Post-WWII debt was managed through financial repression, quietly eroding real purchasing power. Emerging-market fiscal dominance has historically demanded either credible institutional reform or inflationary financing that reduces real debt at the investor’s expense.
None of these resolutions were gradual or painless. The current environment shows no decisive sign of taking either path yet, which is precisely why the framework, and the case for TIPS, still holds.
For investors wanting to stress-test the historical analogues described here, our deep-dive into generational inflation regimes examines 150 years of cycle data and identifies why financial repression, rather than a Volcker-style rate shock, is the more politically likely exit from the current environment.