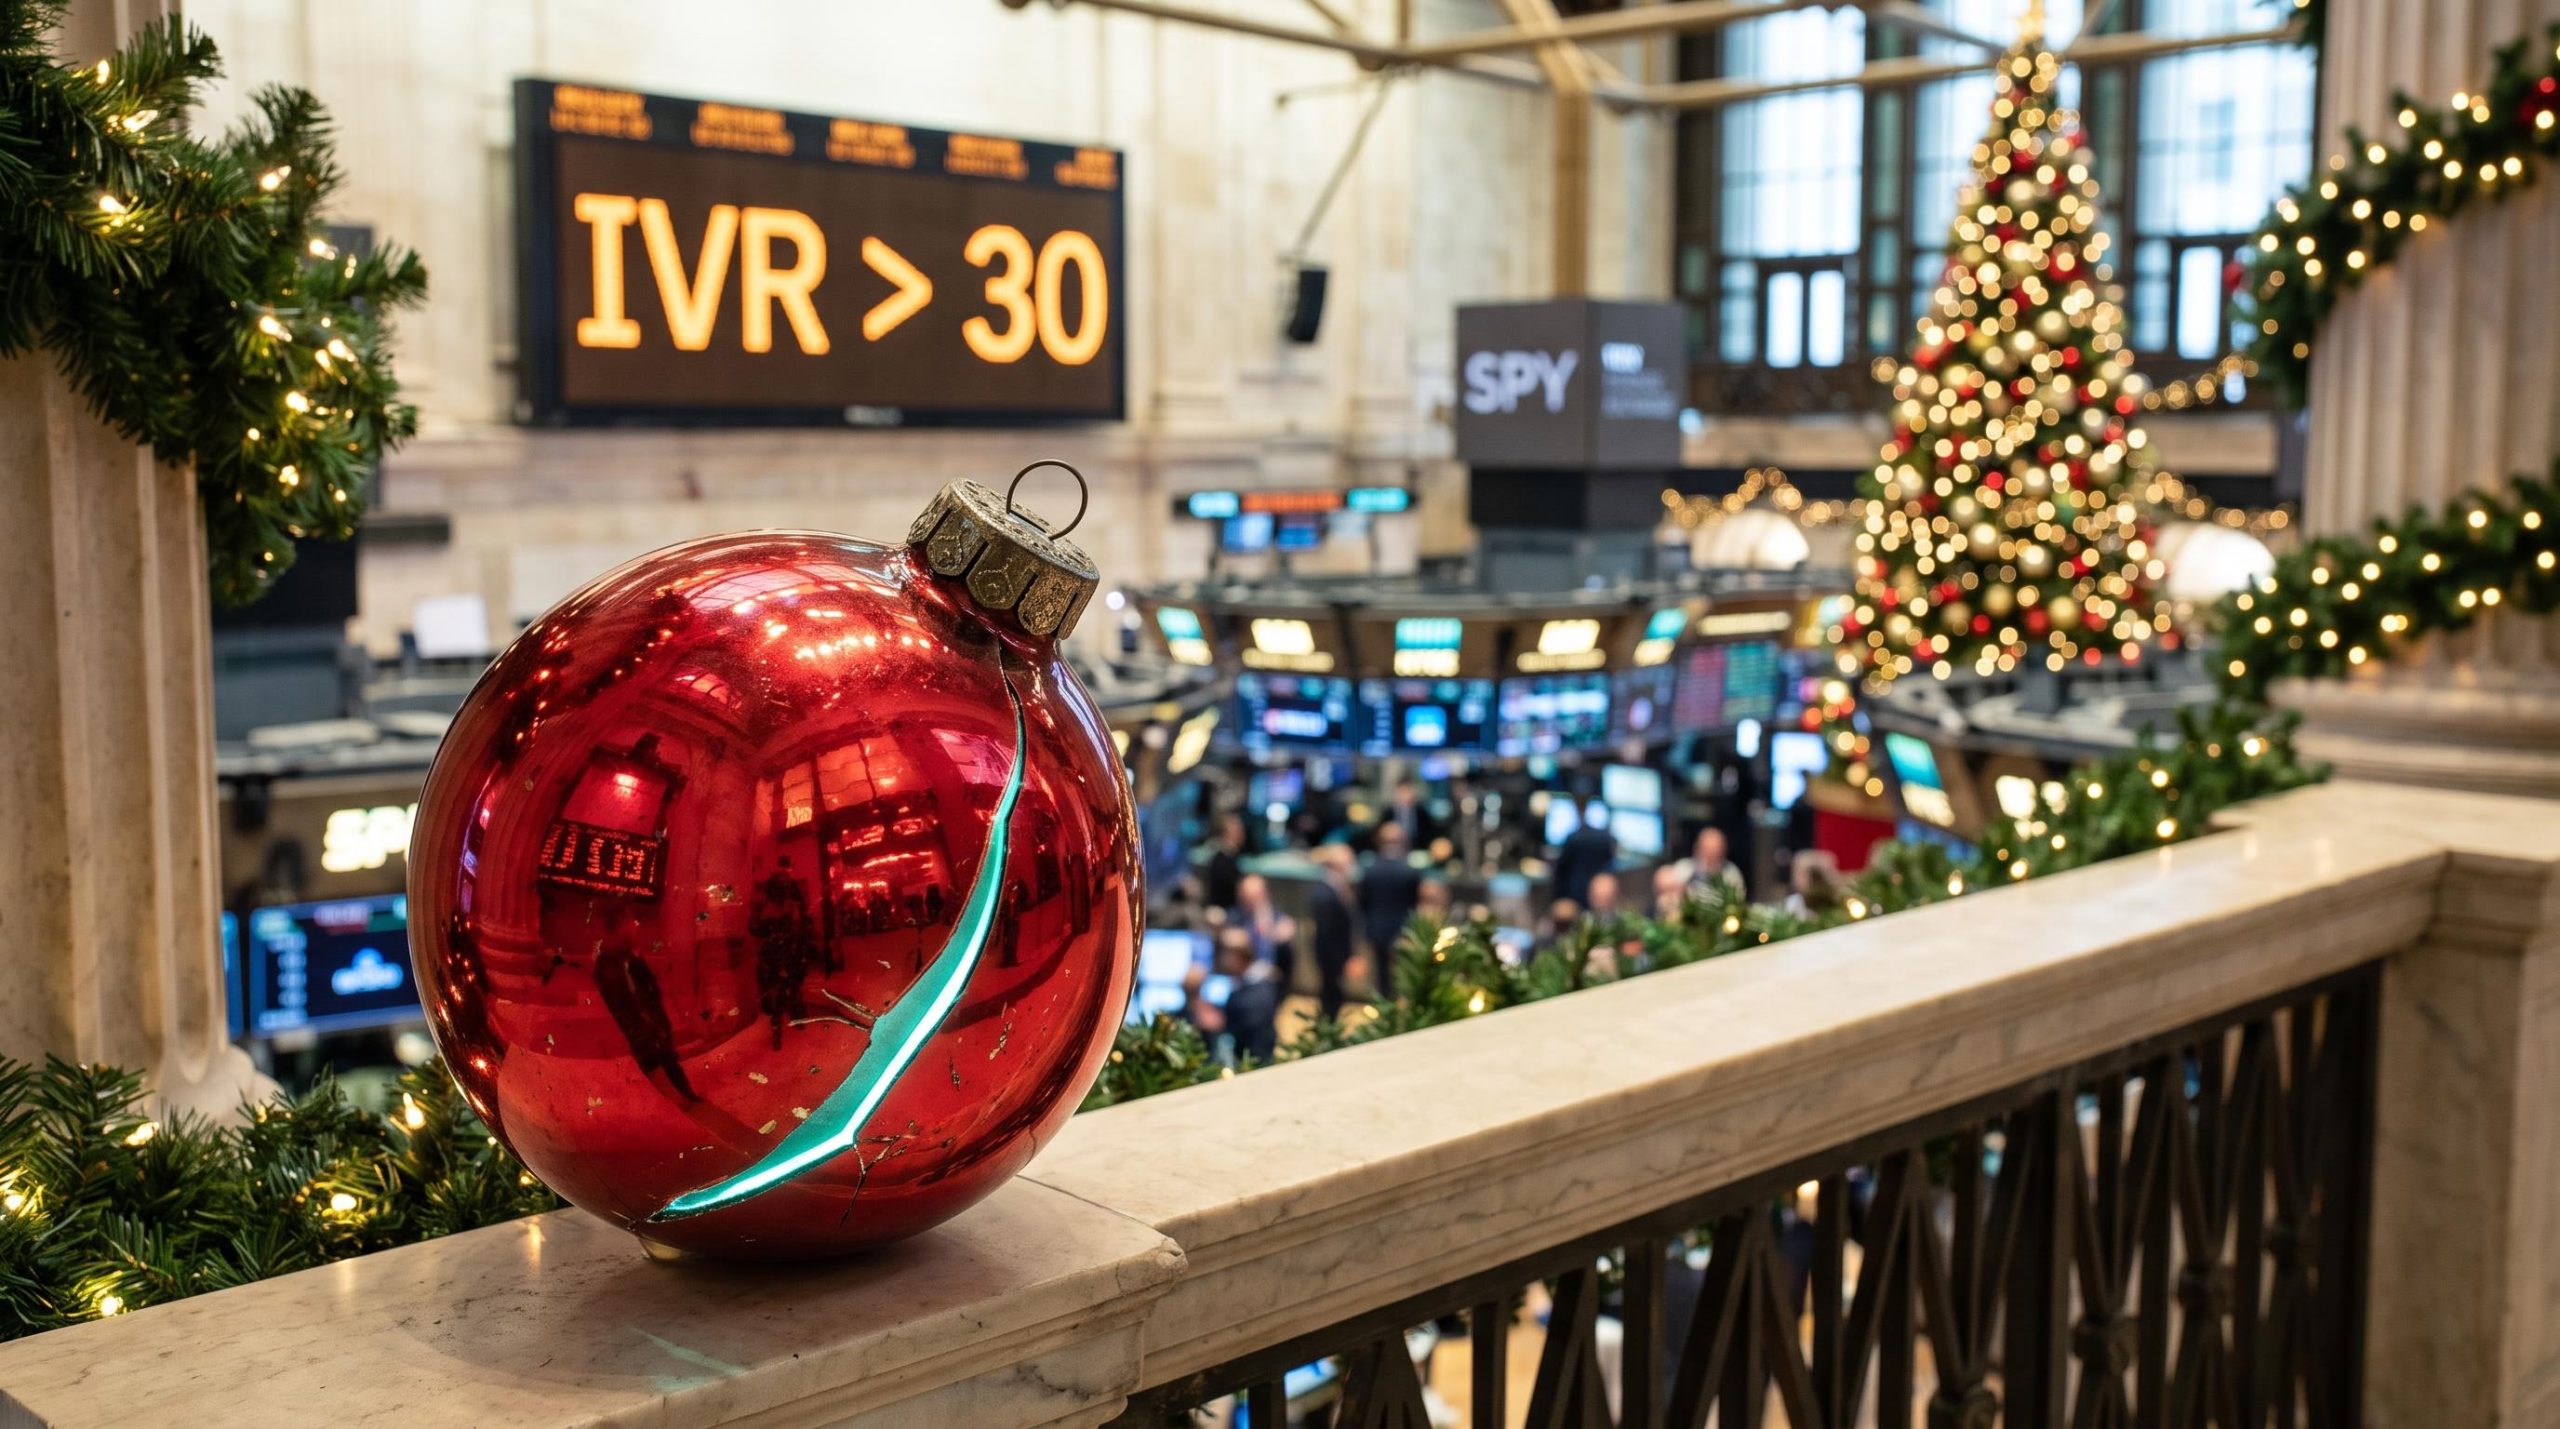
November through January has a reputation as a friendly stretch for anyone selling options premium. Markets are calm, sentiment is warm and the Santa Claus rally sits in the folklore. A recent tastylive backtest of holiday seasonality in SPY suggests the calendar matters far less than which days in that window actually offer rich premium.
The window runs from 1 November to 15 January, so it is already underway. Many traders treat seasonal tendencies as a trading signal, which makes it worth testing whether this one holds.
The study sold 16-delta SPY strangles, entered near 45 days to expiration (DTE) and managed at 21 DTE, then compared the holiday window with the rest of the year. A strangle means selling an out-of-the-money call and an out-of-the-money put at the same time, collecting premium in the hope that the price stays between the two strikes.
Here is what that backtest supports, what it does not, and a checklist you can apply to any seasonal trading claim you come across.
Does the holiday window really flatter SPY, or did one season do the work?
The case for seasonality
The belief has a reasonable foundation. Tax-loss selling, year-end repositioning, institutional cash deployment and holiday sentiment are all proposed drivers that could push year-end prices higher. The historical averages look supportive:
- Cboe: the S&P 500 averaged +1.48% in November and +1.11% in December from 1980 to 2021.
- Stock Trader’s Almanac, cited by Reuters: the Santa Claus period (the last five trading days of December plus the first two of January) has delivered about +1.3% on average.
- Reuters: the S&P 500 gained more than 4% in December 2023 and roughly 24% across calendar 2023.
Those are long-run averages, and averages are where the trouble starts.
What happens when one season is removed
In the tastylive data, holiday-window SPY strength leaned heavily on a single season: 2023-24.
Key finding: Excluding the 2023-24 season, tastylive found holiday-window SPY performance was comparable to the rest of the year.
The more recent record backs that up. A January 2025 tastylive study of the Santa period in SPY, QQQ and DIA over roughly 15 years found a success rate below 50%, with average daily performance not clearly better than ordinary December and January days. LPL Research reported that the 2024-25 Santa period ended negative. Historically, LPL noted, a negative Santa period was followed by average annual S&P 500 returns of about 6.1%, against 10.4% after a positive one, although that is conditional history rather than a signal.
Academic work points the same way. The January effect has historically been concentrated in small caps rather than large-cap indices such as SPY, and it weakened in later samples. A year-by-year SPY return table for the 1 November to 15 January window was not available, which limits how far any average can be pushed.
Rallies, selloffs and crashes can dominate any window. Your first test for any seasonal claim follows from that: ask what the number looks like without its best year. A strong average can be one lucky season in disguise.
Other tastylive work on VIX term-structure signals makes a similar point about era dependence: contango thrust results swung from negative in 2008-2009 to strongly positive after 2020, so the sample chosen drives the headline.
When big ASX news breaks, our subscribers know first
Why high-IVR days are scarcer in the holidays, and what that means for premium sellers
If one season carried the underlying returns, the more durable seasonal signature sits in volatility. Quiet holiday markets sound ideal for sellers, but quiet usually means cheap.
Implied volatility rank (IVR) shows where current implied volatility sits relative to its range over the past year, on a scale of 0 to 100. A reading above 30 suggests premium is relatively rich.
The two readings can diverge sharply after a spike, because IV rank and IV percentile calculate ‘richness’ differently; a single extreme day can depress one while barely moving the other, so checking both before applying a 30 threshold is prudent.
| Metric | Holiday window | Rest of year |
|---|---|---|
| Share of days with IVR above 30 | ~16% | ~37% |
These are tastylive-reported approximations that could not be independently reproduced. They describe how often opportunity appears, not whether holiday volatility is higher. Several forces tend to soften implied volatility at this time of year:
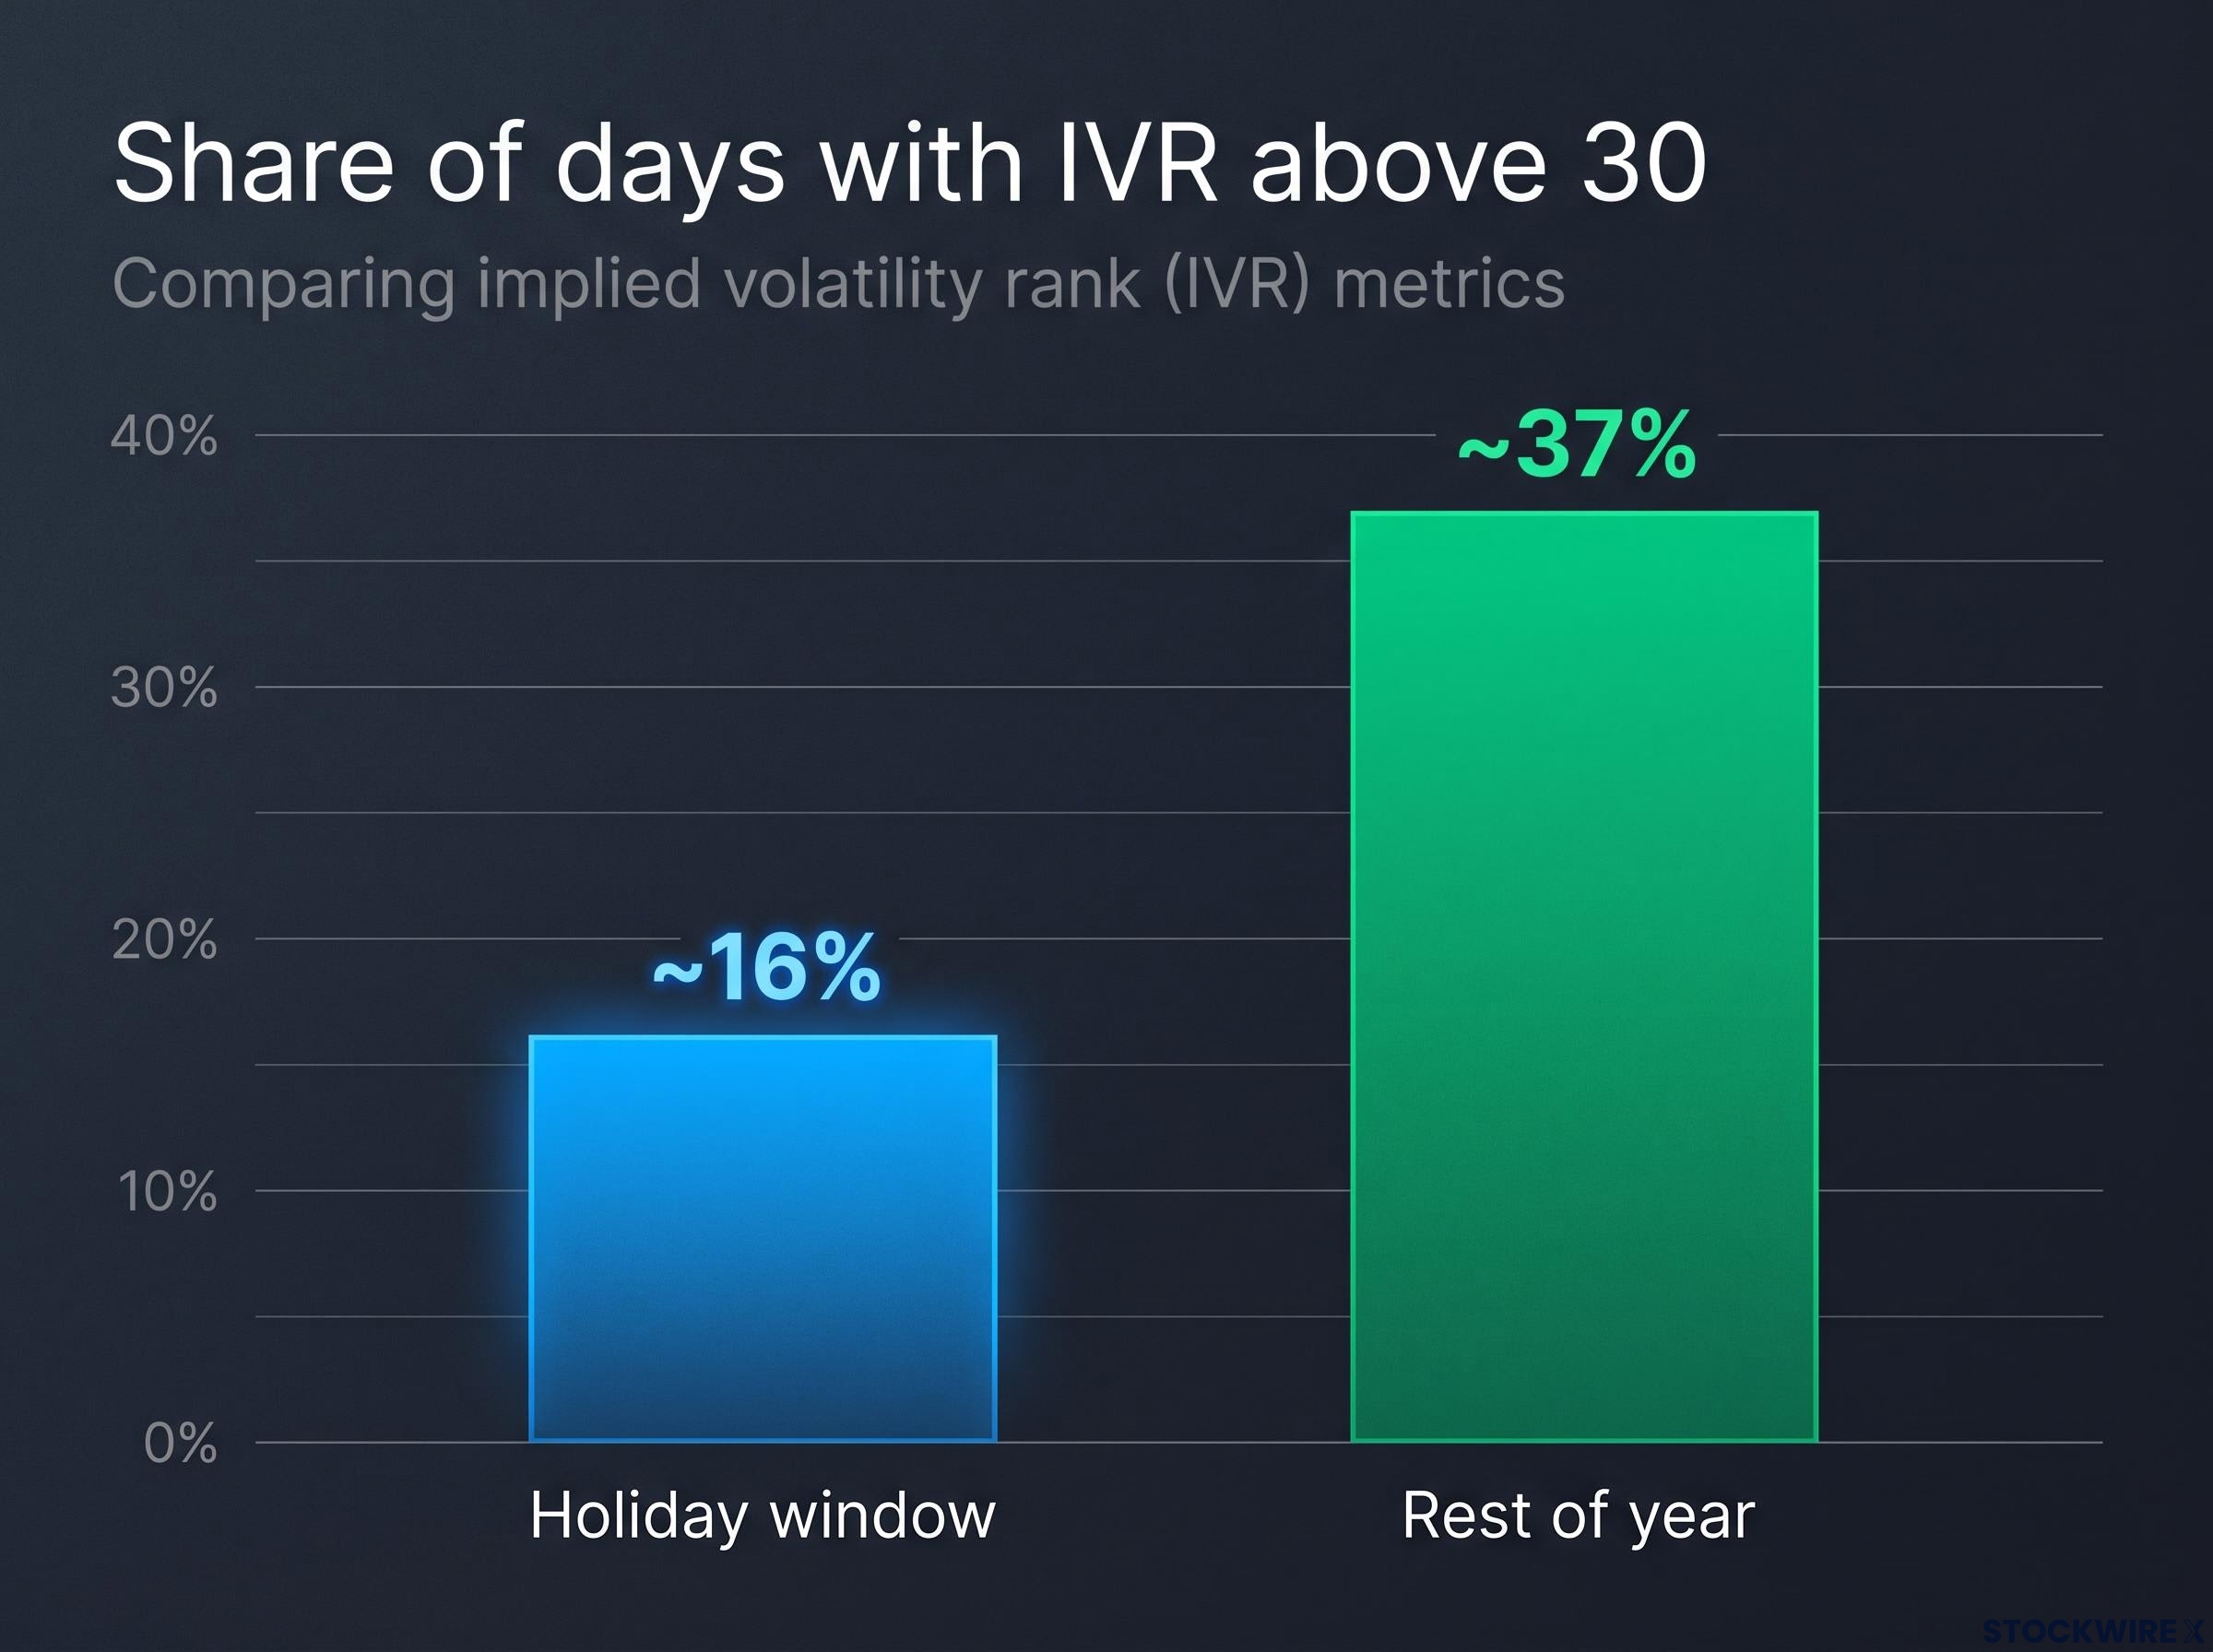
The share of days with IVR above 30 drops to ~16% during the holiday window, compared to ~37% for the rest of the year.
- Thinner participation. Reuters has warned that low holiday volume can leave markets vulnerable to unexpected news or large orders.
- Reduced hedging demand. Cboe reported that SPX skew flattened in the last two weeks of the year as hedging demand dissipated.
- A calmer news calendar, so less near-term movement is priced in.
- Term-structure drift. Cboe data shows the VIX has tended to decline modestly from late October into January.
- Year-end flows, including tax-loss selling, January reinvestment, rebalancing and short covering.
For a seller, the result is smaller credits, narrower strikes for a given delta, lower expected return on buying power and weaker compensation for gap and tail risk. Selling premium because it is November often means selling it cheaply.
Reading today’s volatility against the holiday pattern
This year is starting differently. The VIX closed at 26.85 on 6 November 2026, as reported, with a modestly backwardated Cboe term structure: the 20 November point sat at 26.89 and 18 December at 25.78. Backwardation means near-dated volatility is priced above later-dated volatility, a sign of elevated short-term concern.
That is well above typical holiday softness. SPY IV rank for 7 November was not found, so check your own platform. The question that matters is whether today’s IVR clears your bar, not what month it is.
How did high-IVR SPY strangles perform in the holiday window?
The test design
The backtest split the year into two windows: 1 November to 15 January, and 16 January to 31 October. It sold SPY strangles at about 16 delta (roughly a 16% estimated chance of each strike finishing in the money), entered near 45 DTE and managed at 21 DTE. Results were then divided by IVR, with the focus on readings above 30.
The source is the tastylive Market Measures and tasty RESEARCH episode Holiday Euphoria: What Really Happens?, reported as dated 28 October 2025. Sources conflict on the show date and data end date, with one version describing data through September 2026, and the discrepancy could not be reconciled.
Reading the headline numbers
The favourable result is clear: in high-IVR conditions, the holiday-window setup outperformed the same setup in the rest of the year. Each number needs decoding, though.
| Metric | Reported figure | What it measures | What it does not show |
|---|---|---|---|
| P&L / buying power | ~2.9% | Average return on capital in the holiday window when IVR was above 30 | Returns from selling on every holiday day |
| Win probability | ~88% | Estimated probability of profit at entry | A realised win rate |
| Qualifying trades | 41 | Trades meeting the window and IVR conditions | A large or independent sample |
Buying power is the capital your broker sets aside to hold the position. The 2.9% applies only to the high-IVR subset, and the 88% is a model estimate, not a count of winners.
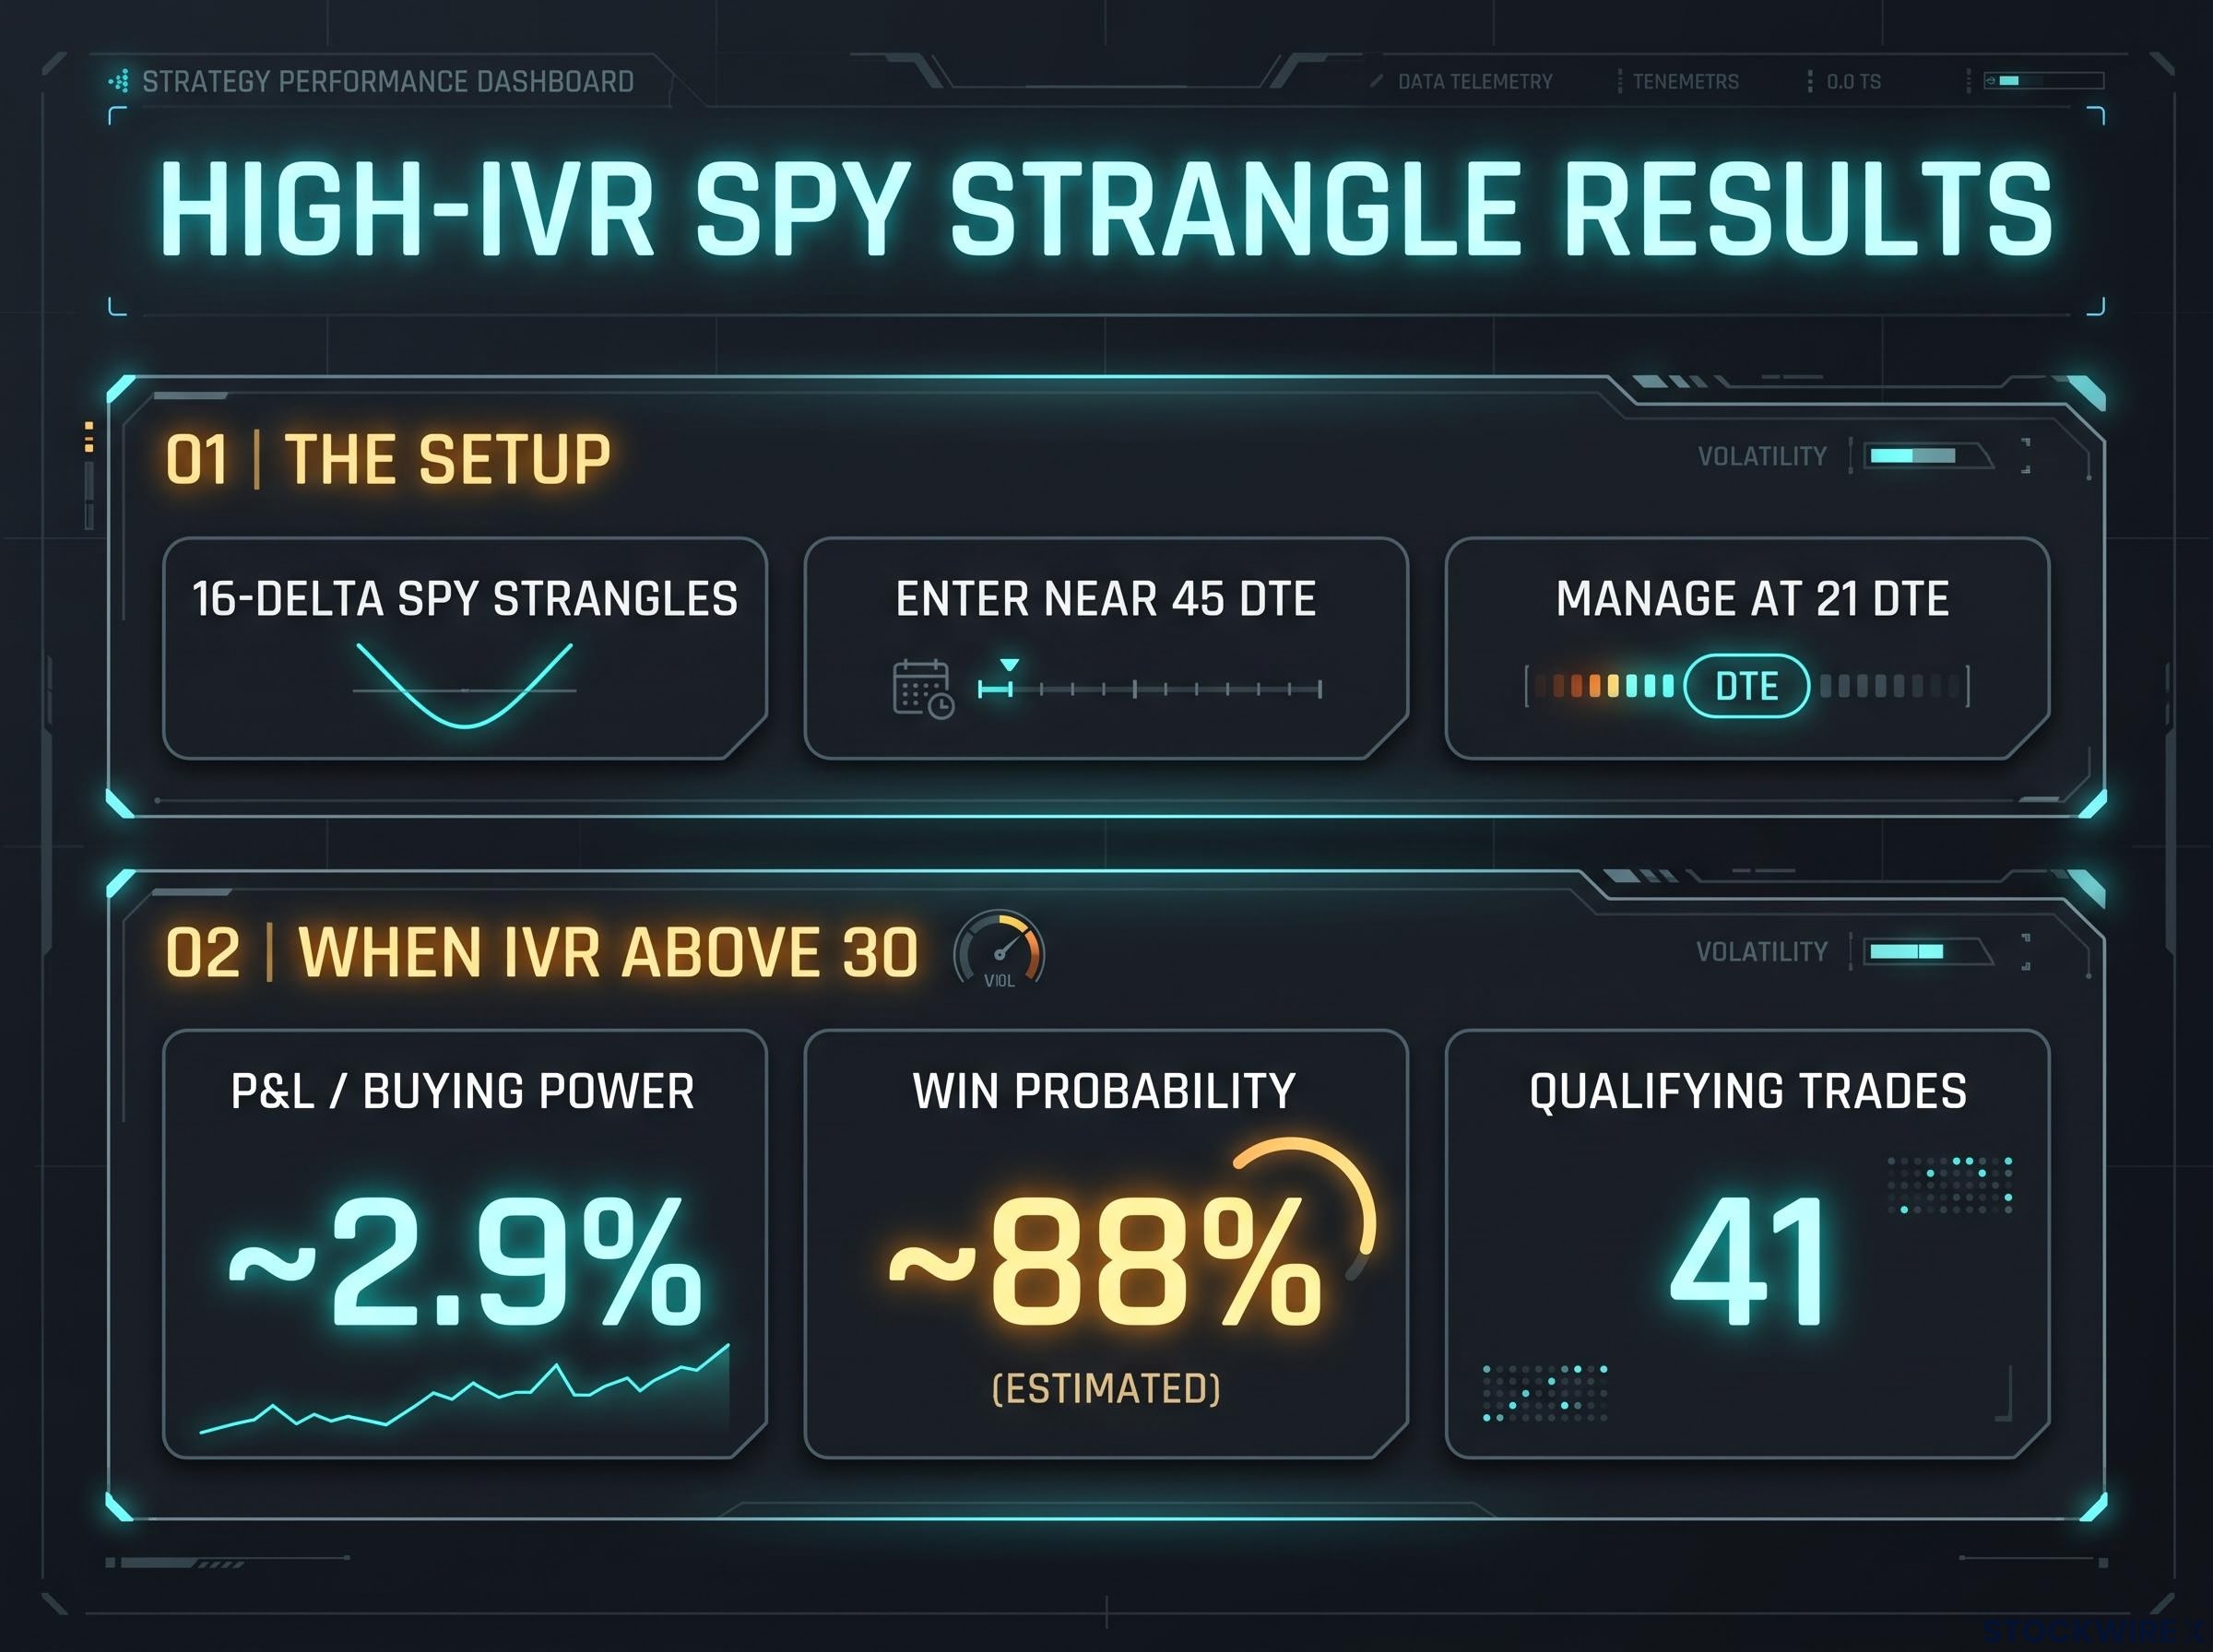
When IVR is above 30, 16-delta SPY strangles yielded a P&L / buying power of ~2.9% and a ~88% (estimated) win probability over 41 qualifying trades.
Where the edge lives: The tested edge comes from waiting for elevated IVR inside the holiday window, not from selling because the calendar says November to January.
Treat the result as a filter. Applying it to every holiday trade would misuse the finding.
How should you judge a seasonal trading claim? Small samples, overlap and hidden choices
Why the sample is thinner than it looks
A seasonal window delivers one observation per year. Daily entries at 45 DTE managed at 21 DTE also overlap heavily, so many trades share the same market moves.
Overlap matters: 41 overlapping trades are not 41 independent bets.
One strong season can lift averages and win rates without improving what you can expect next time. The estimated 88% can also slip in practice: slippage, early assignment, overnight gaps and volatility expansion all reduce realised results.
Definitions add hidden choices. Does the window start on 1 November or the first trading day? Is 15 January included? How exact is the delta, which IVR measure is used, and are fills, commissions and the bid/ask spread counted?
Then there is short-volatility asymmetry. A strangle can collect many small gains in quiet weeks, yet one overnight or thin-liquidity move through a short strike can erase them, especially when the credit was small.
Even a rich-looking premium needs context from implied versus realized volatility in SPY, where implied has exceeded realized roughly 84% of the time over a decade, yet the minority of reversals cluster in regime shifts and hit hardest.
A checklist for any seasonal claim
Use these questions whenever a backtest or calendar pattern lands in front of you:
- How big is the sample? Count years, not just trades.
- What happens without the best season? If the edge vanishes, it was an outlier.
- Do the trades overlap? Overlapping positions shrink the real sample.
- What definitions were chosen? Small changes to dates, delta or IVR measures can move results.
- Is the win rate estimated or realised? Model probabilities are not outcomes.
- Where is the tail exposure? Ask what one gap move would do to your account.
Seasonal failures do happen. The 2024-25 Santa period was negative, and 2024 produced the first loss between Christmas and New Year after a long winning streak. Treat any backtest as a hypothesis, and size positions as if the edge might be smaller than reported or absent.
Using the calendar as context, not a signal, from now to 15 January
Three findings carry the analysis:
- Holiday-window SPY strength leaned on one outlier season, 2023-24.
- High-IVR days appear on about 16% of holiday days versus 37% otherwise.
- The tested edge (about 2.9% P&L over buying power, ~88% estimated win probability, 41 trades) applied only when IVR was above 30.
With the VIX at 26.85 on 6 November, this window has opened with more premium than usual. Watch whether SPY IVR holds above 30 and whether the term structure stays elevated as December approaches. The question to ask each day is whether IVR is above your threshold, not whether it is the holidays.
Passing on a trade is a legitimate outcome, and a low IV rank veto can protect capital when credits are too thin to pay for the gap risk, as one worked single-stock example shows.
This article is for informational purposes only and should not be considered financial advice. Investors should conduct their own research and consult with financial professionals before making investment decisions. Past performance does not guarantee future results. Financial projections are subject to market conditions and various risk factors.