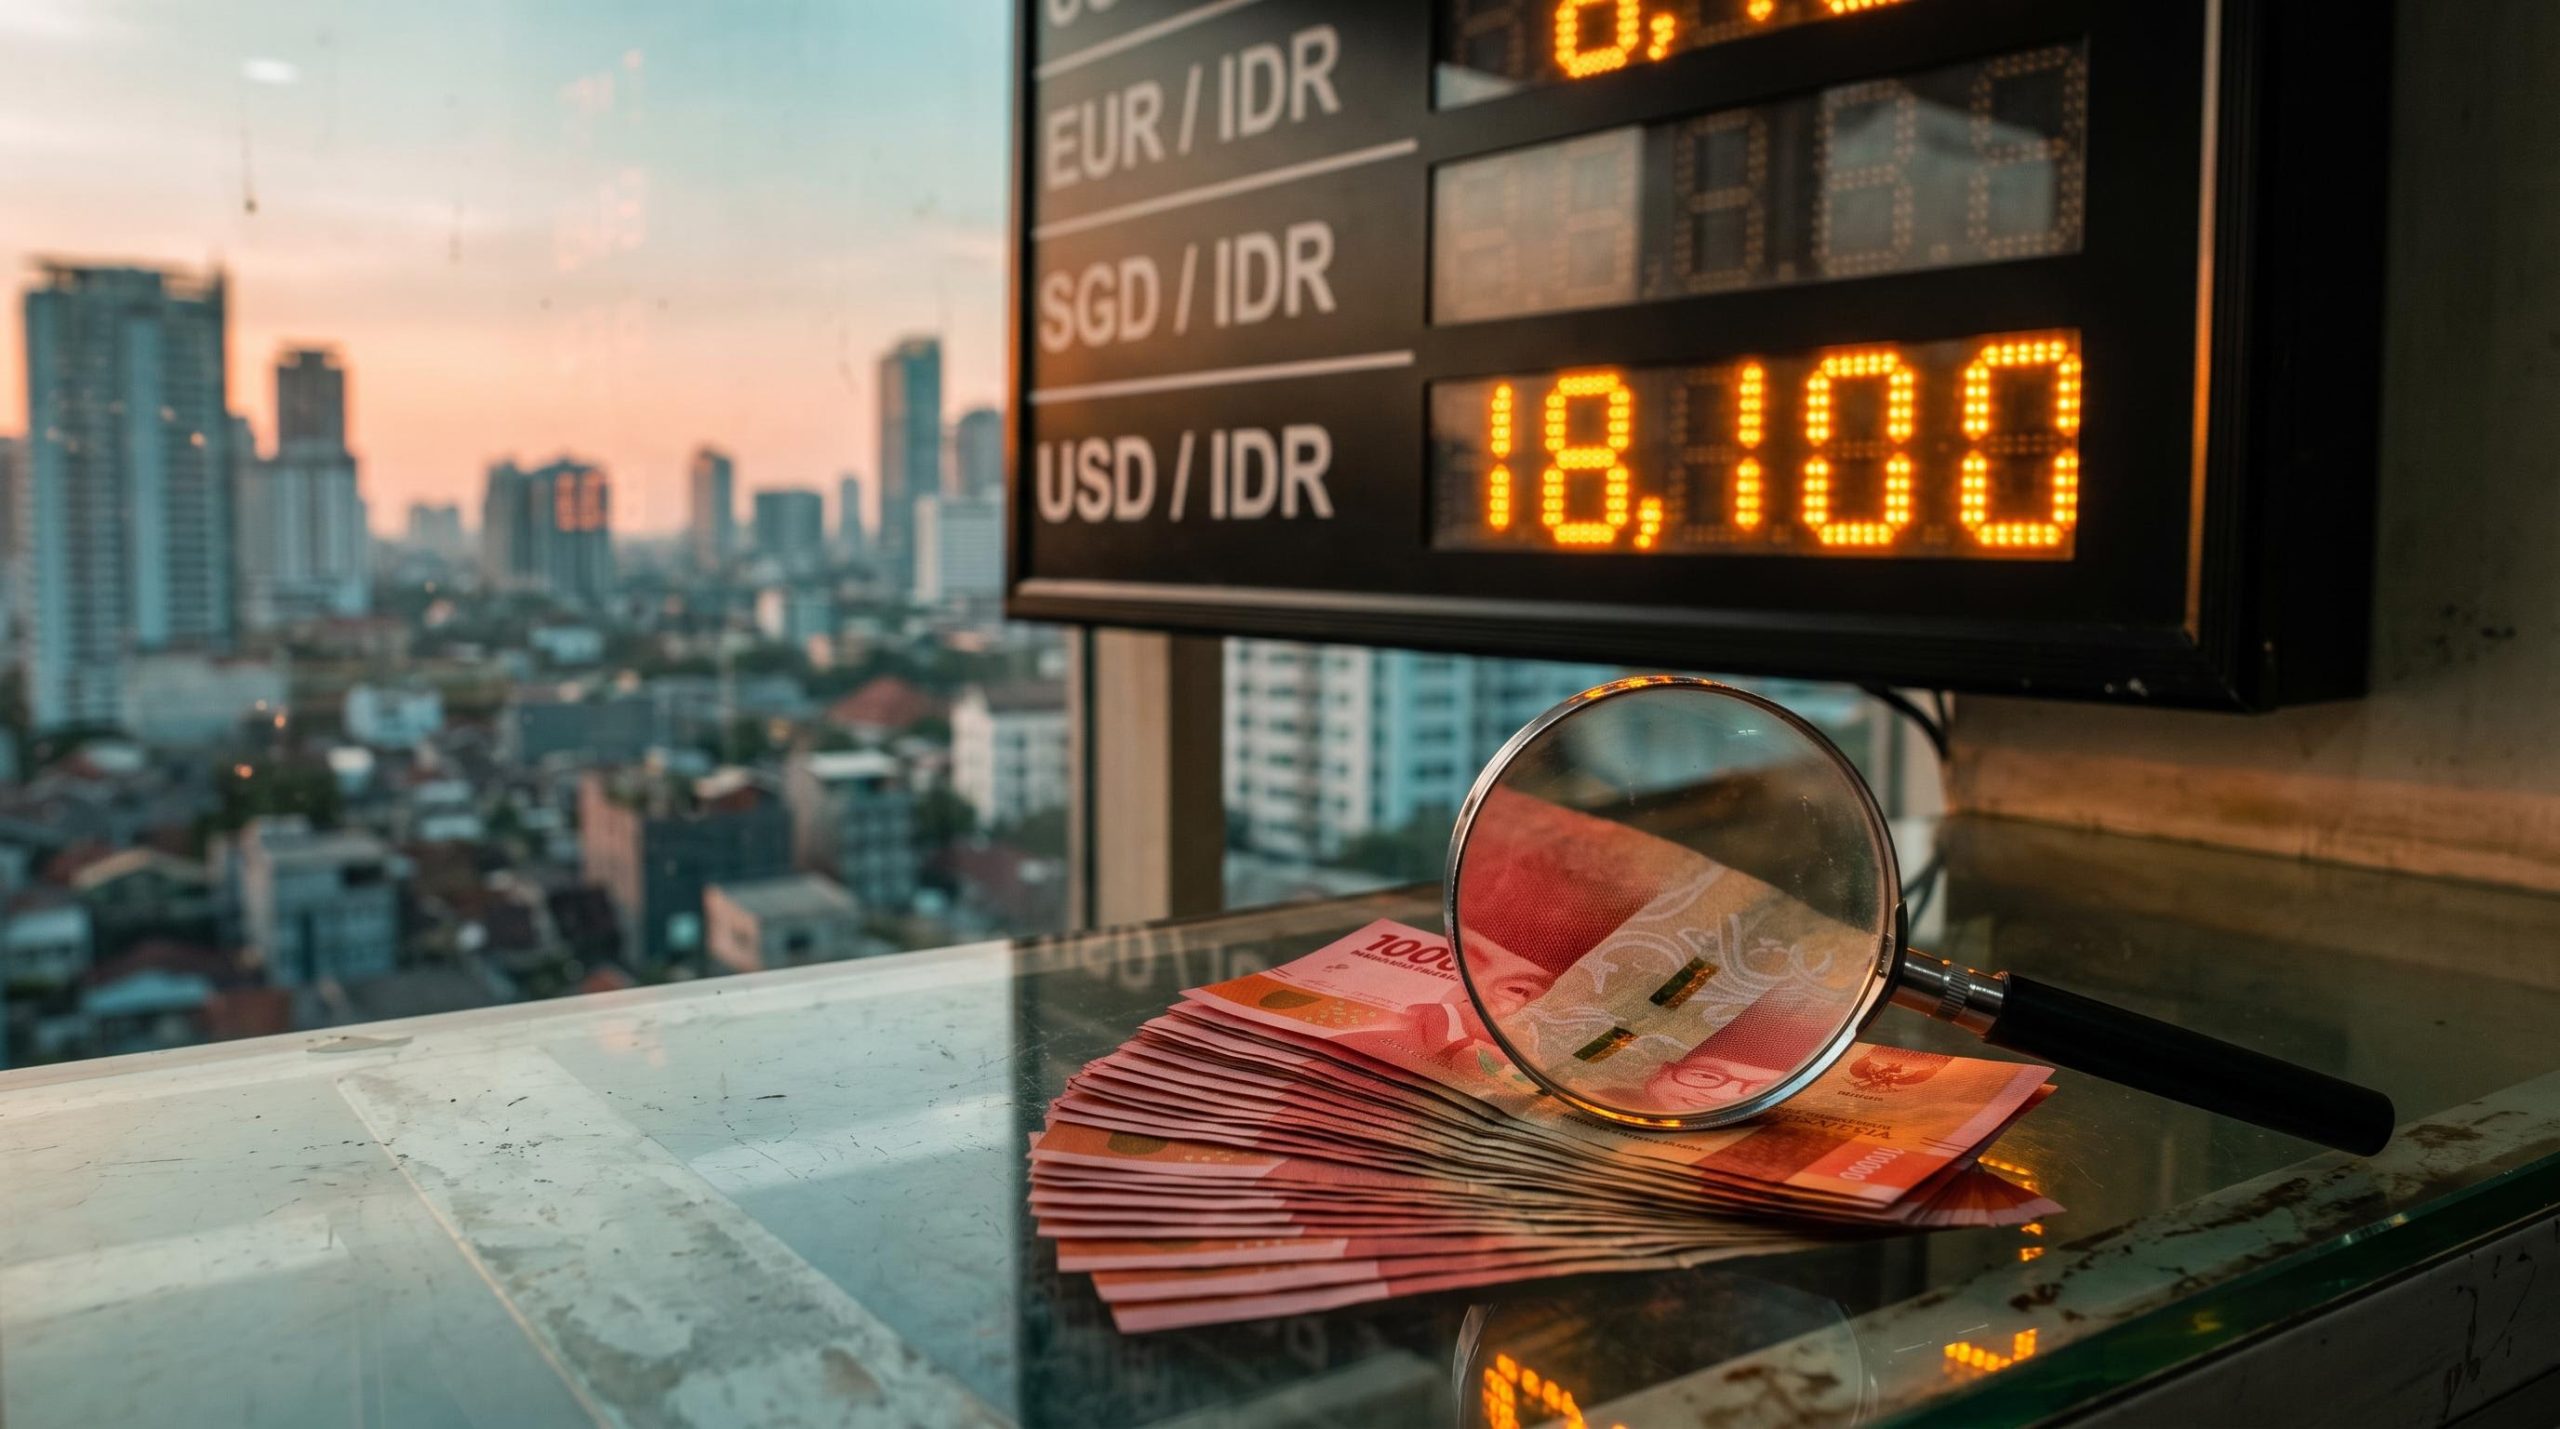
Indonesia’s economy grew 5.47% year-on-year in Q3 2026, beating the roughly 5.2% consensus. The rupiah barely noticed. It still trades near 18,100 per US dollar, close to its record low of 18,196 set in June 2026.
If you assumed a growth beat should lift a currency, that gap is the puzzle worth solving. The Indonesia Rupiah outlook depends on forces that a strong GDP print does not touch.
MUFG remains unconvinced the beat changes much. In a note carried by FXStreet around 6 November 2026, the bank argued that thin foreign portfolio inflows and unresolved doubts among investors make a lasting rebound in the rupiah hard to expect.
That makes Indonesia a useful case study for reading any emerging-market currency. You will come away knowing which signals move an exchange rate more than GDP does, and the short list of indicators worth tracking for Indonesia from here.
Why did a 5.47% growth beat leave the rupiah unmoved?
On paper, the numbers look like good news. Statistics Indonesia (BPS) reported 5.47% annual growth for Q3 on 5 November 2026, up from 5.29% in Q2 and ahead of the 5.18% Reuters poll and the 5.2% Bloomberg survey. Quarter-on-quarter, output rose 1.59%.
The currency told a different story. USD/IDR traded around 18,100-18,118 on 6-7 November, leaving the rupiah down about 8.5% for the year and within touching distance of its June low.
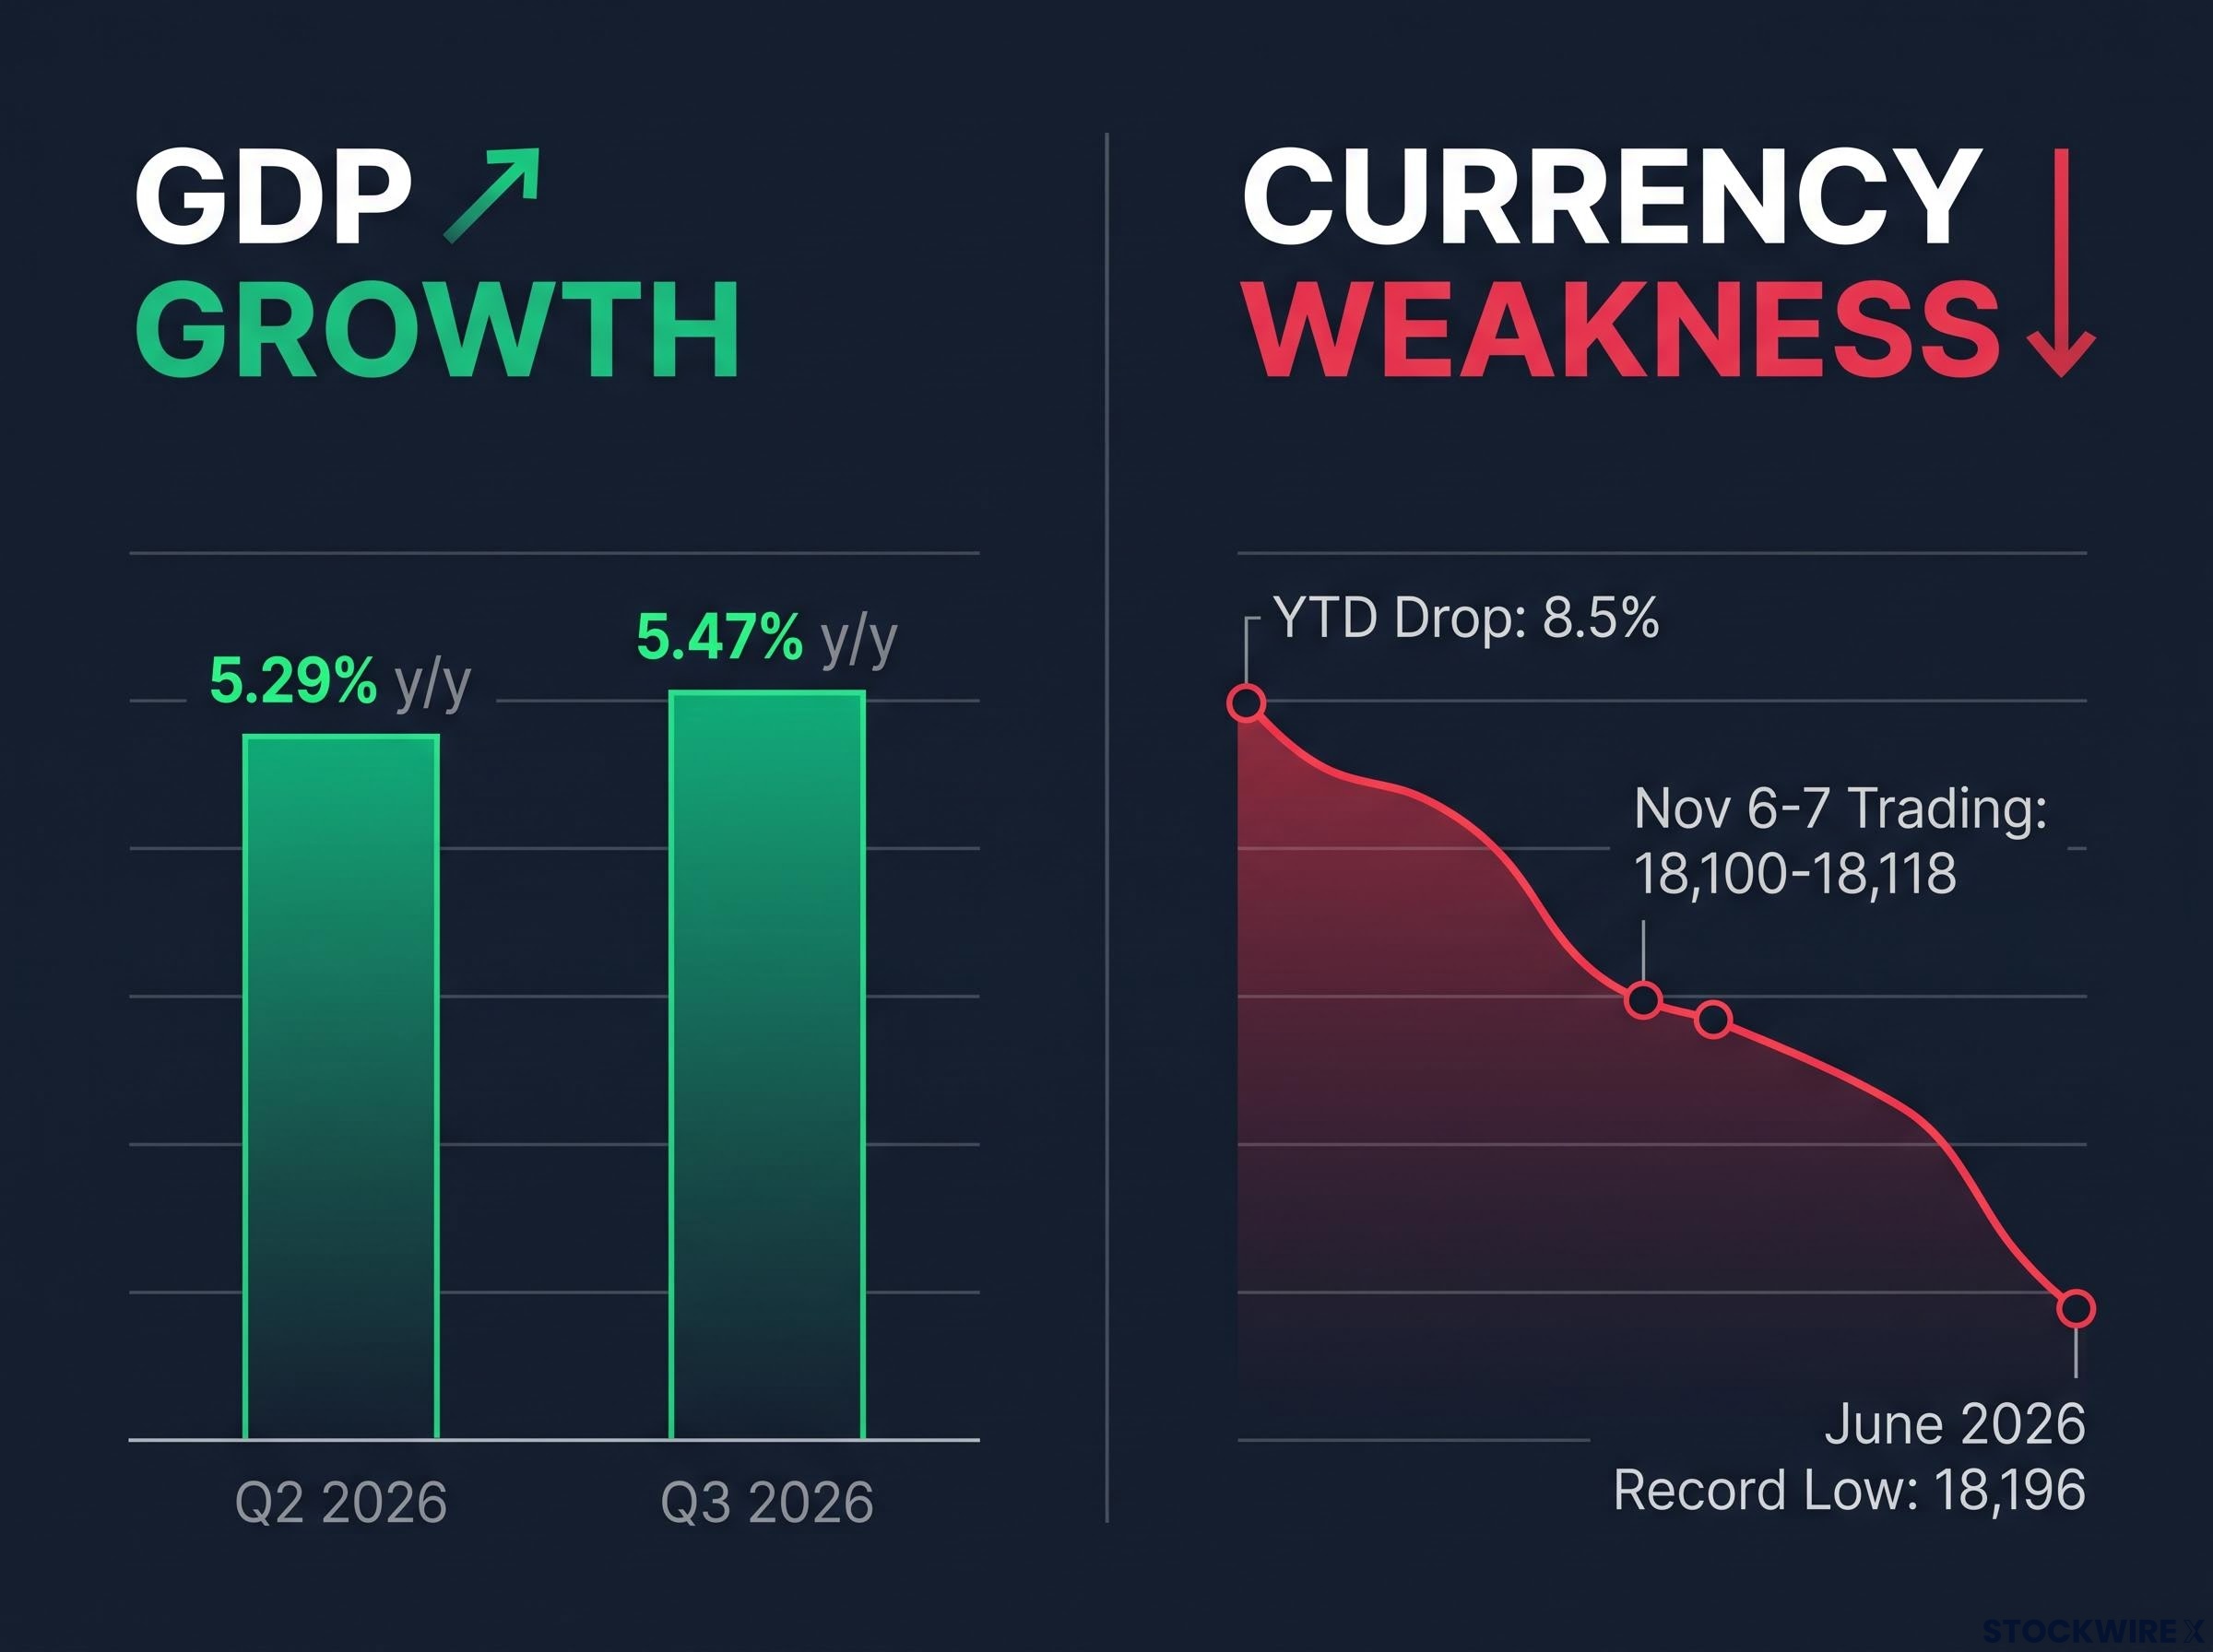
Indonesia’s Q3 2026 GDP grew 5.47%, yet the Rupiah fell 8.5% year-to-date to trade around 18,100-18,118 near its June record low of 18,196.
What the expenditure mix says
The breakdown explains the disconnect. According to BPS data and Reuters-related coverage, here is what drove the quarter:
| Measure | Q3 2026 growth (y/y) | Note |
|---|---|---|
| Real GDP | 5.47% | Above Reuters and Bloomberg consensus |
| Household consumption | 5.04% | Broadly unchanged from prior quarter |
| Investment | 6.06% | Strong domestic driver |
| Exports | 4.59% | Accelerated, but trailed imports |
| Imports | 7.31% | Adds to demand for US dollars |
| Government consumption | 8.95% | Fastest-growing component |
Imports grew at 7.31% while exports managed 4.59%. Every extra import has to be paid for, and that pushes dollar demand up just when the rupiah needs support.
Energy adds to the import strain: a widening energy import bill, with an oil and gas deficit of $2.54 billion in August, shows how Middle East tensions can feed straight into dollar demand.
Government consumption, expanding at 8.95%, did heavy lifting too. That supports near-term output but raises the very fiscal questions foreign investors are already pricing.
MUFG drew the policy conclusion plainly:
MUFG on the Q3 beat Solid spending and investment mean Bank Indonesia feels less pressure to back the economy, yet faster growth barely eases worries about investor trust. Thin portfolio inflows and home-grown risks should keep the rupiah from mounting a lasting rebound.
Here is the read you should take from it. GDP measures what Indonesia produces; the currency prices what foreign investors expect to earn and keep. The beat improved the first without changing the second.
When big ASX news breaks, our subscribers know first
Why strong GDP and a weak currency can coexist
The mechanics in plain terms
Start with one principle. Gross domestic product counts the goods and services a country makes, while an exchange rate reflects how much the world wants to own that country’s financial assets.
Those two can move apart for long stretches. Four channels usually explain the gap:
- Portfolio flows: foreign buying or selling of local stocks and bonds sets day-to-day currency demand.
- Rate differentials: the extra yield over US assets, after hedging costs and expected currency losses.
- Fiscal credibility: confidence that government borrowing and spending stay under control.
- Central-bank independence: belief that the central bank sets policy free of government pressure.
Yield alone rarely settles the argument. Bank Indonesia’s benchmark BI-Rate sits at 5.75%, but that offers little comfort if an investor expects the rupiah to lose more than the interest earned. Investors weigh that return against US Treasuries, hedging costs, governance risk and how easily they can exit.
Credibility is where 2026 has bitten hardest. Reuters reported that the June record low came amid concerns over fiscal management and BI’s independence.
Bank Indonesia leadership succession earlier in 2026 had already shown how quickly the rupiah reacts to central-bank credibility, with a clean nomination removing a leadership risk premium that had weighed on the currency for weeks.
What 2013 teaches about 2026
Indonesia has seen this before. During the 2013 US Federal Reserve taper tantrum, IMF analysis found that heavily affected emerging markets, Indonesia among them, saw average currency falls of about 13.5%, bond yields up roughly 2.5 percentage points and equities down around 13.75% between May and August.
A separate Reuters comparison put the rupiah’s slide at about 17% over five months, though that figure is secondary. Either way, respectable growth offered no shield once investors repriced the risk of financing Indonesia from abroad.
The triggers today differ: MSCI-related market concerns, fiscal doubts, governance questions and oil prices. The chain reaction does not:
- Foreign investors cut exposure.
- Local bonds and equities weaken.
- The currency falls.
- Import costs rise, feeding inflation and external strain.
- The central bank must choose between tighter policy, intervention or accepting more depreciation.
So when you see strong growth beside a falling currency, your first question should be what foreign investors are doing with that country’s bonds and shares. GDP comes later.
What the flow data and Bank Indonesia’s response reveal
The flow figures look contradictory at first glance. BI reported a Q3 net portfolio outflow of US$80 million, mainly equity selling, yet a cumulative net inflow of US$13.23 billion from January through 23 October.
Both can be true. They cover different instruments and windows, and bond buying has been masking stock selling.
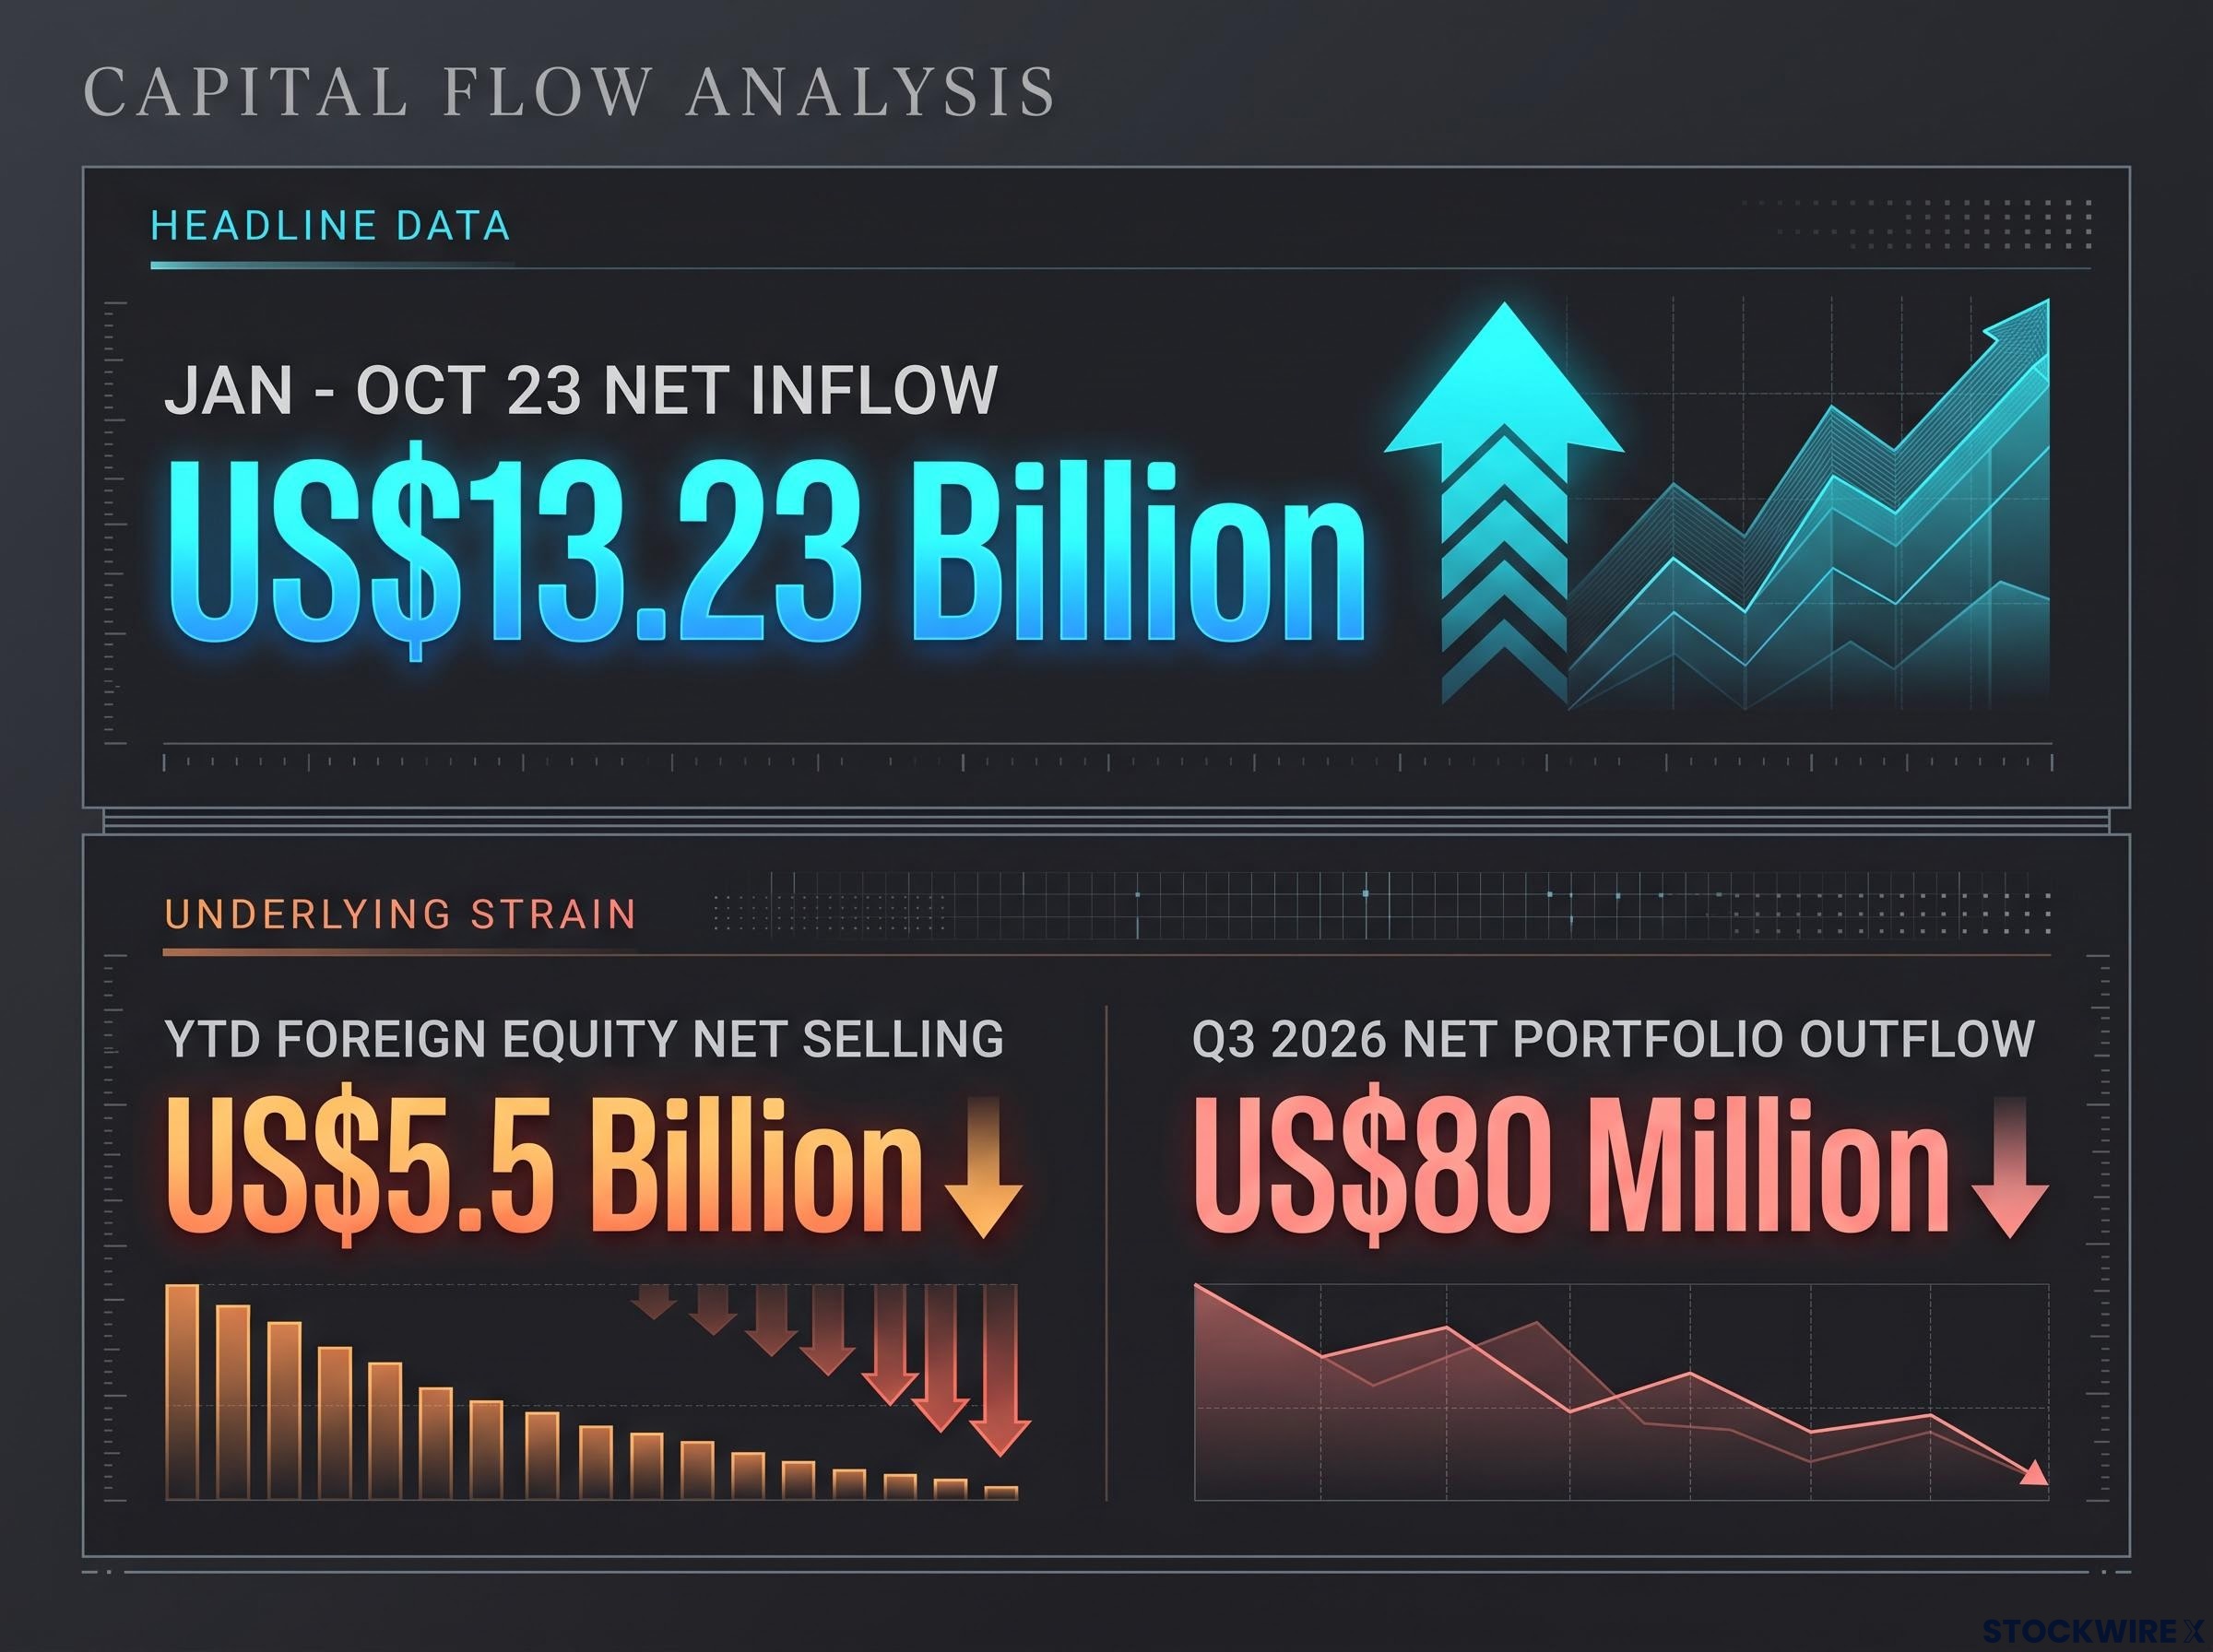
Despite a US$13.23 billion net inflow from January to October 23, underlying strain shows US$5.5 billion in YTD foreign equity net selling.
| Measure | Figure | What it signals |
|---|---|---|
| Q3 2026 net portfolio flow (BI) | US$80M outflow | Driven mainly by equity selling |
| October to 23 October (BI) | US$40M inflow | Government bonds and SRBI buying |
| January to 23 October (BI) | US$13.23B inflow | Headline total flattered by debt flows |
| Foreign equity net selling, year-to-date | About US$5.5B | Largest annual equity outflow in a decade, per FSM Global |
SRBI are short-term rupiah securities issued by Bank Indonesia. They attract yield-seeking money, but equity flows are the better gauge of long-term confidence. Roughly US$5.5 billion of stock selling is the real signal.
The MSCI downgrade threat adds a mechanical layer to the equity story: UBS has estimated that a completed reclassification could trigger roughly US$4bn in passive outflows, with far larger active selling possible on top.
That context explains BI’s choices at its 20-21 October meeting. It did not cut rates after the growth beat:
- BI-Rate held at 5.75%
- Deposit Facility rate raised to 5.00%
- Lending Facility rate held at 6.50%
- Intervention continued in spot, offshore non-deliverable forward (NDF) and domestic NDF (DNDF) markets
- Larger premium reductions on certain DNDF hedging linked to portfolio inflows, foreign loans and direct investment
This is a stability-first stance. Intervention smooths disorderly moves, but it cannot permanently replace foreign appetite for Indonesian assets. Fitch has reportedly warned that sustained intervention could erode external buffers, a view not independently confirmed.
For you, the lesson is to read flow breakdowns, not totals. A healthy headline inflow can sit on top of an equity line showing serious strain.
Where the Indonesia Rupiah outlook could turn: bearish and constructive paths
The case for further weakness and the case for recovery both have credible backers. Several views below come from commentary not independently verified, so treat them as indicative.
| Scenario | Drivers | Supporting views |
|---|---|---|
| Bearish | Equity outflows, rupiah near record low, fiscal and state-linked investment questions, fast import growth, strong dollar, oil prices | MUFG; Fitch, BNP Paribas and IMF-related analysis (unverified) |
| Constructive | Growth near 5%, inflation within target, stronger bond flows, BI willing to defend the currency, new policy appointments | DPAM sees a confidence correction, not a fundamentals collapse (unverified) |
The forecasts spread wide. OCBC reportedly expects USD/IDR at 18,100 by end-2026, a possible 18,200 peak in Q1 2027 and 17,850 by end-2027. DBS’s Radhika Rao suggested a near-term 17,600-17,800 range in September, conditional on fiscal credibility, a call already overtaken by events.
That dispersion is the point. There is no consensus, only competing bets on confidence.
These forecasts are speculative and subject to change based on market developments. Past performance does not guarantee future results.
Which path plays out likely hinges on four variables:
- Foreign equity flows: a sustained return of stock buying.
- Fiscal credibility: clearer discipline on deficits and state-linked spending.
- BI independence: visible separation between fiscal policy and the central bank.
- Global dollar conditions: a softer dollar and lower US yields.
Another GDP surprise is not on that list. Any recovery will most likely show up first in equity flows and fiscal signals, so watch those before the next growth print.
What this case teaches about reading emerging-market currencies
Indonesia’s growth beat was real. The rupiah simply prices something else: confidence, capital flows and policy credibility.
Four habits will serve you with any emerging-market currency:
- Check what drove GDP before calling it currency-positive.
- Separate equity flows from bond flows.
- Compare yields after hedging costs and expected depreciation.
- Watch fiscal and central-bank credibility closely.
For Indonesia, your watch list is short. Track whether foreign investors start buying stocks again, whether fiscal policy tightens up, whether BI’s independence looks secure and whether the dollar loosens its grip.
The split between bond and stock flows is a wider emerging-market pattern, and the case for EM debt versus equities rests on carry, currency appreciation and diversification advantages that broad equity indices lack.
This article is for informational purposes only and should not be considered financial advice. Investors should conduct their own research and consult with financial professionals before making investment decisions.