
Washington H. Soul Pattinson has paid an unbroken dividend for more than a century. That record is remarkable, but an unbroken record and a genuinely attractive income stock are not the same thing, and Australian investors searching for yield in 2025 need to understand the difference. SOL has appreciated approximately 13.7% since the start of 2025, trading around $42.41 as at 26 May 2026, and delivers a trailing yield of roughly 2.4% on FY25’s total ordinary dividend of 103 cents per share, fully franked. That combination of modest yield and meaningful capital gain raises a natural question for income-focused investors: what analytical lens actually applies here? This piece works through SOL’s financial metrics, explains why standard benchmarks such as return on equity (ROE) need adjustment for holding companies, assesses the NTA valuation picture, and delivers a clear-eyed view of where Washington H. Soul Pattinson shares fit in an income-focused Australian portfolio.
A 120-year-old business with a portfolio built for the long run
Washington H. Soul Pattinson is not a listed investment company in the strict legal sense, though it is frequently grouped with LIC-style vehicles in Australian financial commentary. It is a diversified investment company, founded in 1903 and the second-longest continuously listed entity on the ASX.
Two holdings anchor the portfolio. An approximately 39% stake in New Hope Corporation (ASX: NHC) provides significant coal-derived income and dividend flow. A strategic position in TPG Telecom (ASX: TPG) adds a defensive telecommunications exposure. Around those pillars, the portfolio spans:
- Listed equities
- Private equity
- Structured credit
- Property and unlisted infrastructure
Portfolio scale: Pre-tax portfolio NAV stood at approximately $11.8 billion as at 30 June / 31 July 2024, placing WHSP among Australia’s largest diversified investment vehicles.
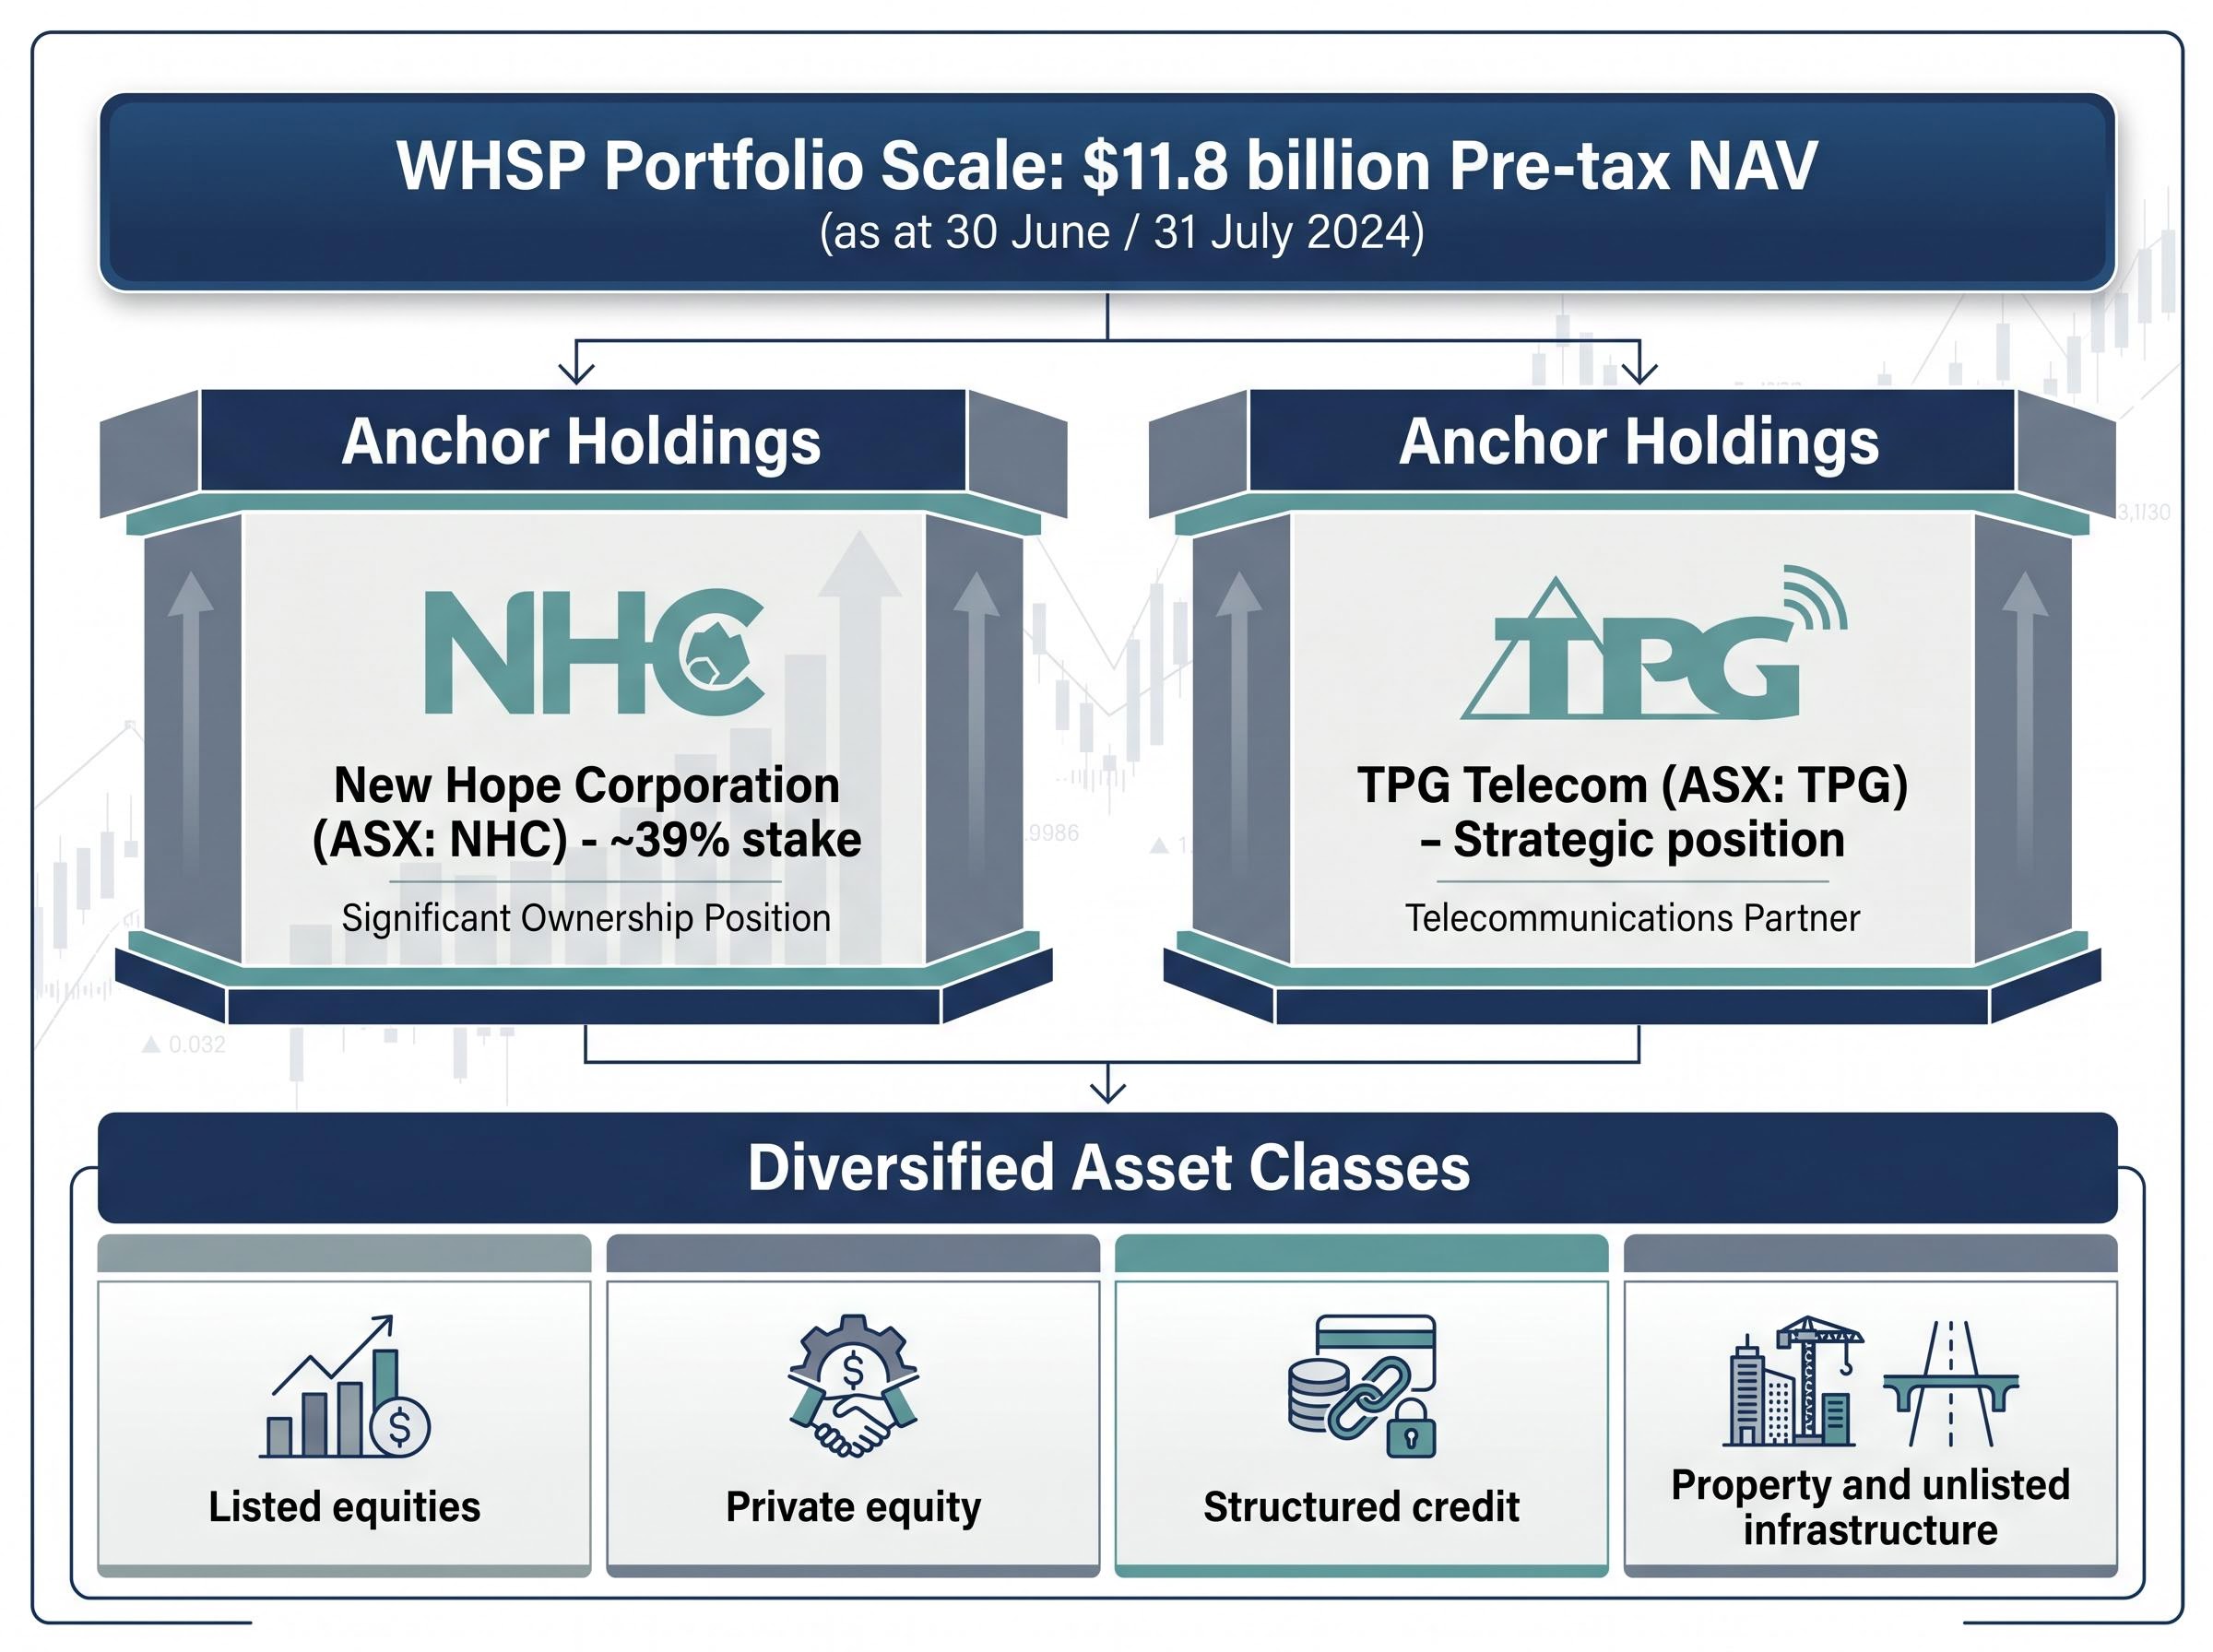
That scale matters. The financial metrics that follow only make sense when read against a business whose underlying assets span commodity cycles, private markets, and defensive sectors simultaneously.
When big ASX news breaks, our subscribers know first
What SOL’s FY24 and FY25 financials actually tell income investors
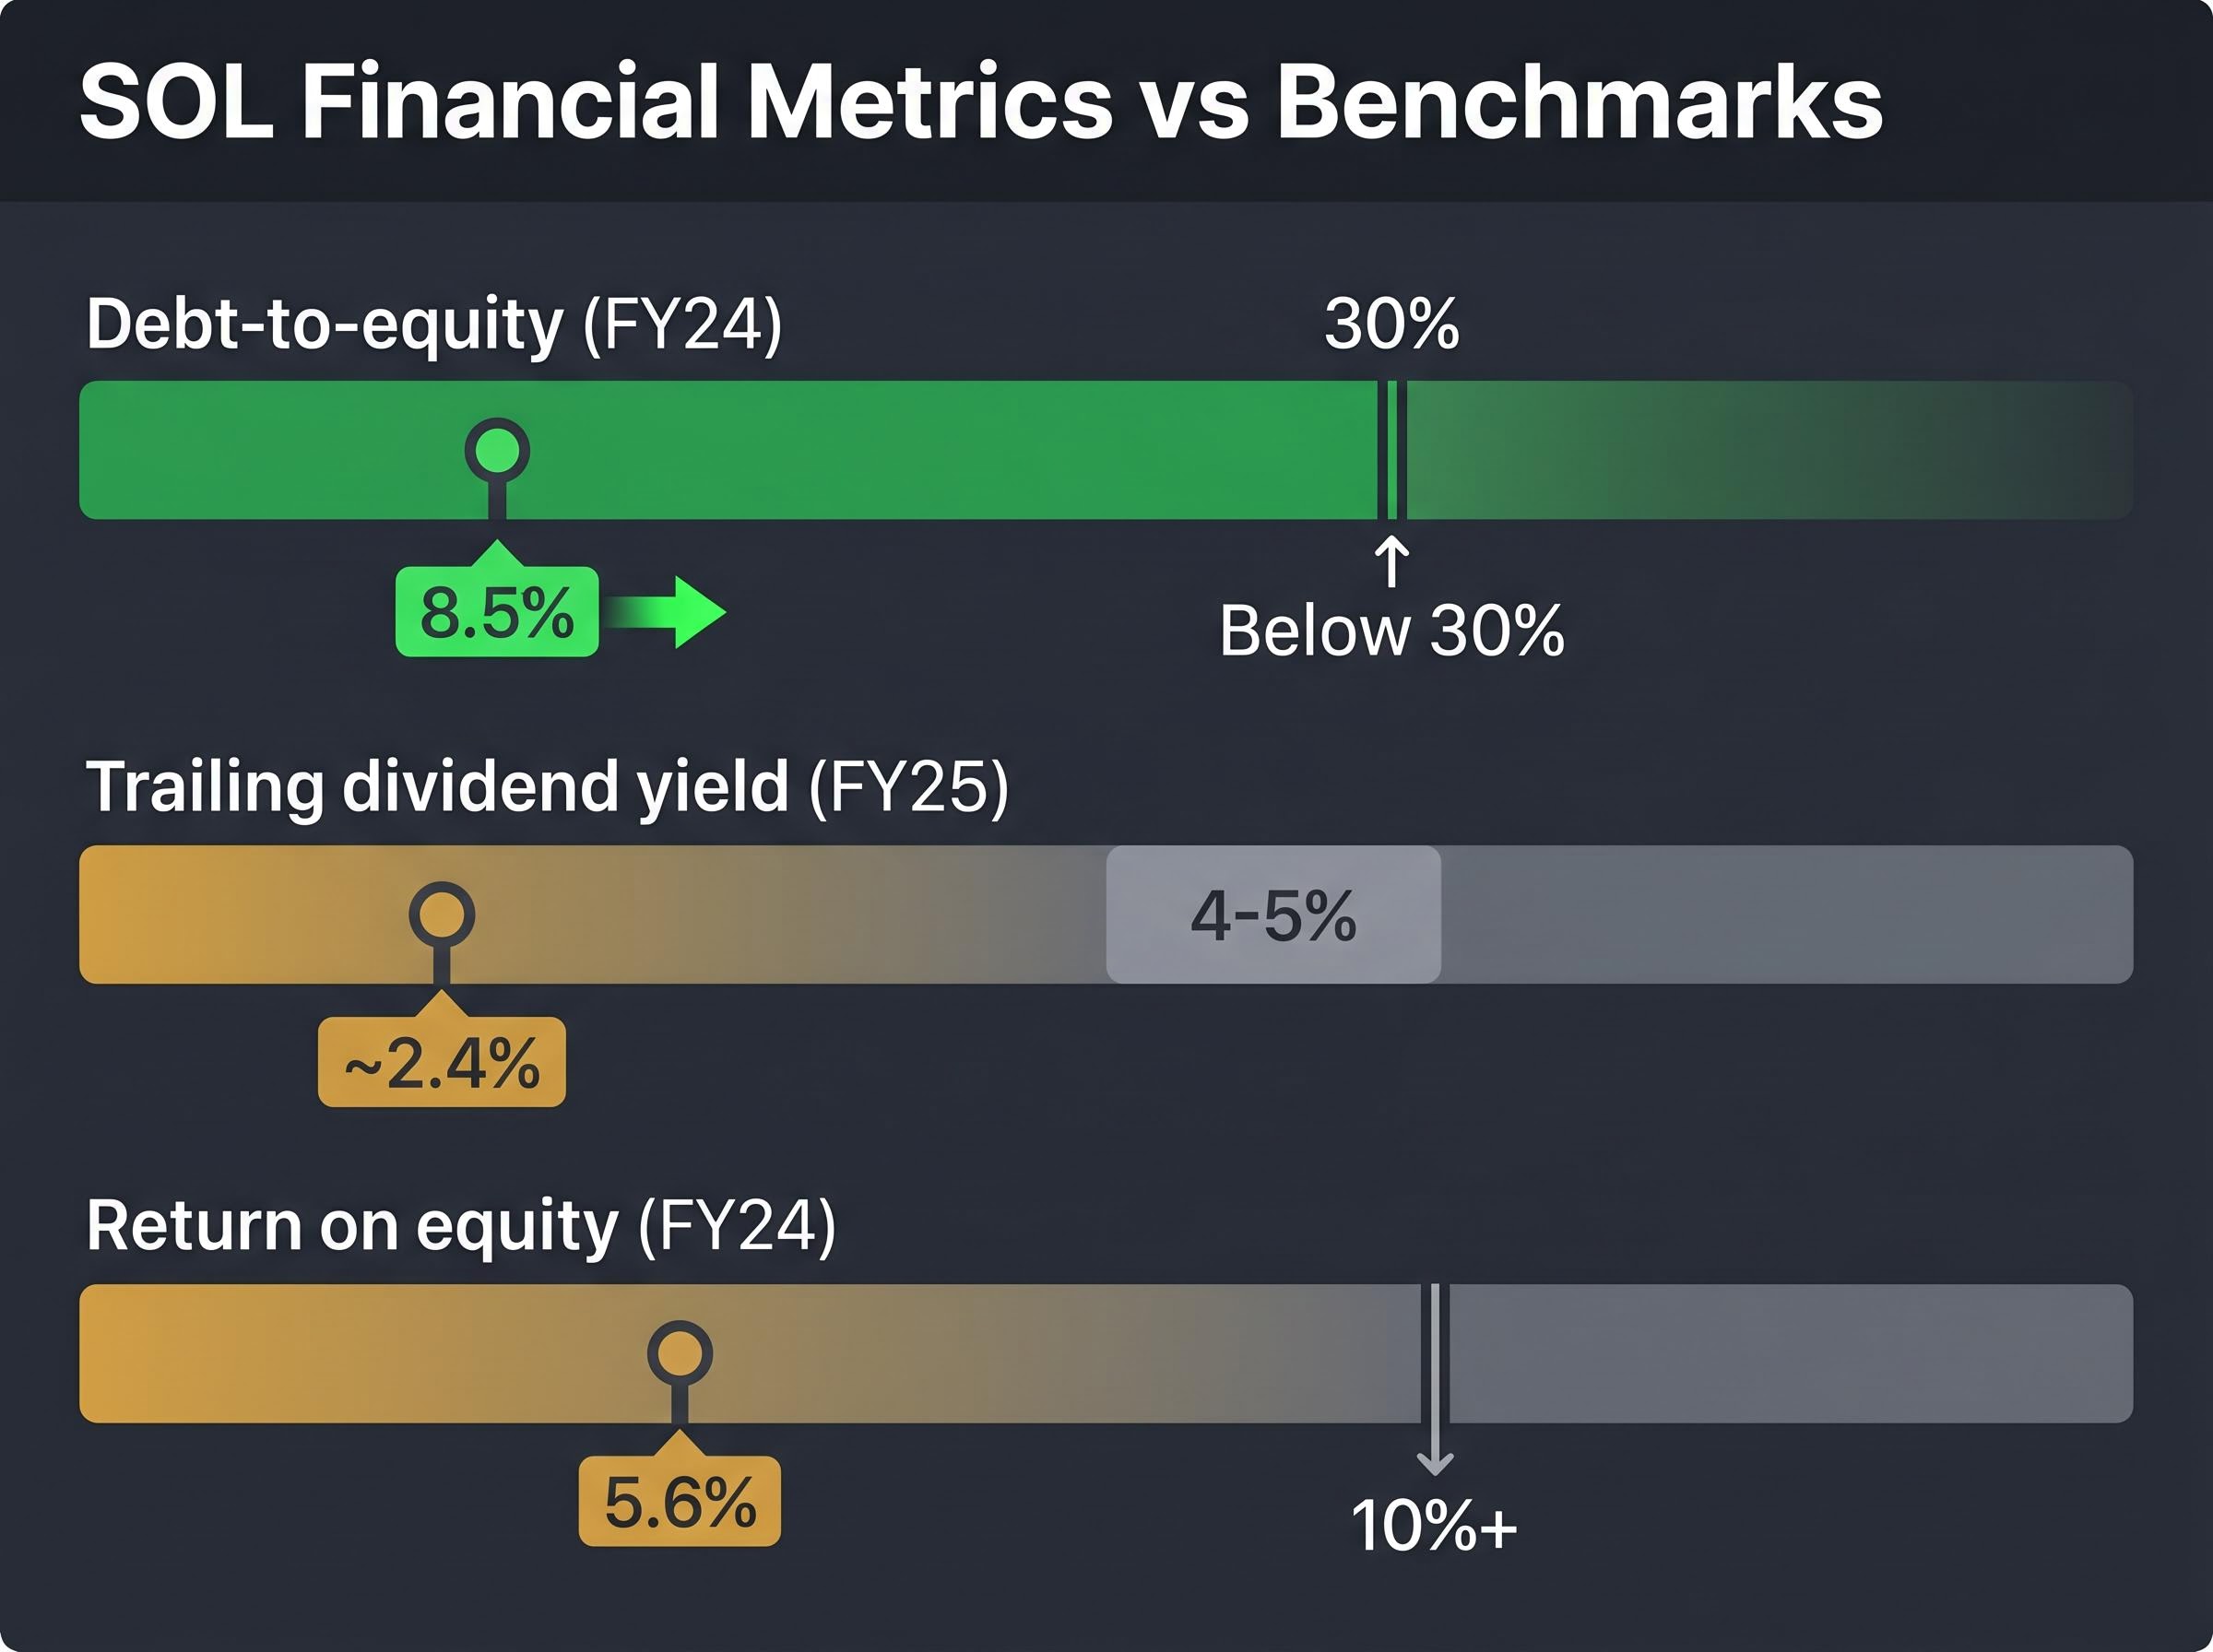
The clearest positive signal in WHSP’s financials is the balance sheet. An FY24 debt-to-equity ratio of 8.5% places the company well inside conservative thresholds. For an income investor, low gearing is the single most reliable indicator that dividends can be sustained through adverse conditions.
The dividend itself is solid but unspectacular. WHSP paid a total ordinary dividend of 103 cents per share in FY25, fully franked, split between an interim of 44 cents (paid May 2025) and a final of 59 cents (paid September 2025). At the current share price of approximately $42.41, that translates to a trailing yield of roughly 2.4%, consistent with the five-year average annual dividend yield of 2.4%.
Then comes the metric that unsettles the picture. WHSP reported an FY24 ROE of 5.6%, sitting well below the 10%+ benchmark commonly applied to mature ASX enterprises.
“5.6% FY24 ROE, below the 10% threshold commonly applied to mature ASX companies”
| Metric | FY24 / FY25 value | Benchmark | Verdict |
|---|---|---|---|
| Debt-to-equity | 8.5% (FY24) | Below 30% (conservative) | Comfortably meets threshold |
| Trailing dividend yield | ~2.4% (FY25 DPS) | 4-5% fully franked (income target) | Below typical income benchmark |
| Return on equity | 5.6% (FY24) | 10%+ (mature business) | Below benchmark; requires context |
A very clean balance sheet paired with a below-benchmark return on equity. That tension does not resolve itself with these numbers alone.
Why the standard ROE benchmark does not translate cleanly to a holding company
The 5.6% ROE figure looks concerning when placed beside an industrial company earning double-digit returns on shareholder funds. Applied to a bank or a retailer, it would invite questions about capital allocation quality. Applied to a diversified investment company, the metric tells a different, less conclusive story.
Return on equity benchmarks for mature industrial and retail businesses typically sit at 10% or above, a threshold that assumes the company reinvests operating profits directly into its own business rather than holding diversified stakes in other companies with their own capital structures.
WHSP’s assets are primarily listed equities and private investments. Accounting ROE for this type of vehicle fluctuates with valuation movements and the timing of asset realisations rather than reflecting operational efficiency. When New Hope Corporation has a weak coal price year, or when unrealised gains in the private equity book are not yet crystallised, the ROE compresses without any deterioration in the underlying portfolio’s quality.
The more relevant evaluation framework for this vehicle type centres on three alternative metrics:
- NTA per share growth over a multi-year period, measuring whether the portfolio is compounding in value
- Look-through returns on underlying assets, capturing the actual earnings power of the companies WHSP owns
- Total shareholder return (TSR) across a full market cycle, combining capital gains and dividends into a single measure
SOL’s 13.7% share price appreciation since the start of 2025 offers one proxy for how the market is currently assessing total return.
What ROE does and does not signal for a holding company
A single year of sub-10% ROE is not automatically disqualifying for a diversified investment vehicle with cyclical underlying earnings. New Hope’s coal revenues and WHSP’s unlisted private equity positions both create timing distortions in any single year’s accounting return.
The analytical question is whether NTA per share and dividends per share are both growing over a multi-year period. That trajectory, rather than one year’s ROE figure, is the more reliable test of capital allocation quality for a holding company of this structure.
NTA valuation and the premium question every SOL investor faces
The NTA premium or discount is the valuation trade-off that any serious SOL investor must resolve before committing capital. Financial commentary consistently notes that WHSP trades closer to its pre-tax NTA than most LICs, sometimes at a modest premium. Many listed investment companies trade at persistent discounts to their net assets; SOL’s ability to avoid that pattern reflects its governance reputation and multi-decade track record.
SOL’s tendency to trade near NTA, rather than at the persistent discounts common among LICs, reflects its governance and capital allocation track record.
The $11.8 billion pre-tax portfolio NAV (as at mid-2024) provides a reference point, though precise current NTA per share requires the most recent ASX announcements from WHSP’s FY25 full-year results.
Whether paying close to or above NTA is justified depends entirely on the forward view of the portfolio. Three considerations shape that assessment:
- New Hope coal exposure: provides strong current dividend income but carries long-term energy transition risk as thermal coal demand faces structural headwinds
- Private equity and credit diversification: WHSP has been expanding into structured credit, property, and unlisted infrastructure, representing its own rebalancing response to the NHC concentration risk
- TPG Telecom as a defensive anchor: provides telecommunications earnings less correlated with commodity cycles
The premium only makes sense if the underlying portfolio keeps compounding. That requires the reader to form a view about whether WHSP’s capital allocation discipline, which has sustained the dividend for over a century, will navigate the energy transition successfully.
Where SOL fits in an income-focused Australian portfolio in 2025
At approximately 2.4% trailing yield, fully franked, SOL does not compete with ASX banks or utilities on headline income. That is a statement of fact, not a criticism.
SOL suits this investor:
- Building a core holding of diversified, conservatively geared Australian assets with a long time horizon
- Prioritising growing (rather than maximised current) income and total return
- Comfortable evaluating holding companies on NTA growth and TSR rather than headline yield alone
SOL is a poor fit for this investor:
- Requiring high current income yield above 4-5% fully franked
- Uncomfortable with the valuation complexity of a holding company trading near NTA
- Seeking a simple, single-sector income position with transparent earnings
Term deposit alternatives currently yield as high as 4.80% from major banks, and for income investors whose primary constraint is current yield rather than long-term compounding, the comparison between a fully franked 2.4% cash yield and a capital-guaranteed term deposit is more competitive than it appeared two years ago.
The franking credit adjustment most investors overlook
The cash yield of 2.4% understates the pre-tax income for investors who can utilise franking credits. Fully franked dividends at the 30% corporate tax rate gross up the effective yield to approximately 3.4% on a pre-tax basis. For self-managed super fund (SMSF) investors in pension phase, the benefit is greater still, as franking credit refunds can deliver the full gross-up value.
The ATO franking credit refund rules establish the eligibility conditions and calculation basis for accessing imputation credits, including the treatment that makes SMSF pension phase accounts particularly well-positioned to capture the full gross-up value of fully franked distributions.
The practical value depends on each investor’s individual tax position. At the grossed-up level, SOL’s yield narrows the gap with higher-yielding alternatives, though it still sits below the 4-5% benchmark commonly cited for traditional high-yield ASX income stocks.
The case for patience: SOL’s long game and what has to be true for it to work
The SOL investment thesis distils to a single forward-looking condition: WHSP’s capital allocation track record must persist. Specifically, three conditions need to hold:
- NTA per share growth continues over a multi-year horizon, demonstrating that the portfolio is compounding
- Dividends per share are maintained or grown annually, extending the unbroken record
- The New Hope energy transition is managed without a structural collapse in the resources earnings that underpin a significant share of group income
What could challenge the thesis is equally concrete. A sustained period of weak resources earnings from NHC, deterioration in the private equity or credit portfolio, or a prolonged de-rating of the NTA premium if governance reputation were to slip would each pressure the case.
CGT discount reform proposals currently under debate in Australia could shift the relative attractiveness of capital growth assets versus fully franked income, a policy risk that is directly relevant to any portfolio assessment of WHSP given that its total return combines both a growing franked dividend stream and meaningful capital appreciation.
At 8.5% debt-to-equity, WHSP carries the balance sheet headroom to maintain its dividend through market downturns.
That low gearing is not just a balance sheet metric. It is the capability that has sustained the unbroken dividend record across multiple market cycles, preserving WHSP’s ability to both maintain distributions and make opportunistic acquisitions when others are capital-constrained. The stated focus on progressive, growing fully franked dividends reinforces the direction, though past performance does not guarantee future results.
A century of dividends does not make the decision for you
Washington H. Soul Pattinson is a well-structured, conservatively financed diversified investment company with a genuine track record. Its 2.4% trailing yield and below-benchmark ROE place it clearly as a core holding for long-term compounders, not a high-yield income replacement.
The right evaluation framework centres on NTA per share growth, DPS growth trend, and total shareholder return over a full cycle. Single-year ROE against an industrial benchmark is the wrong lens for this vehicle.
Qualitative valuation dimensions, including management credibility, capital allocation track record, and governance consistency, often determine whether a company’s reported metrics hold up over a full market cycle; for a vehicle like WHSP, where the 120-year dividend record is itself the primary governance signal, those dimensions carry at least as much weight as any single-year financial ratio.
The forward action for investors evaluating SOL is specific: check the most recent NTA per share from WHSP’s ASX announcements, compare it to the current share price to assess the NTA premium, and decide whether the grossed-up yield at their personal tax rate meets their income threshold.
This article is for informational purposes only and should not be considered financial advice. Investors should conduct their own research and consult with financial professionals before making investment decisions. Past performance does not guarantee future results. Financial projections are subject to market conditions and various risk factors.