
One Australian company has paid its shareholders a dividend every single year since 1903. Two world wars, the Great Depression, the global financial crisis, and a pandemic came and went. The dividend kept arriving.
Washington H. Soul Pattinson (ASX: SOL) holds a distinction almost no other ASX-listed stock can claim. With the share price sitting within 6% of its 52-week high as of late May 2026, income investors are actively asking whether this quasi-LIC holding company still earns its place in a long-term portfolio, or whether the premium for reliability has stretched too far.
This analysis works through what SOL’s diversified investment model actually looks like under the hood, what the FY24 financial metrics (including a reported 5.6% return on equity and 8.5% debt-to-equity ratio) tell income investors, how to think about its approximately 2.5-2.7% fully franked yield relative to peers, and what that 123-year dividend record genuinely signals about durability versus what it obscures.
Why SOL behaves nothing like a typical ASX blue-chip
SOL is the second-oldest company currently listed on the ASX, yet the label “blue-chip” misapplies more than it clarifies. The company operates as a diversified investment holding company, functioning closer to an active family office or quasi-listed investment company than a traditional industrial business generating revenue from operations.
Where benchmark-hugging listed investment companies such as AFIC and Argo hold broad, index-like equity portfolios, SOL takes a concentrated, active approach to capital allocation. Management has historically recycled capital from mature positions into higher-growth opportunities, maintaining a handful of strategic holdings rather than spreading exposure across hundreds of names.
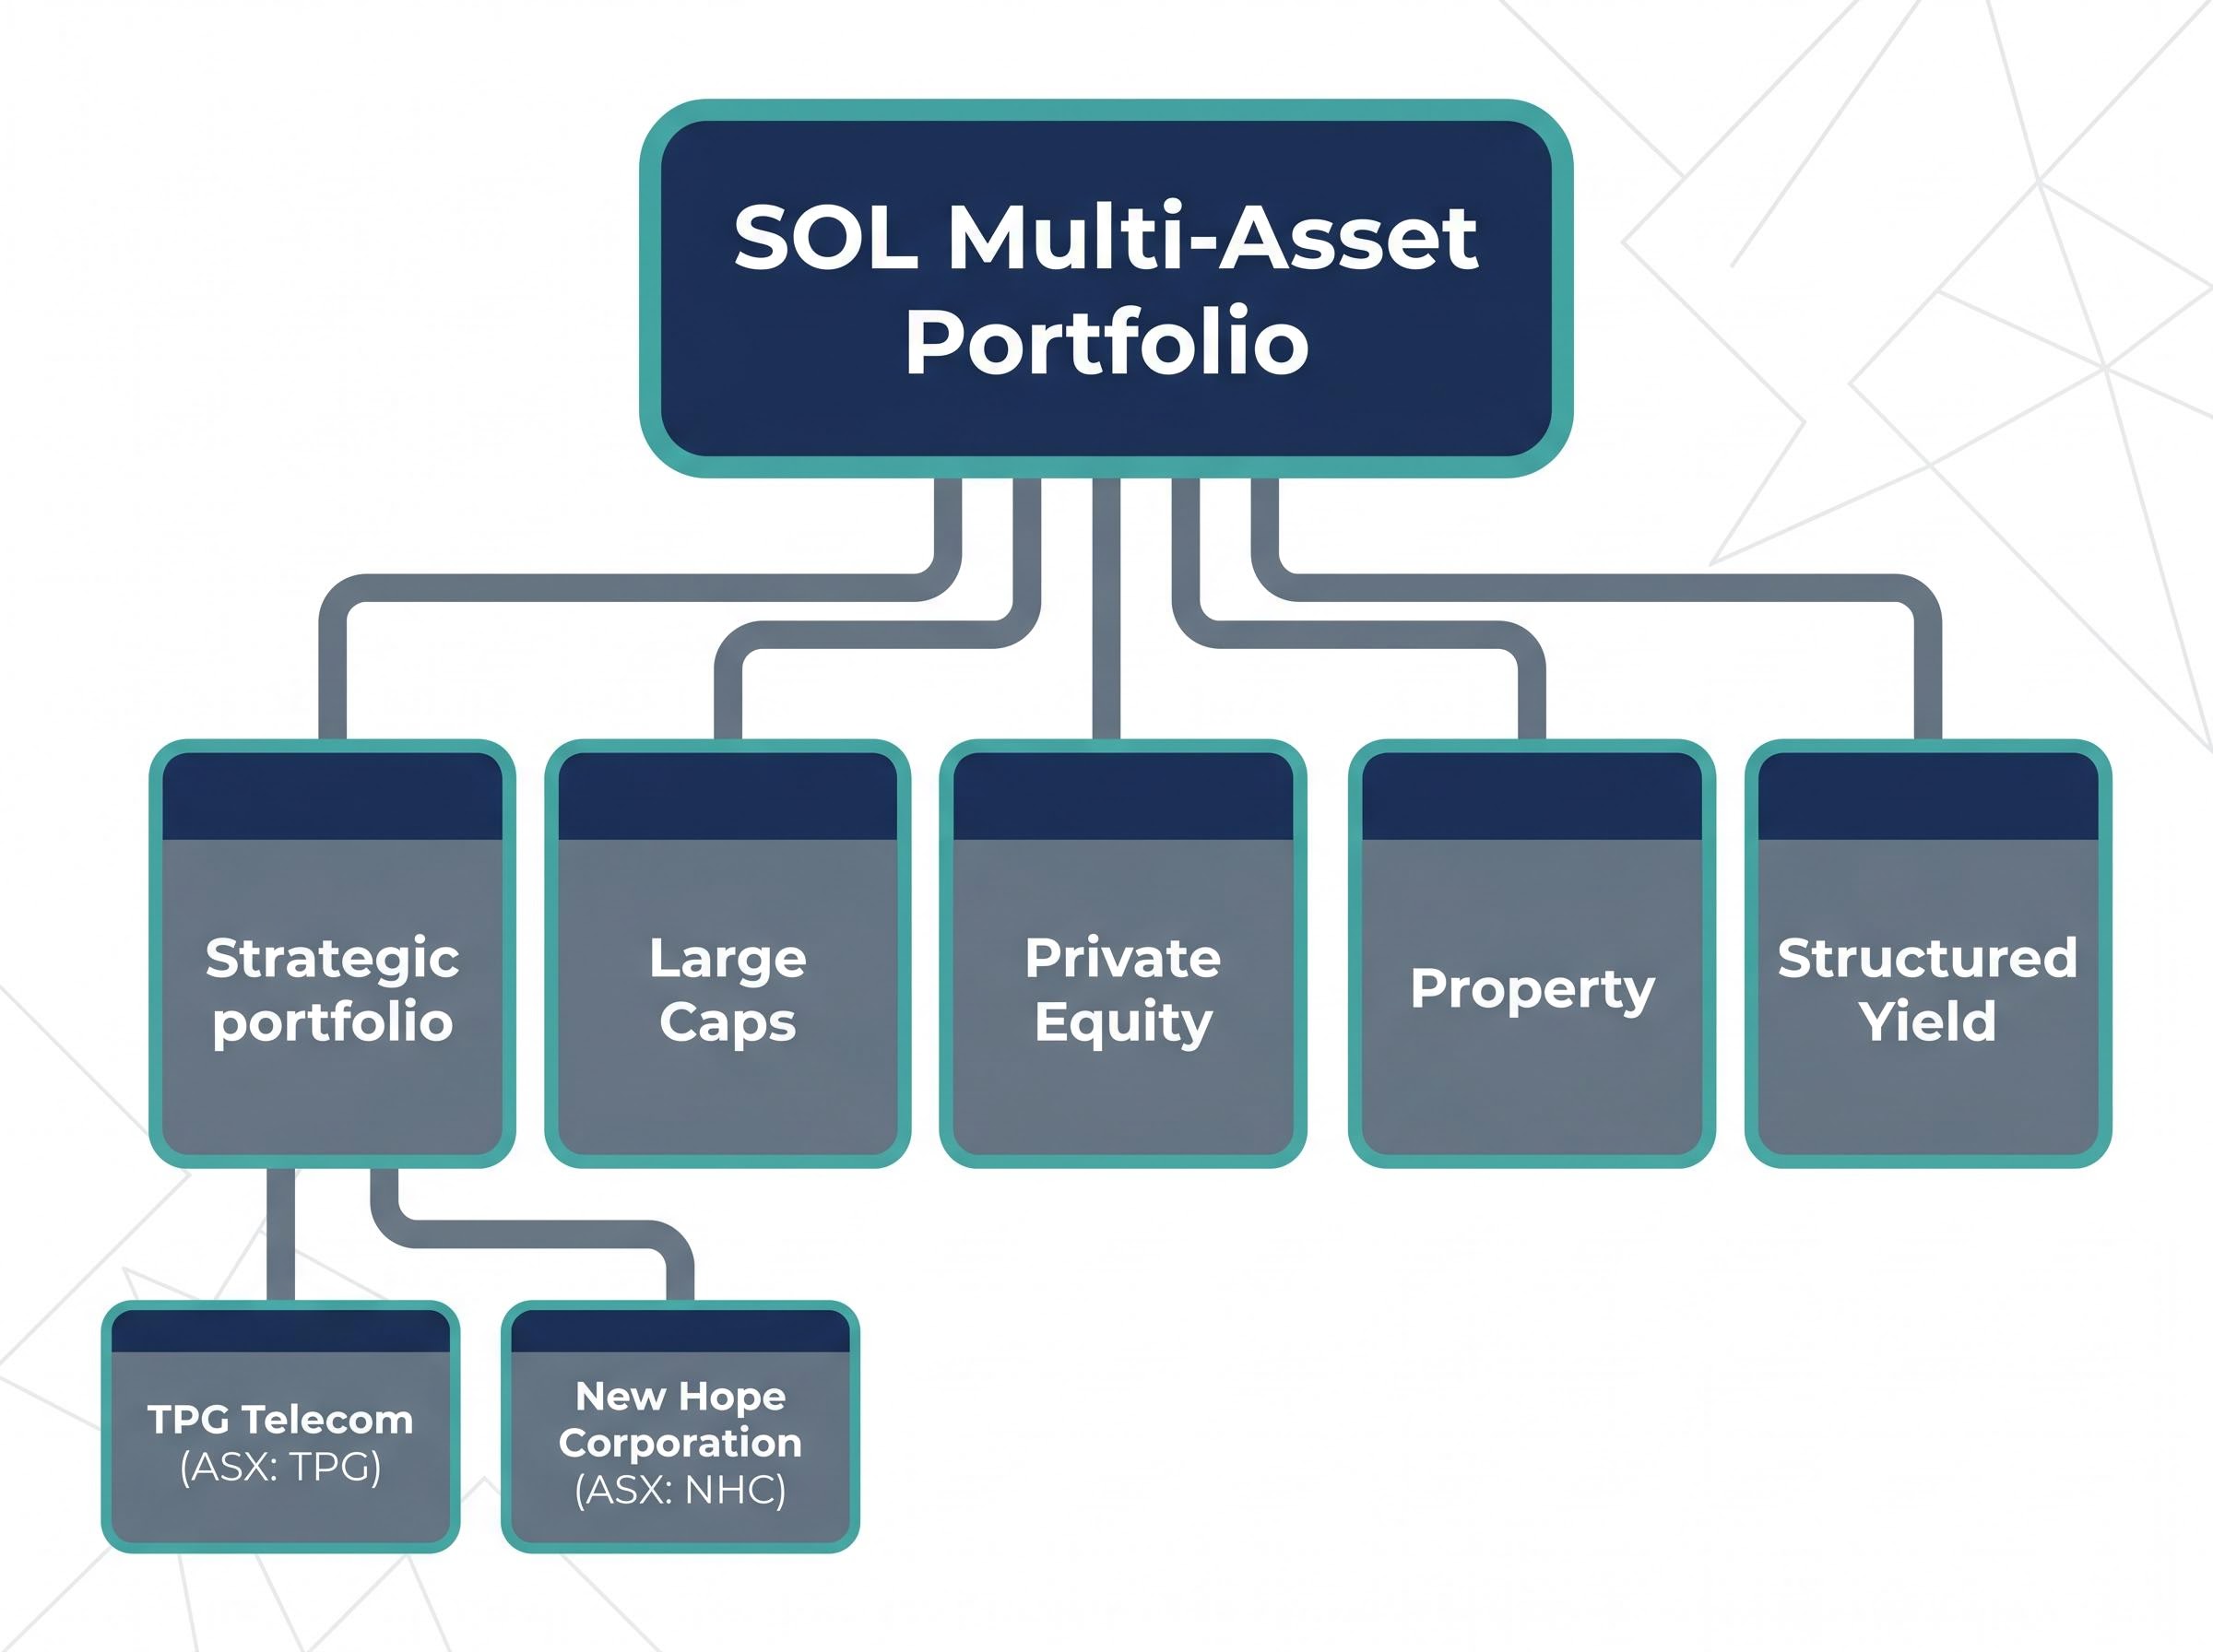
The portfolio spans five reported segments:
- Strategic portfolio: concentrated positions in major listed holdings
- Large Caps: listed equity holdings
- Private Equity: unlisted business interests
- Property: direct and indirect property exposure
- Structured Yield: fixed income and credit-style investments
This multi-asset structure is the engine behind both SOL’s durability and its unconventional financial metrics. Evaluating the company using standard industrial-company benchmarks, revenue growth, operating margins, return on invested capital, will systematically misread the business.
Inside the portfolio: what SOL actually owns
The Strategic portfolio carries the most weight. Two positions dominate: TPG Telecom (ASX: TPG) and New Hope Corporation (ASX: NHC). Both have a direct and material impact on SOL’s portfolio value, look-through earnings, and dividend funding capacity.
TPG brings telecommunications exposure with recurring revenue characteristics. New Hope contributes thermal coal cash flows that have, in elevated pricing environments, generated substantial fully franked dividends flowing up to SOL. The fortunes of these two holdings shape the group’s financial profile more than any other factor.
When big ASX news breaks, our subscribers know first
The 123-year dividend record: what it genuinely signals
Washington H. Soul Pattinson has maintained an unbroken dividend record since 1903, making it one of the longest-running dividend streaks on the ASX.
The weight of that number is difficult to overstate. A shareholder who held through the Spanish flu, the Depression, two world wars, the 1987 crash, the dot-com bust, the GFC, and COVID-19 collected a dividend in every single year.
All ordinary dividends are fully franked. For Australian resident investors, retirees, and self-managed super fund (SMSF) trustees who can utilise franking credits, this converts a modest headline yield into a materially higher gross yield. A 2.5% headline yield with full franking delivers a gross yield closer to 3.6% for investors on marginal tax rates at or below the corporate rate, and a full franking credit refund for those in pension phase.
For SMSF trustees in pension phase, franking credit refunds represent a direct cash transfer from the ATO, converting a 2.5% headline yield into a meaningfully higher effective return without any change to the underlying dividend rate paid by the company.
The board’s stated policy is to maintain or grow the dividend each year. The diversified portfolio structure spreads income sources across multiple asset classes and sectors, meaning no single holding’s downturn can break the chain in isolation. For reference, the HY24 interim dividend was declared at 40 cents per share, fully franked (declared 21 March 2024). More recent dividend figures should be verified against SOL’s latest ASX Appendix 4D filing.
From 2020 onwards, the average annual dividend yield has been approximately 2.4%. The current yield sits at approximately 2.5-2.7% based on late May 2026 pricing.
The streak survived every macro crisis of the last century. That record is not an accident. It flows from the combination of conservative gearing, multi-asset diversification, and a board culture oriented around dividend maintenance. The question for investors is whether the structural reasons behind the streak remain intact, and the balance sheet data discussed below suggests they do.
Decoding the 5.6% ROE: three ways analysts read the same number
SOL’s reported FY24 return on equity (ROE), a measure of how much profit a company generates relative to its shareholders’ equity, sits at approximately 5.6%. For a mature ASX-listed company, where analysts typically look for ROE exceeding 10%, that figure invites scrutiny.
The financial commentary on this single number splits into three distinct camps, and the disagreement is genuine.
| Analytical View | Interpretation of 5.6% ROE | Implication for Income Investors |
|---|---|---|
| Acceptable for the model | Low headline ROE reflects conservative gearing, defensive allocations, and a long-term capital allocation approach. SOL should be assessed like a diversified investment company, not an industrial business. | An unbroken, fully franked dividend record with real growth can justify accepting below-market ROE, provided the dividend continues growing. |
| Conglomerate discount concern | Mid-single-digit ROE below ASX averages raises questions about whether investors overpay for the dividend track record. Cyclical concentration in New Hope and TPG adds risk without commensurate return. | Income investors may be paying a premium for reliability while receiving sub-par capital returns on their equity. |
| Accounting ROE understates reality | Many assets are held at historical cost or equity-accounted, suppressing reported ROE. Look-through portfolio performance and long-run total shareholder return are more relevant measures. | The economic return to shareholders, including capital appreciation and franking credits, may substantially exceed the statutory ROE figure. |
The third view carries particular relevance for long-term holders. When assets acquired decades ago are carried at cost on the balance sheet, the equity denominator in the ROE calculation understates the true market value of the portfolio, mechanically depressing the ratio.
A dividend discount model applied to SOL requires choosing a constant growth rate that reflects the company’s 123-year dividend trajectory rather than its near-term earnings, a distinction that makes the choice of the discount rate and growth input more consequential than in typical industrial valuations.
The 5.6% figure (sourced from company reports via Rask Invest Research) should be independently verified against SOL’s primary annual report before relying on it for investment decisions. Regardless of the precise number, the interpretive debate remains the central analytical tension in any assessment of this stock.
What an 8.5% debt-to-equity ratio means for a holding company
SOL’s FY24 debt-to-equity ratio of 8.5% is exceptionally low by ASX standards. Many ASX-listed companies operate with ratios significantly above 50%, making SOL an outlier toward conservatism. Equity substantially outweighs debt obligations.
This is not incidental. It is a deliberate feature of the company’s capital management philosophy, and it connects directly to the dividend record.
Three reasons explain why this low leverage supports dividend durability:
- Low debt servicing costs mean less cash is consumed by interest payments, leaving more available for dividend distribution regardless of market conditions.
- Independence from credit market conditions means the company is not forced to cut dividends to meet lender covenants during periods of rising interest rates or tightening credit.
- Management flexibility to recycle capital without debt pressure allows the board to reallocate between portfolio segments opportunistically rather than defensively.
The trade-off is the low ROE discussed above. An unleveraged portfolio structurally produces lower return-on-equity figures because the equity base is large relative to the earnings generated. The two metrics must be read together: the 8.5% debt-to-equity ratio and the 5.6% ROE are two sides of the same conservative design.
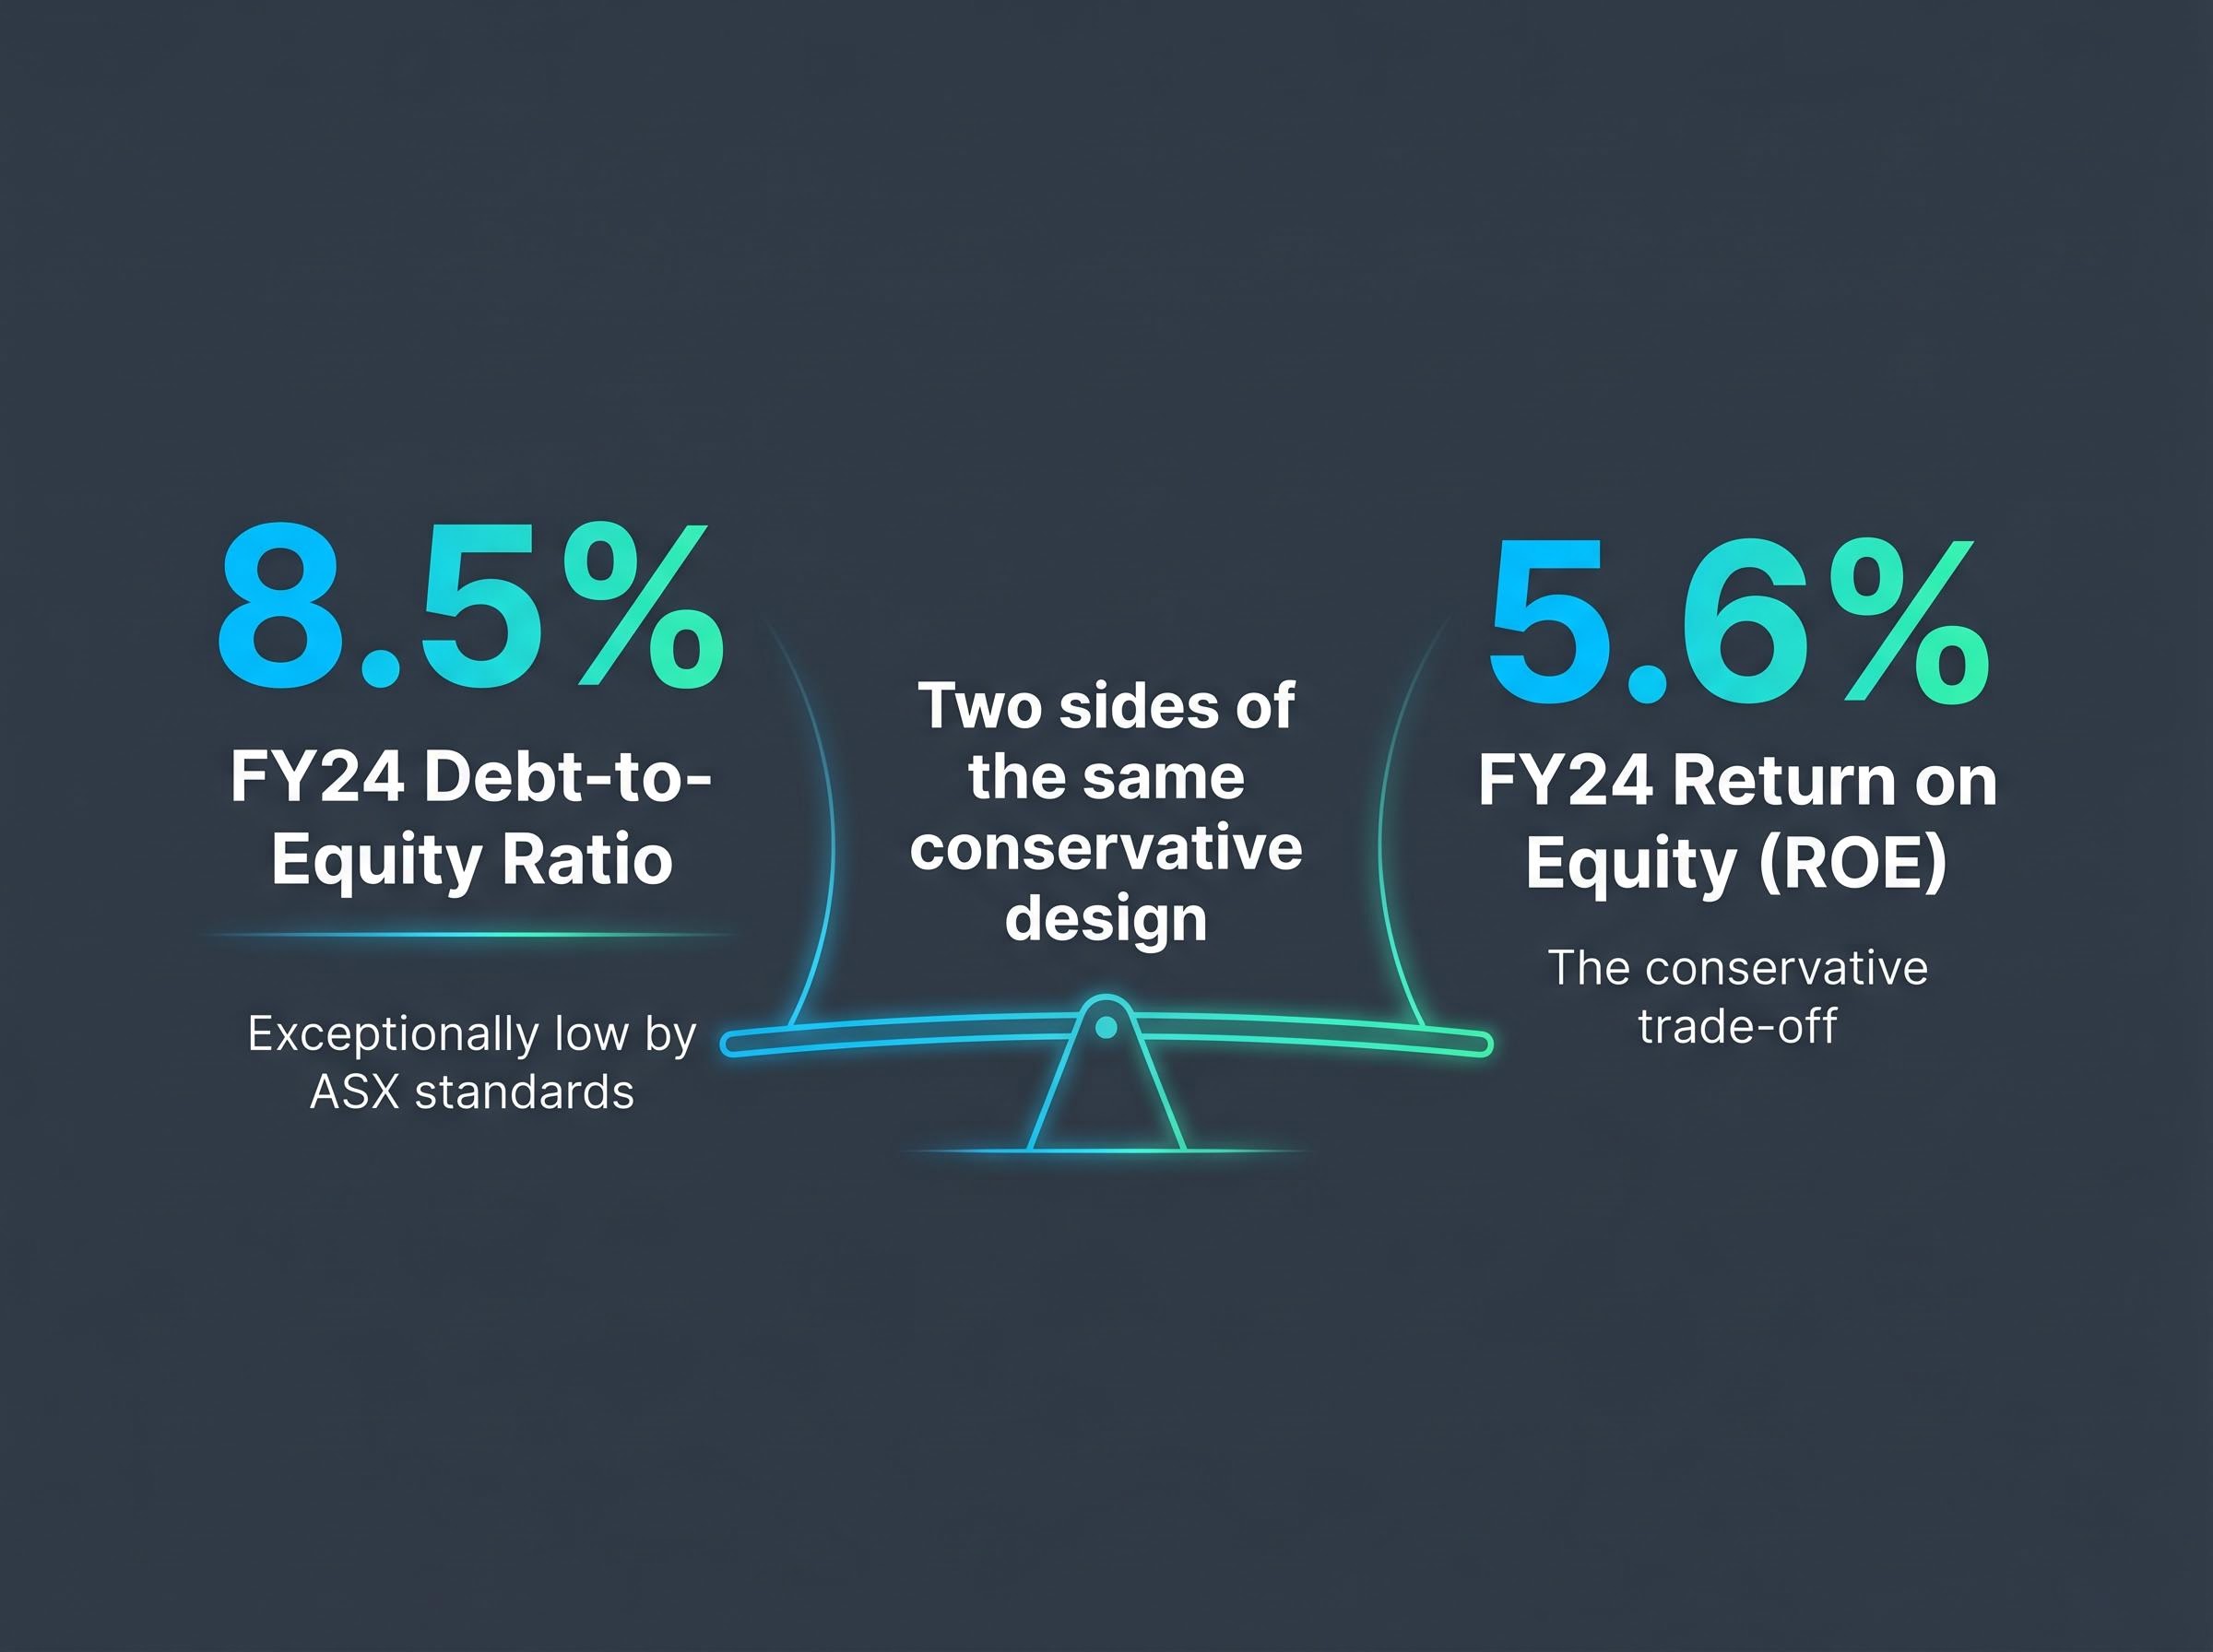
For income investors, this conservatism is not a performance failure. It is a structural feature that supports dividend sustainability in adverse conditions, which is precisely what the SOL investment case is built upon.
How SOL compares to other income vehicles on the ASX
SOL’s approximately 2.5-2.7% yield, based on late May 2026 pricing, trails what major bank stocks and several traditional listed investment companies offer. On a pure yield comparison, SOL loses.
The comparison becomes more instructive when the structural differences are laid out:
- Active vs. passive: SOL actively concentrates capital in a small number of strategic positions; traditional LICs like AFIC and Argo track closer to index-like diversification
- Concentrated vs. diversified: SOL’s returns are heavily influenced by TPG and New Hope; LIC peers spread risk across hundreds of holdings
- Multi-asset vs. equities-focused: SOL spans equities, private equity, property, and structured yield; most LIC peers are listed-equities-only vehicles
- 123-year record vs. peers’ records: SOL’s unbroken dividend streak is among the longest on the ASX, a differentiator that other LICs cannot match at comparable duration
Income investors choosing between SOL and its LIC-style peers are making a structural bet. The question is whether concentration, active management, and multi-asset diversification deliver superior long-term outcomes for income reliability, or whether the cyclical risks embedded in the strategic portfolio undermine that advantage.
The cyclical risk inside the strategic portfolio
The concentration in TPG Telecom and New Hope Corporation introduces sector-specific cycles that a benchmark-hugging LIC does not carry to the same degree.
New Hope’s exceptional cash generation in elevated thermal coal price environments has supported SOL’s dividend funding capacity. Coal price cycles, however, create variability in this contribution. A sustained period of depressed thermal coal pricing would reduce look-through income flowing to SOL.
Experienced income investors apply dividend trap signals including payout ratios above 100%, rising yields driven by falling prices, and look-through earnings cover below 1.5x before concluding that a long track record is sufficient evidence of future dividend sustainability.
TPG faces its own cyclical dynamics in the competitive Australian telecommunications market, where subscriber growth, average revenue per user, and capital expenditure on network infrastructure all influence dividend capacity.
Investors should review the 1H26 results presentation (released 26 March 2026, available at soulpatts.com.au) for current portfolio weightings and any strategic changes made since the last annual report.
The income investor’s verdict: what SOL is and what it is not
SOL is not a high-yield instrument. It is not a high-ROE growth engine. It is not a passive index tracker. It is a conservatively geared, actively managed investment holding company with an unmatched dividend longevity record and multi-asset diversification that suits a specific investor profile.
SOL suits investors who:
- Prioritise dividend dependability over maximum yield
- Value full franking and can utilise franking credits (particularly retirees and SMSF trustees)
- Have a long investment horizon and prioritise capital preservation alongside income
- Want multi-asset diversification through a single ASX-listed holding
SOL does not suit investors who:
- Require high current yield (bank stocks and some LICs offer more)
- Benchmark portfolio returns against the ASX 200 and expect index-beating ROE
- Are uncomfortable with concentrated exposure to thermal coal (New Hope) and telecommunications (TPG) cycles
- Are seeking near-term capital appreciation, with the share price sitting within 6% of its 52-week high as of May 2026, the near-term margin of safety is limited at current prices
Investors who have held SOL through its multi-year appreciation and are now evaluating whether the current proximity to a 52-week high warrants trimming or holding will find our full explainer on portfolio rebalancing after a rally, which covers drift thresholds, tax-efficient execution sequencing, and alternative destinations for reallocated capital.
The current share price range of approximately $42.41-$42.61 (late May 2026) should be assessed against the most recently reported NTA per share (referenced at approximately $24.80 in 2025 context, though this figure requires verification against current ASX filings). The 1H26 results released 26 March 2026 are available at soulpatts.com.au and represent the current primary source for portfolio performance and valuation detail.
123 years of unbroken dividends is a record that speaks not to luck but to structural design: conservative gearing, active capital recycling, multi-asset diversification, and a board culture that treats the dividend as a non-negotiable commitment.
This article is for informational purposes only and should not be considered financial advice. Investors should conduct their own research and consult with financial professionals before making investment decisions.
123 years in, the dividend machine keeps running, but read the fine print
SOL’s durability is structural, not accidental. Conservative gearing, active capital recycling, multi-asset diversification, and a board culture oriented around dividend maintenance have sustained the streak through every macro disruption of the last 123 years.
Several data points in this analysis, including current NTA, broker price targets, 1H26 portfolio segment performance, and the most recent dividend per share, require verification from primary sources before any investment decision. Australian investors should consult the soulpatts.com.au investor relations page and the ASX Appendix 4D for the most recent period.
Independent financial advice remains appropriate for assessing personal suitability.
Past performance does not guarantee future results. Financial projections are subject to market conditions and various risk factors.