A $96.15 million options basket built across four semiconductor names nearly doubled its intrinsic value in a matter of days. But over 90% of those gains came from just two positions, and one leg now sits directly in front of a binary earnings event that could erase $44 million in premium overnight.
The basket was constructed the prior week across SanDisk, Micron, Intel, and Marvell using October expiration calls. By recording on 22 September, its combined intrinsic value had reached roughly $202.2 million, up from the $96.15 million deployed days earlier.
The construction, the performance, and what comes next are not spread evenly across the four names. Reading this trade accurately means reading its structure, not just its headline return.
This piece walks the basket leg by leg, shows where the real profit and loss concentration sits, unpacks the gamma profile that makes one position dominate the risk from here, and frames what Micron’s 30 September earnings mean for anyone watching or following the trade. After reading, you will know how to assess a multi-leg options basket by its architecture rather than its aggregate return.
How $96 million was built: position sizing and strike selection across four names
The basket reads like a set of deliberate choices, not a scattergun bet. Four legs, four different strike distances, four different premium weights, and a clear thesis buried in the ratios.
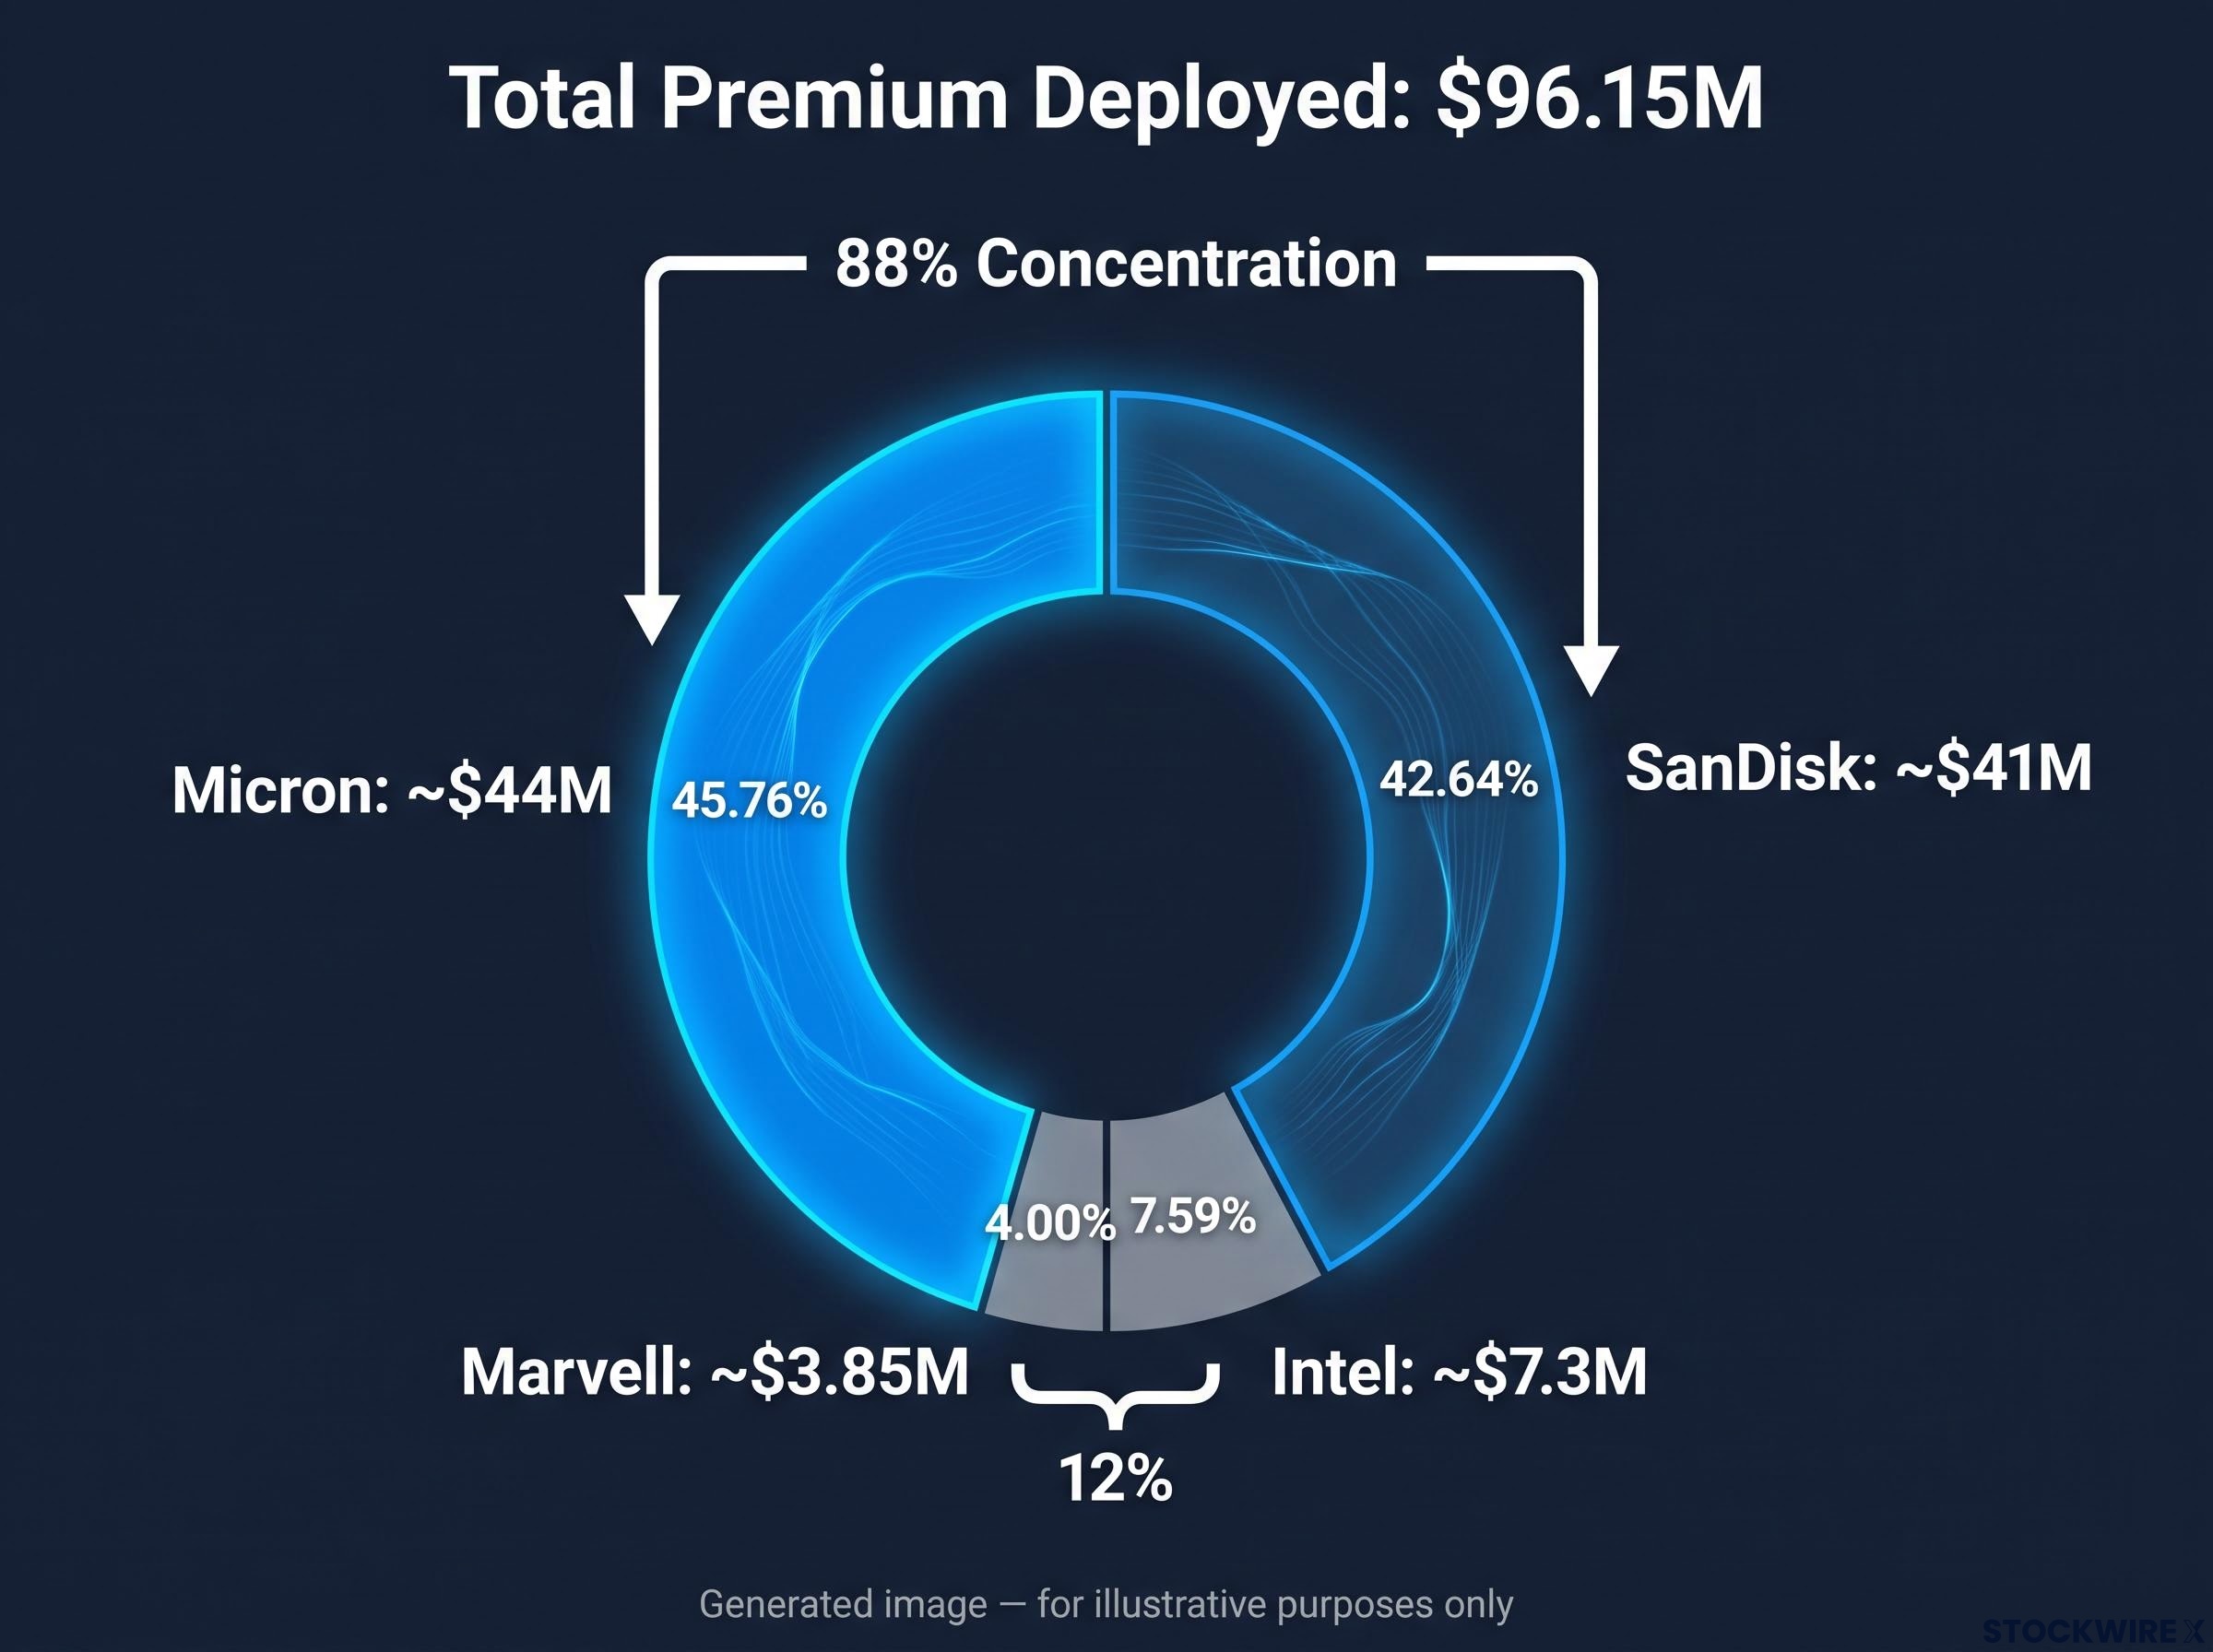
SanDisk anchored one side of it. The position ran roughly 4,200 contracts at the $1,600 strike, expiring 2 October, purchased near $97.60 per contract. That worked out to about $41 million in premium and a break-even near $1,697.60.
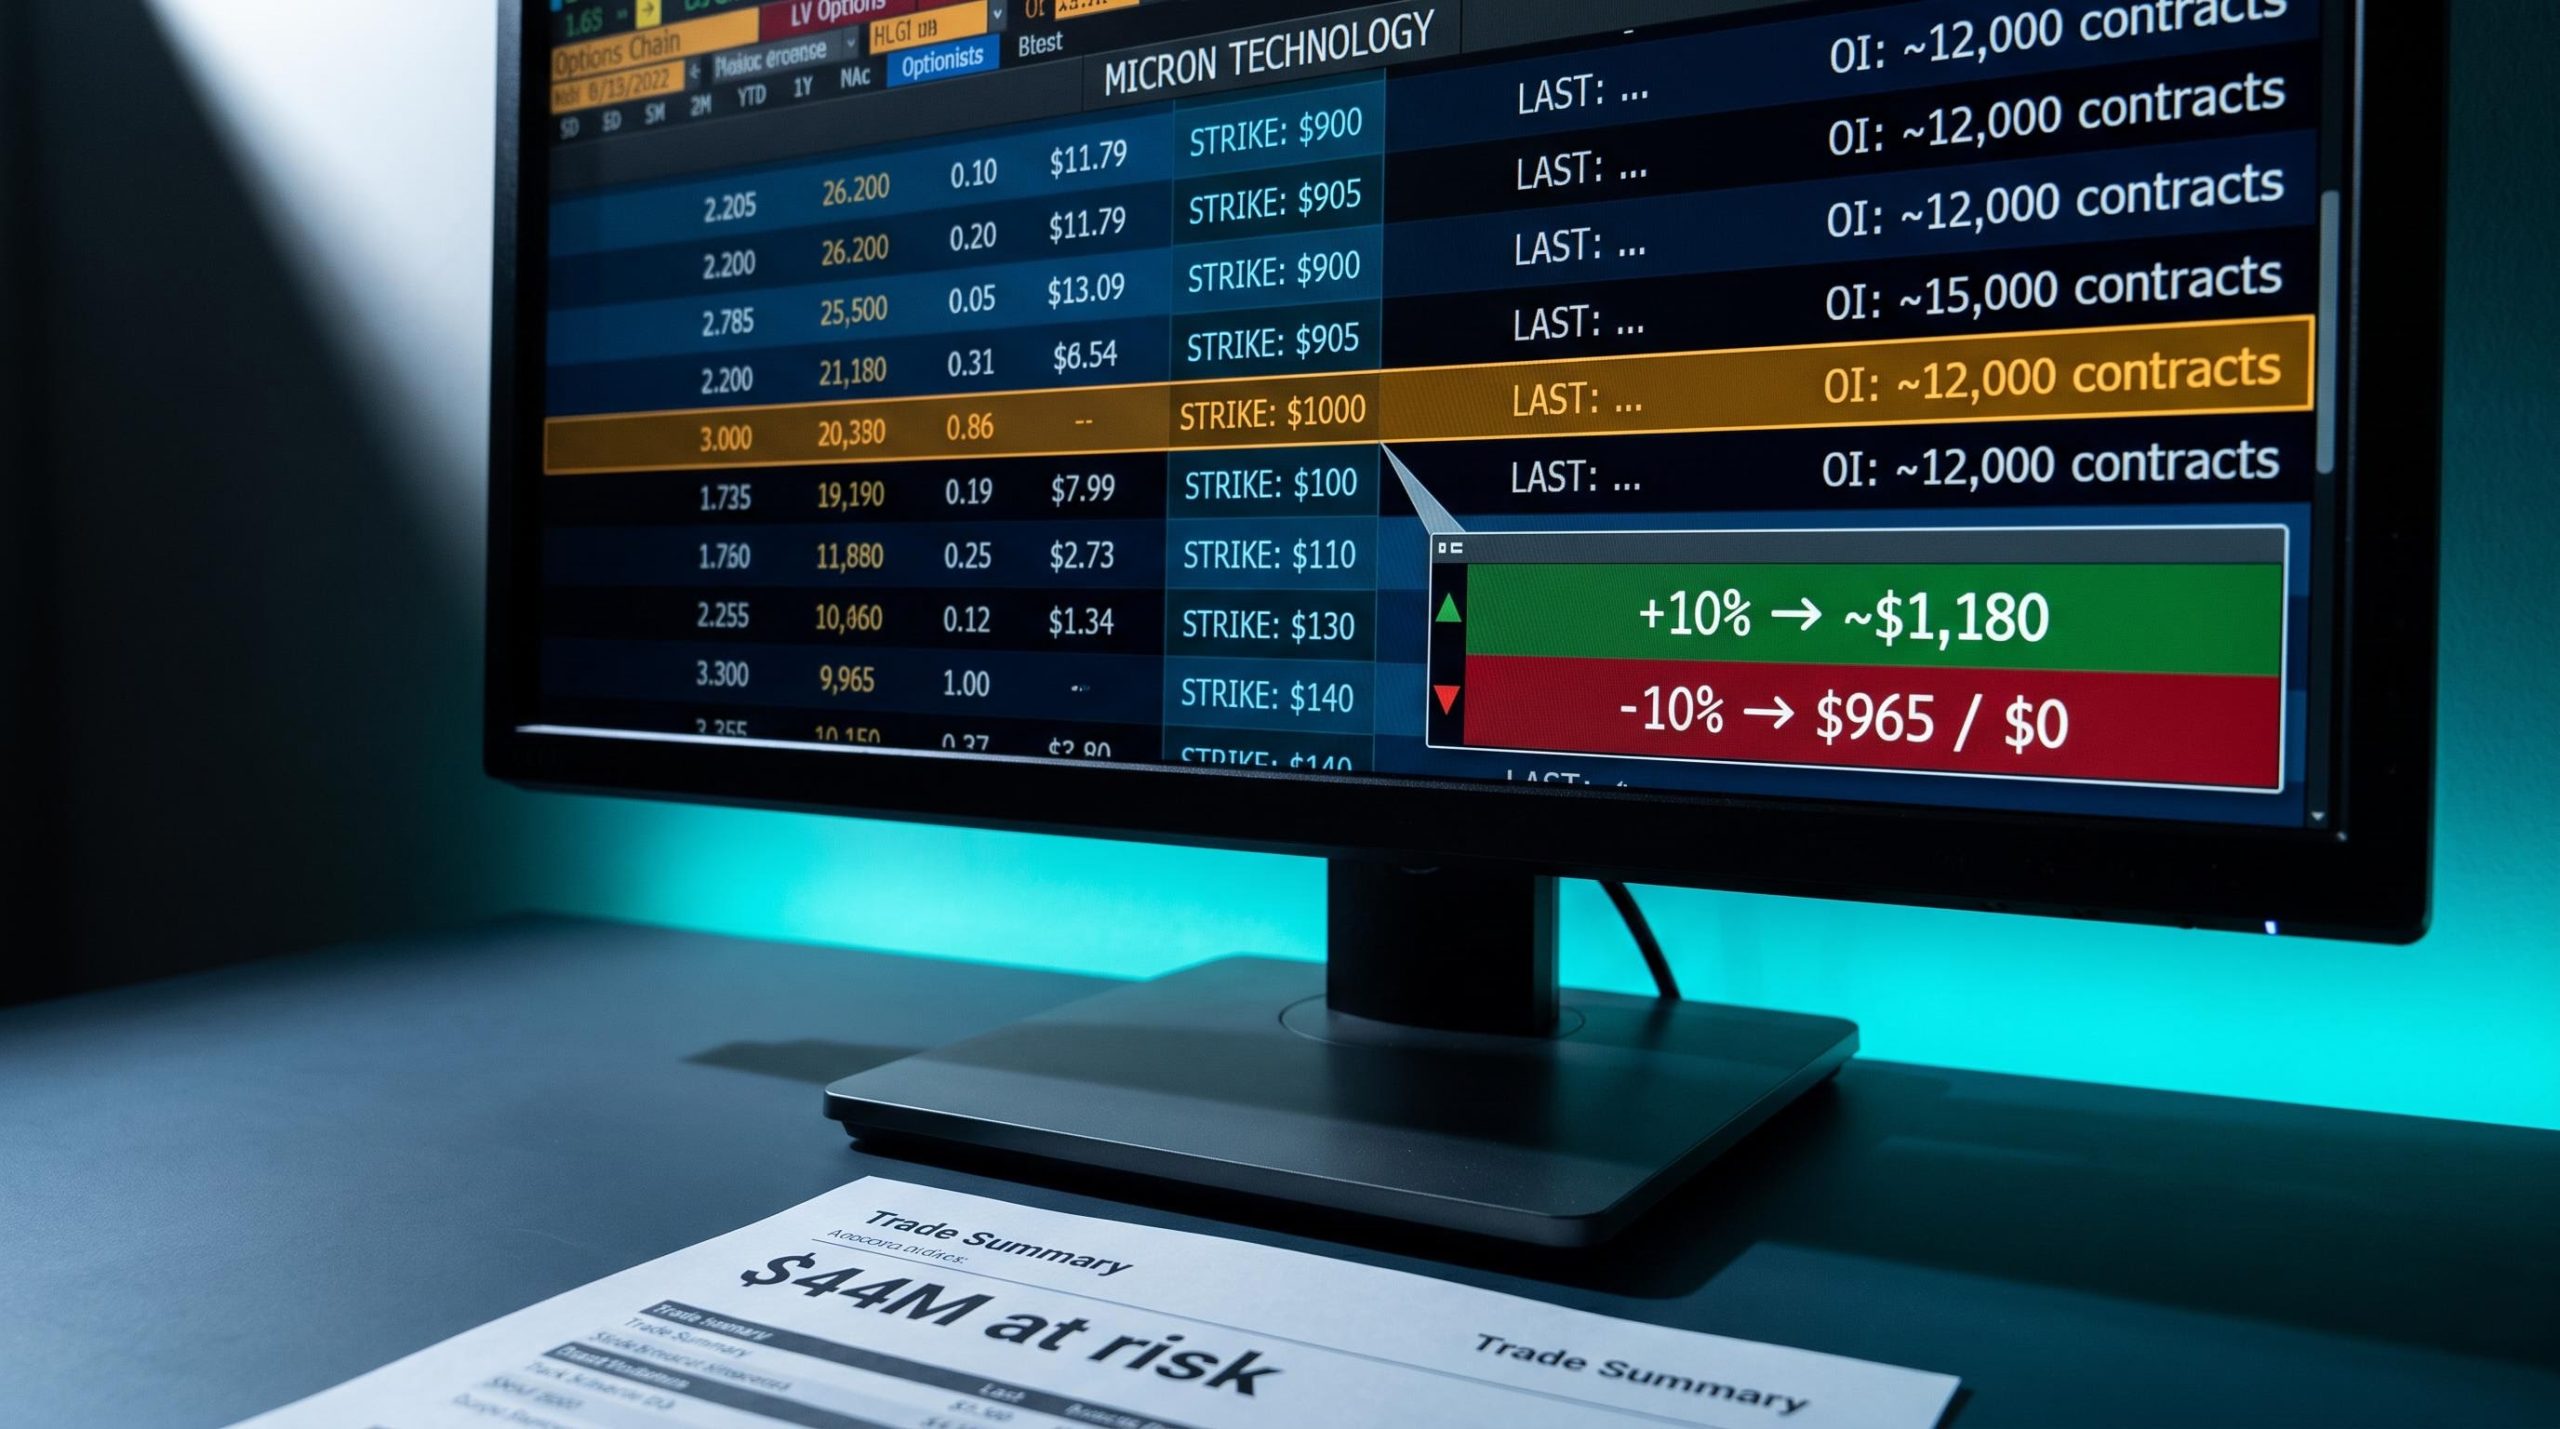
Micron carried the largest single outlay. Around 10,000 contracts at the $1,000 strike, expiring 4 October, absorbed roughly $44 million in premium.
Intel and Marvell were far smaller. Intel took approximately $7.3 million with a break-even estimated at $118.65, and Marvell approximately $3.85 million with a break-even near $261.
| Name | Strike | Expiry | Contracts / Premium | Break-Even |
|---|---|---|---|---|
| SanDisk | $1,600 | 2 Oct | ~4,200 / ~$41M | ~$1,697.60 |
| Micron | $1,000 | 4 Oct | ~10,000 / ~$44M | ~$1,000+ premium |
| Intel | – | Oct | ~$7.3M | ~$118.65 |
| Marvell | – | Oct | ~$3.85M | ~$261 |
| Total | – | Oct | ~$96.15M | – |
Total premium deployed: approximately $96.15 million across four legs.
Look at the weighting. Micron and SanDisk together represent about 88% of the total premium. Intel and Marvell combined account for barely 12%.
The expiration clustering reinforces the point. SanDisk expires 2 October, Micron 4 October, a tight window that concentrates the entire basket’s fate into a two-day band. That is a time-concentration decision, not an accident of available contracts.
What the sizing tells you is that this was never a diversified semiconductor sector bet. It was a concentrated memory call, with Intel and Marvell functioning as satellite exposure rather than equal partners.
Call options basics matter here because the 90%-plus concentration of intrinsic value in two legs illustrates the premium decay and directional asymmetry that destroy most retail buyers who enter without understanding how extrinsic value evaporates near expiration.
When big ASX news breaks, our subscribers know first
Where the money actually went: intrinsic value concentration in SanDisk and Micron
The headline number is a near-doubling: roughly $202.2 million in intrinsic value against $96.15 million deployed. Impressive at the aggregate level, and misleading if you stop there.
Pull the basket apart and the concentration is stark. SanDisk alone accounted for approximately $113 million of that total.
The mechanics are simple. With SanDisk’s underlying trading near $1,888 at recording against the $1,600 strike, intrinsic value per contract had climbed to roughly $268 against the $97.60 cost basis. That is a gain of about 175% on the $41 million outlay, and it helps that SanDisk’s stock was up roughly 633% on the year.
Micron did the rest of the heavy lifting. Its underlying above $1,070 pushed the leg to approximately $72 million in intrinsic value, a gain near 63% on the $44 million position.
Here is the per-leg picture at recording:
- SanDisk: approximately 175% gain, roughly $113 million intrinsic value
- Micron: approximately 63% gain, roughly $72 million intrinsic value
- Intel: approximately 87% gain on a $7.3 million base
- Marvell: barely profitable, just above the $261.10 break-even
Over 90% of the basket’s $202.2 million intrinsic value was concentrated in two memory names.
This was not luck. The two largest premium positions were pointed at the memory names with the most compressed supply and the strongest AI-driven pricing power. The concentration in dollars is the directional thesis made visible.
And it matters going forward, not just historically. The two names that produced the gains are the two names that still hold the remaining risk.
Intel and Marvell: satellite exposure with a different risk function
Intel’s roughly 87% gain looks strong in percentage terms, but on a $7.3 million base it moves the aggregate number only modestly. Marvell, barely across its break-even on $3.85 million, contributes even less.
These legs function as directional participation, not profit and loss drivers. They give the basket sector breadth, a way to say “AI infrastructure broadly” rather than a concentrated thesis on any single name. If you are reading the trade for where the real money lives, these two are context, not the story.
Options mechanics 101: why deep-in-the-money and near-the-money calls behave differently
The SanDisk and Micron legs both made money, but they are not the same kind of bet, and the difference decides where the basket’s risk actually sits.
Two ideas explain it. Delta measures how much an option’s price moves for a $1 move in the underlying stock. Gamma measures how fast that delta itself changes as the stock moves.
Delta and gamma mechanics are not abstract Greek letters in this context; the SanDisk leg’s high, stable delta versus Micron’s rapidly shifting delta near expiration is exactly the polarisation dynamic that accelerates as options approach their settlement date.
By recording, SanDisk’s calls were deep in-the-money, with the underlying near $1,888 well above the $1,600 strike. A deep in-the-money call carries a high delta that stays relatively stable, so it behaves much like a levered stock position with a built-in intrinsic cushion beneath it.
Micron’s calls sat closer to the money, with the underlying around $1,070 against the $1,000 strike. Near-the-money options carry far higher gamma, meaning their delta swings sharply on small price moves. That makes the leg convex, and highly sensitive to short-term volatility, exactly the profile you do not want unhedged in front of a binary earnings print.
| Attribute | DITM Profile (SanDisk) | NTM Profile (Micron) |
|---|---|---|
| Delta behaviour | High and stable | Moderate, shifts quickly |
| Gamma sensitivity | Comparatively low | High |
| Event exposure | Cushioned by intrinsic value | Fully exposed to 30 Sept earnings |
| P&L role in basket | Anchor, directional stability | The live event risk |
Options strategists including Charlie McElligott at Nomura and Kris Sidial at Ambrus Group, along with analytics platform SpotGamma, have long noted that combining deep in-the-money and near-the-money legs in one structure produces non-linear, path-dependent exposure. The stable legs anchor direction; the near-the-money leg drives the swings.
For you, that means the basket’s profit and loss into 30 September is not evenly distributed. The SanDisk leg is relatively anchored. The Micron leg is the live grenade, and knowing that is what separates reading this trade accurately from reading only the return figure.
What combining both profiles in one basket actually means for total risk
When deep in-the-money legs sit alongside a single near-the-money leg staring down a binary event, the near-the-money leg dominates the basket’s effective gamma. The whole structure starts to function as a leveraged bet on the Micron earnings outcome, regardless of what SanDisk, Intel, and Marvell do around it.
The correlation deepens the point. A weak Micron print would likely bleed negative sentiment across AI infrastructure broadly, dragging on Intel and Marvell as correlated names at the same time. The legs meant to provide breadth could all move the wrong way together.
The September 30 binary: Micron earnings as the fulcrum of the entire basket
Everything narrows to one date. Micron reports Q4 FY2026 earnings on 30 September, two days before the SanDisk expiration on 2 October and four days before the Micron expiration on 4 October. There is no time to recover from a bad print before the calls settle.
The scenarios split hard. Options markets were pricing an implied move of roughly 10.3% in either direction around the release.
Implied volatility pricing is what sets the 10.3% expected move figure the options market assigned to Micron’s earnings; the same strike at lower IV would have produced a fraction of that premium, and the relationship between IV, vega, and extrinsic value explains why the $44 million outlay was so sensitive to the volatility environment at purchase.
A 10% rally would carry shares from approximately $1,080 to above $1,180. That would leave the $1,000 calls with intrinsic value near $180 per contract, and could lift the position toward roughly $180 million.
A 10% decline would push shares to approximately $965. At that level the $1,000 calls expire worthless, destroying the full $44 million in premium.
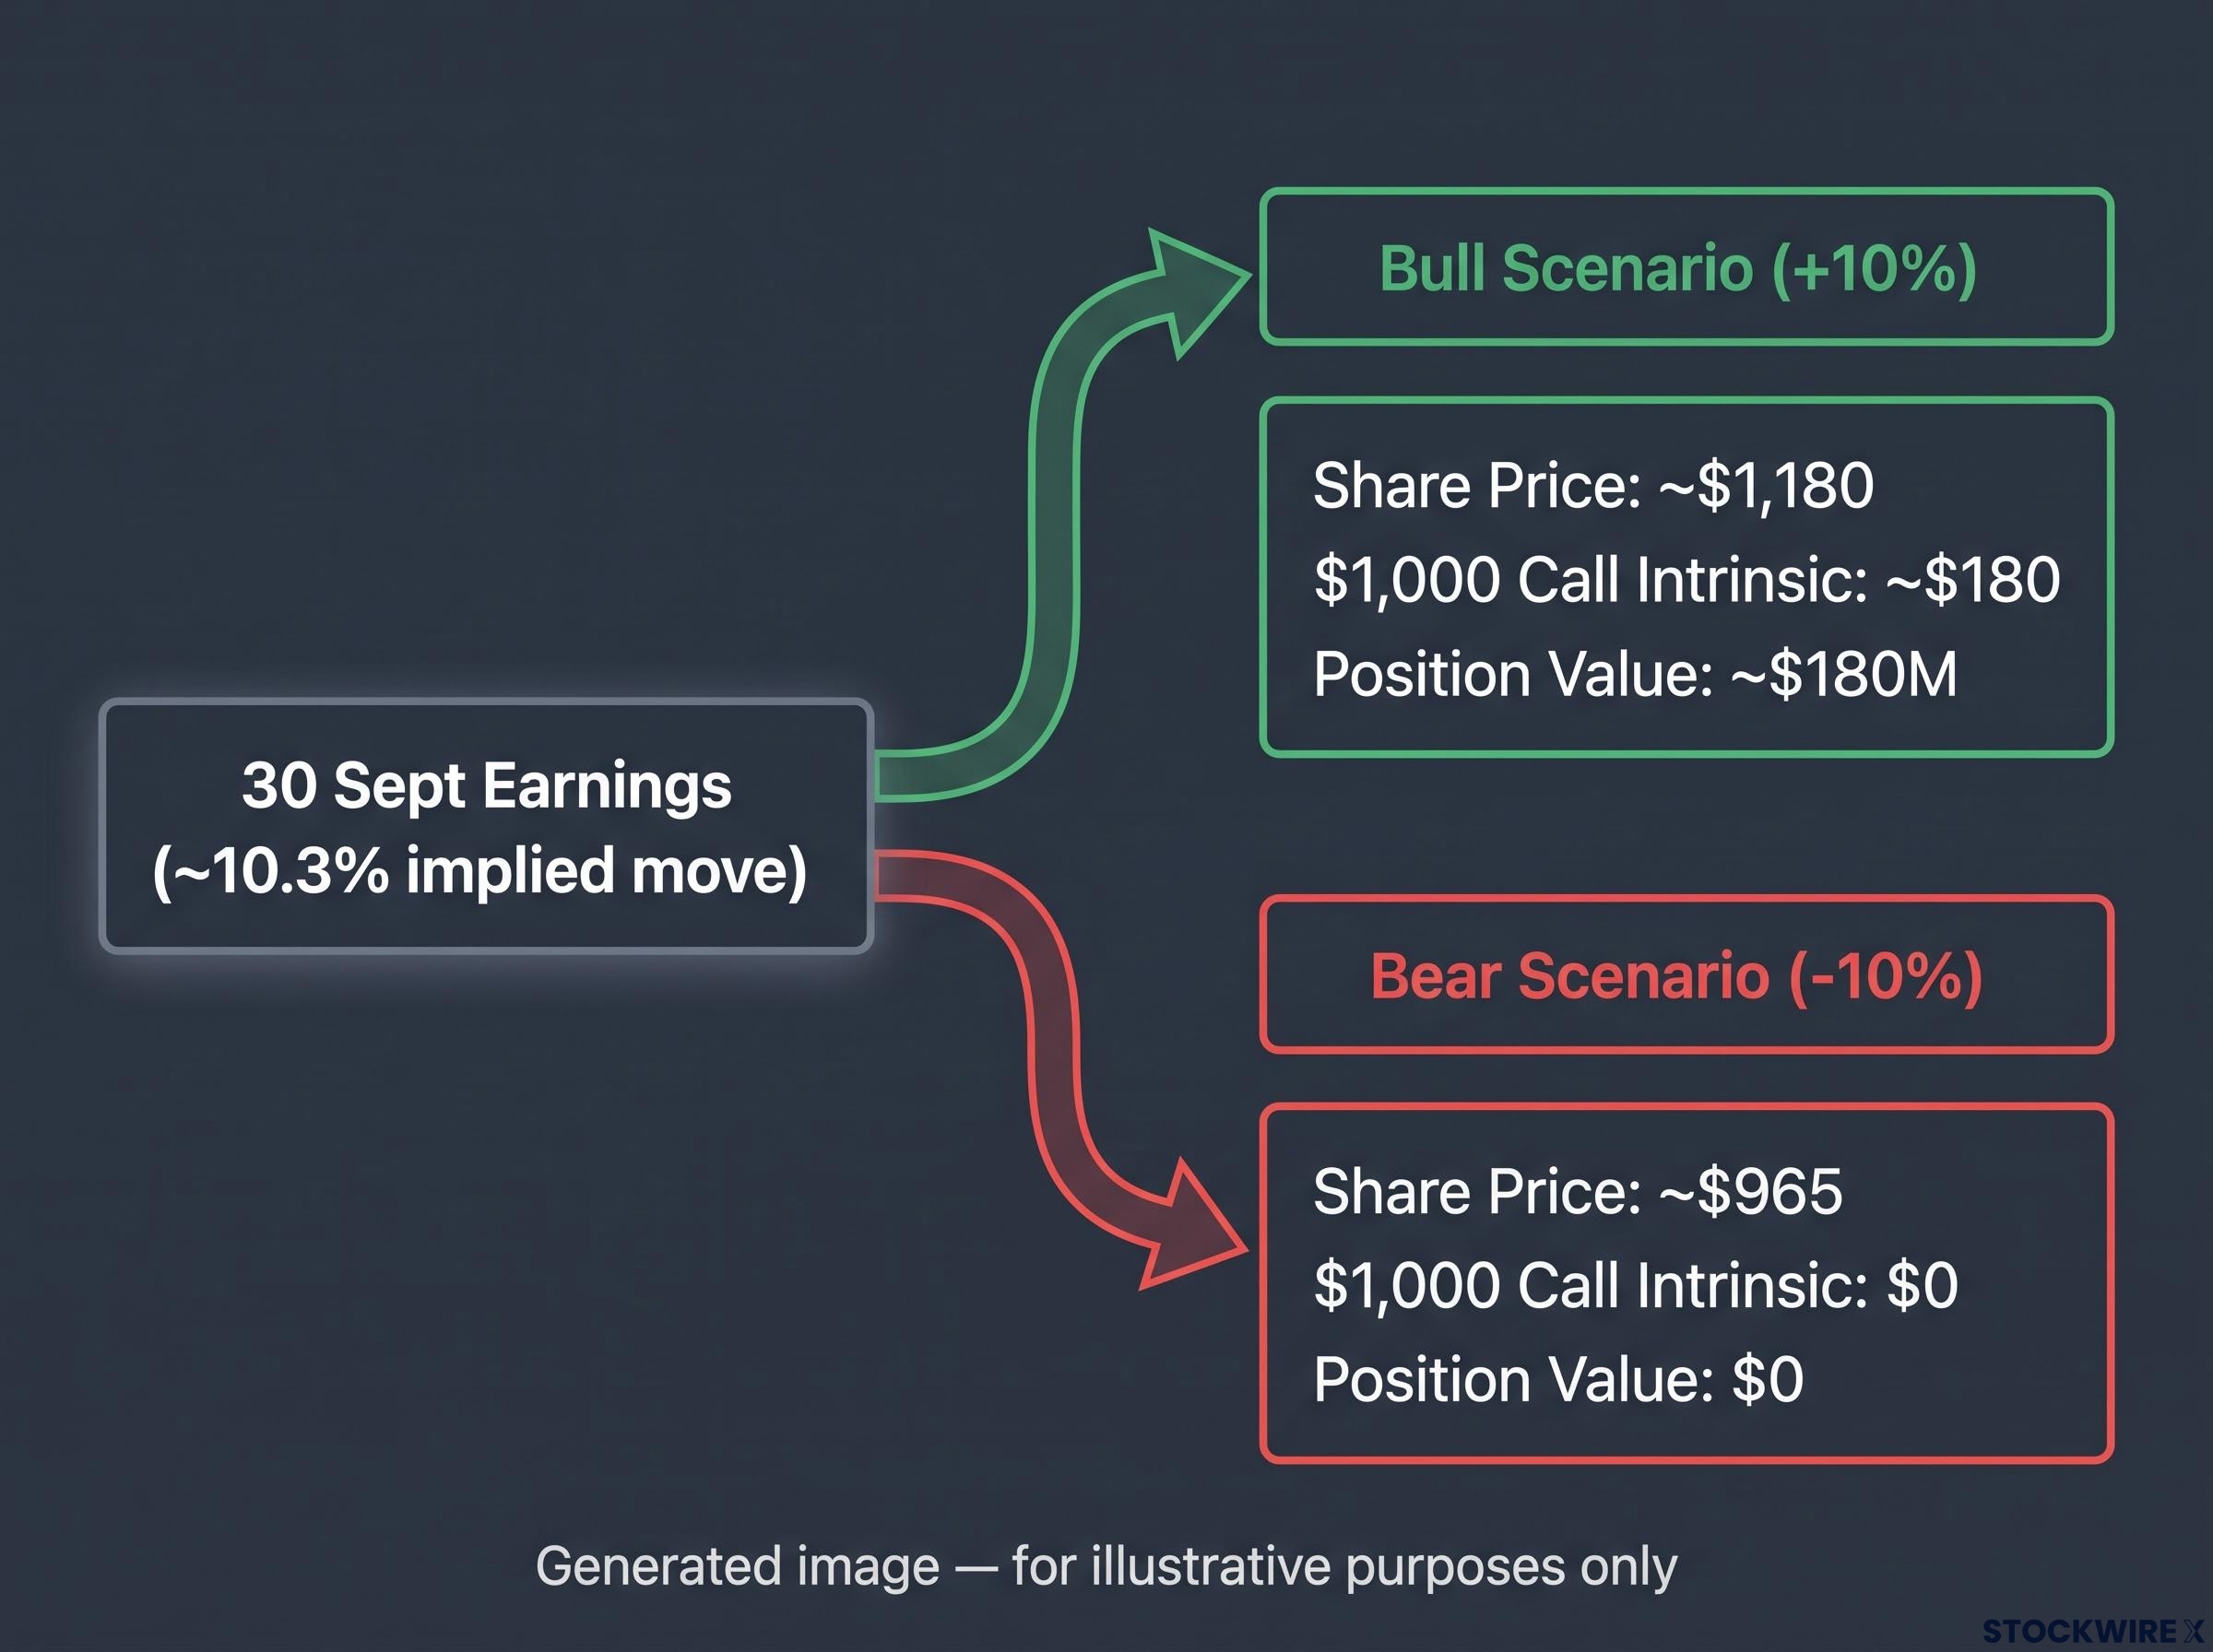
| Scenario | Move | Share Price | $1,000 Call Intrinsic | Position Value |
|---|---|---|---|---|
| Bull | +10% | ~$1,180 | ~$180 | ~$180M |
| Bear | -10% | ~$965 | $0 | $0 |
Approximately 10.3% in either direction priced in by options markets heading into Micron’s 30 September earnings.
Consensus heading in pointed to roughly $50.42 billion in revenue and $31.14 EPS, with Stifel modelling approximately $50.78 billion, slightly above Micron’s own guidance. That guidance, issued with Q3 results, called for around $50 billion in revenue at roughly 86% gross margin. For reference, Micron’s actual Q3 FY2026 print delivered $41.46 billion in revenue, a non-GAAP gross margin near 84.9%, and non-GAAP EPS around $25.11.
The most telling detail is what did not happen. As of 22 September, roughly 12,000 contracts of open interest sat at the $1,000 strike with no observable reduction or hedging activity on the tape.
That absence of visible trimming into a binary event of this size cuts two ways. It either signals high conviction in the bull case, or it signals that the position holder has a hedge sitting elsewhere in the book that simply does not appear on the options tape.
Either way, the read for anyone following this trade is the same. The Micron outcome is not a supporting factor. It is the single event that decides whether the basket’s most expensive leg prints a multi-hundred-million-dollar result or expires at zero.
Retail copycat flow and the three competing explanations for why a trade this size exists
An institutional basket becomes a market structure event when retail piles in behind it. Once news of the suspected buyer’s return circulated, retail traders reportedly began copying the same strikes and expiries, adding liquidity pressure to the underlying names.
The mechanism is concrete. Retail flow into identical strikes lifts open interest and volume, which forces dealer desks to delta-hedge by buying or selling the underlying, and concentrated flow at specific strikes can push prices through that hedging demand. Platforms such as Unusual Whales, Market Chameleon, and SpotGamma track and surface this institutional flow to retail audiences, which is precisely what creates the feedback loop.
Near a binary event, that dynamic sharpens into local gamma pockets, areas where dealer hedging accelerates price moves around key strikes. It is part of why these names may have moved on above-average volume.
The problem is that copying the visible leg is not the same trade the institution is running. The risks stack up fast:
- Sizing mismatch: institutions size to an entire portfolio and risk framework; matching the structure without matching the diversification leaves retail over-levered
- Motivation opacity: the position may hedge existing equity, convertibles, or structured products rather than express a pure directional view
- Execution quality: big desks work orders through algorithms and blocks; retail gets worse fills and wider spreads, especially in thin strikes
- Path dependency: multi-leg structures need active rolling, adjusting, and re-hedging that set-and-forget retail traders rarely apply
That opacity feeds directly into why a trade this size exists at all. There are three principal interpretations of large AI and semiconductor options flow:
- Informed directional bet: a levered expression of a bullish view on AI infrastructure spending, HBM demand, and long-duration memory pricing power, keyed to earnings beats and guidance revisions.
- Hedge or overlay: downside protection or an overlay on existing equity, convertible, or structured-product exposure, in which case the visible calls are managing risk rather than chasing upside.
- Volatility or dispersion trade: a bet on volatility or on single-name options versus index options across correlated semiconductor names, with no pure stock-specific intent at all.
Derivatives desks at Goldman Sachs and Morgan Stanley have consistently flagged air-pocket risk and the difficulty of dynamic hedging at scale around earnings, another reason inferring intent from the tape alone is incomplete.
Why the options tape alone cannot confirm which interpretation is correct
The absence of visible hedging in the Micron chain as of 22 September is suggestive, not conclusive. A hedge could exist in equity, futures, or structured-product form, entirely outside the options tape.
Financial media that attaches “smart money” certainty to every large flow underestimates how opaque institutional intent really is, and how wide the range of motivations behind a position this size can be. The practical implication for you is direct: copying the visible leg without knowing what it hedges is not replication. It is a different, potentially less-protected trade wearing the same clothes.
What the basket’s structure tells you about reading any large options position going forward
Strip away the specific names and this basket leaves you with a repeatable lens. Any concentrated sector options position can be read through four questions.
- Premium concentration: where does the capital actually sit? Here, two legs held 88% of the premium.
- Gamma profile by leg: which legs are anchored and which carry the event risk? The near-the-money Micron leg dominated the gamma.
- Binary event proximity: is there a catalyst before expiration? The 30 September earnings landed two days before the SanDisk expiry.
- Observable position management: has the position been trimmed or hedged? No visible reduction appeared at the $1,000 strike.
Run those four checks and you know what kind of trade you are looking at, rather than guessing from the aggregate return.
The 30 September outcome will resolve some of this and leave the rest open. It will confirm or deny the memory AI demand thesis for this cycle in the most direct way possible. It will not tell you whether the institutional holder was expressing a directional view or running the calls as a hedge leg.
The secular backdrop is why the leverage exists at all. Micron has locked in 16 take-or-pay strategic customer agreements securing multi-year supply, evidence management points to for reduced cyclicality, and it expects tight conditions to persist beyond calendar 2027.
AI-related DRAM and NAND data-center bit TAM exceeded 50% of industry TAM in calendar 2026, the structural backdrop for elevated options positioning across semiconductor names.
Read against that backdrop, the Micron event is more than a test of one position. It is the market’s real-time verdict on whether the AI memory upcycle has the earnings power to justify the leverage built around it.
For investors wanting to position around Micron beyond the immediate earnings window, our deep-dive into semiconductor cycle timing examines the five-indicator framework for identifying when peak-cycle gains begin to erode ahead of the 2027-2029 supply wave.
Reading the tape after September 30
The basket stands at roughly $202.2 million in intrinsic value, more than 90% of it concentrated in SanDisk and Micron, with the Micron leg carrying the dominant gamma into a binary print. The 30 September earnings, the 2 October SanDisk expiry, and the 4 October Micron expiry now form a four-day corridor that decides the trade.
Timeline: 30 September earnings, then SanDisk expiry on 2 October, then Micron expiry on 4 October.
That date will test the memory AI demand thesis in the most direct way available, with the options-implied 10.3% move standing as the market’s own measure of uncertainty. It will not settle what the original trade actually was, directional, hedge, or volatility play, without fuller information than the tape provides.
So if you are using this basket as a signal, the question is not whether it has performed well to date. It is whether the Micron earnings risk is one you have independently assessed against a supply backdrop expected to stay tight through 2027, rather than simply inherited from the tape.
This article is for informational purposes only and should not be considered financial advice. Investors should conduct their own research and consult with financial professionals before making investment decisions. Past performance does not guarantee future results. Financial projections are subject to market conditions and various risk factors. These statements are speculative and subject to change based on market developments and company performance.