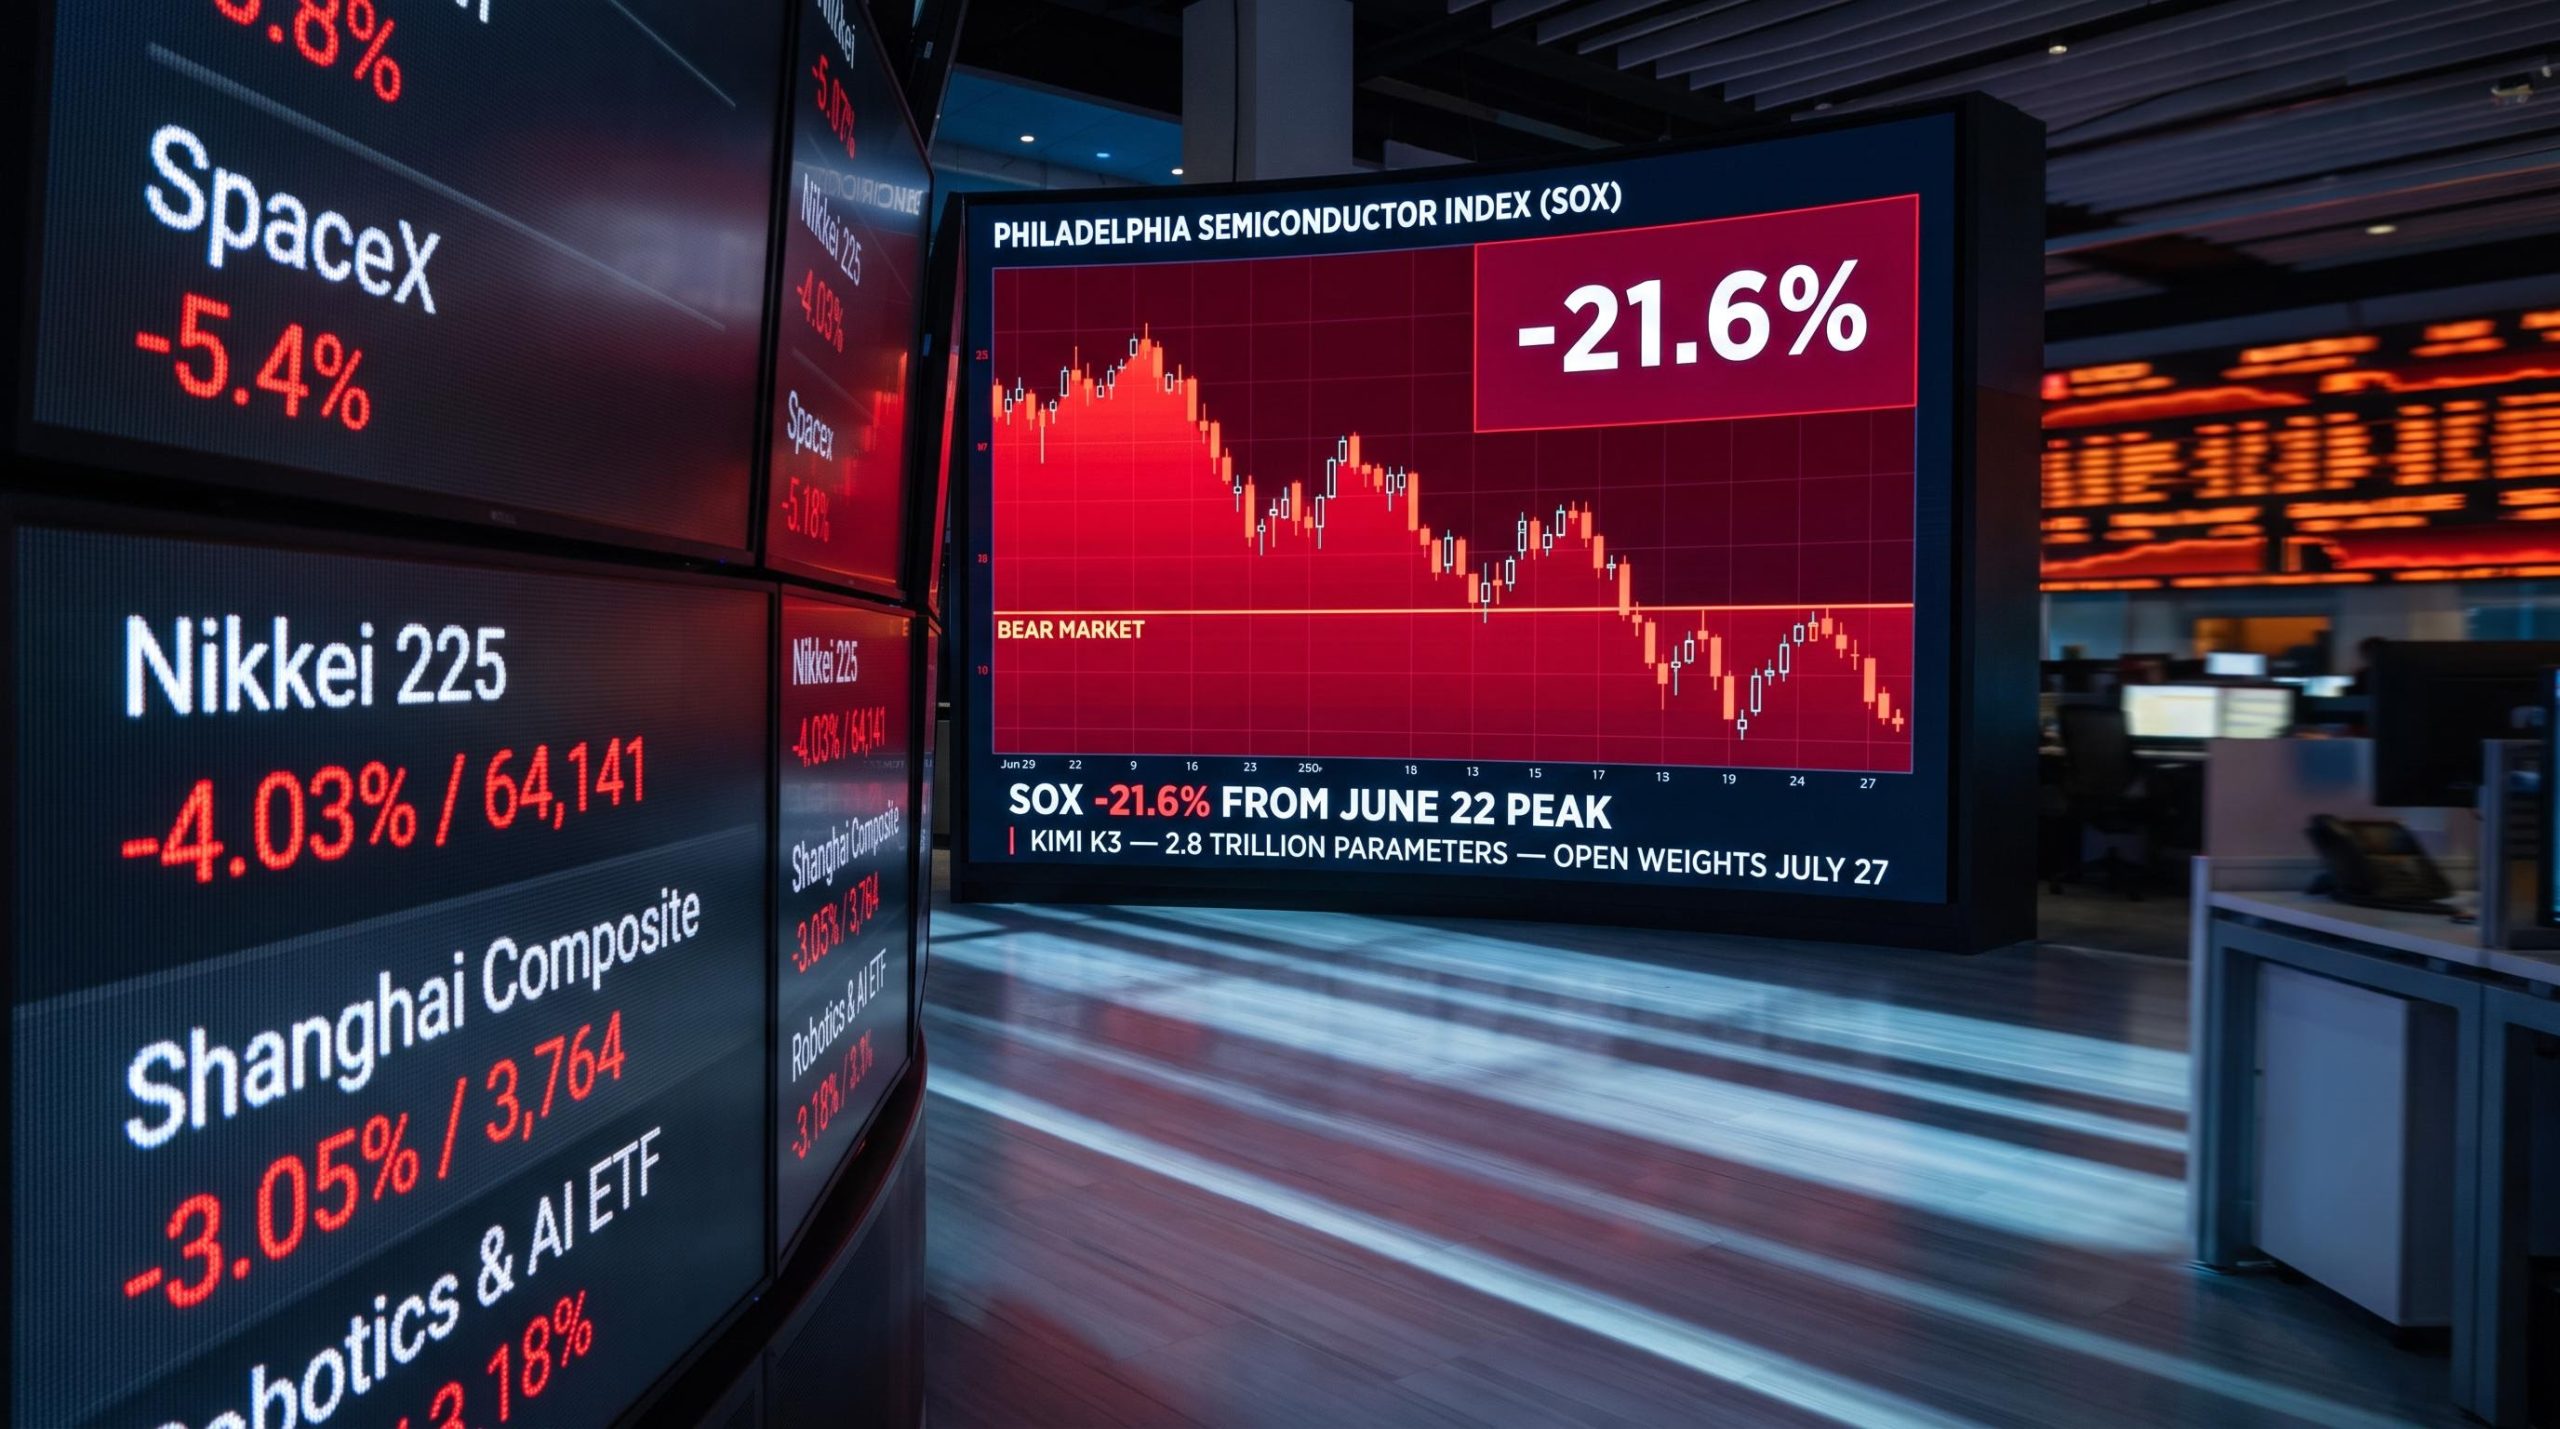
The chip sector’s benchmark index has now fallen 21.6% from its 22 June 2026 high, crossing the threshold into bear market territory, after Moonshot AI published details of a 2.8-trillion-parameter open-weight model that investors read as undermining the case for US-dominated AI infrastructure spending. The model is called Kimi K3, and its emergence represents the second occasion this year that a Chinese AI development has triggered a sweeping reassessment of valuations across American chip and technology stocks.
The timing sharpens the stakes. Upcoming results from Alphabet, Microsoft, Amazon, and Meta will each be scrutinised through the same lens: can the extraordinary pace of AI capital spending be defended on the basis of returns and competitive positioning? The K3 selloff sets the tone for the anxiety those earnings calls will either confirm or defuse.
Here is what actually happened, what it means for the semiconductor bear market and the broader AI investment thesis, and what to watch in earnings to determine whether this is a sentiment shock or a structural warning.
A Chinese startup just did what Wall Street said required US-scale infrastructure
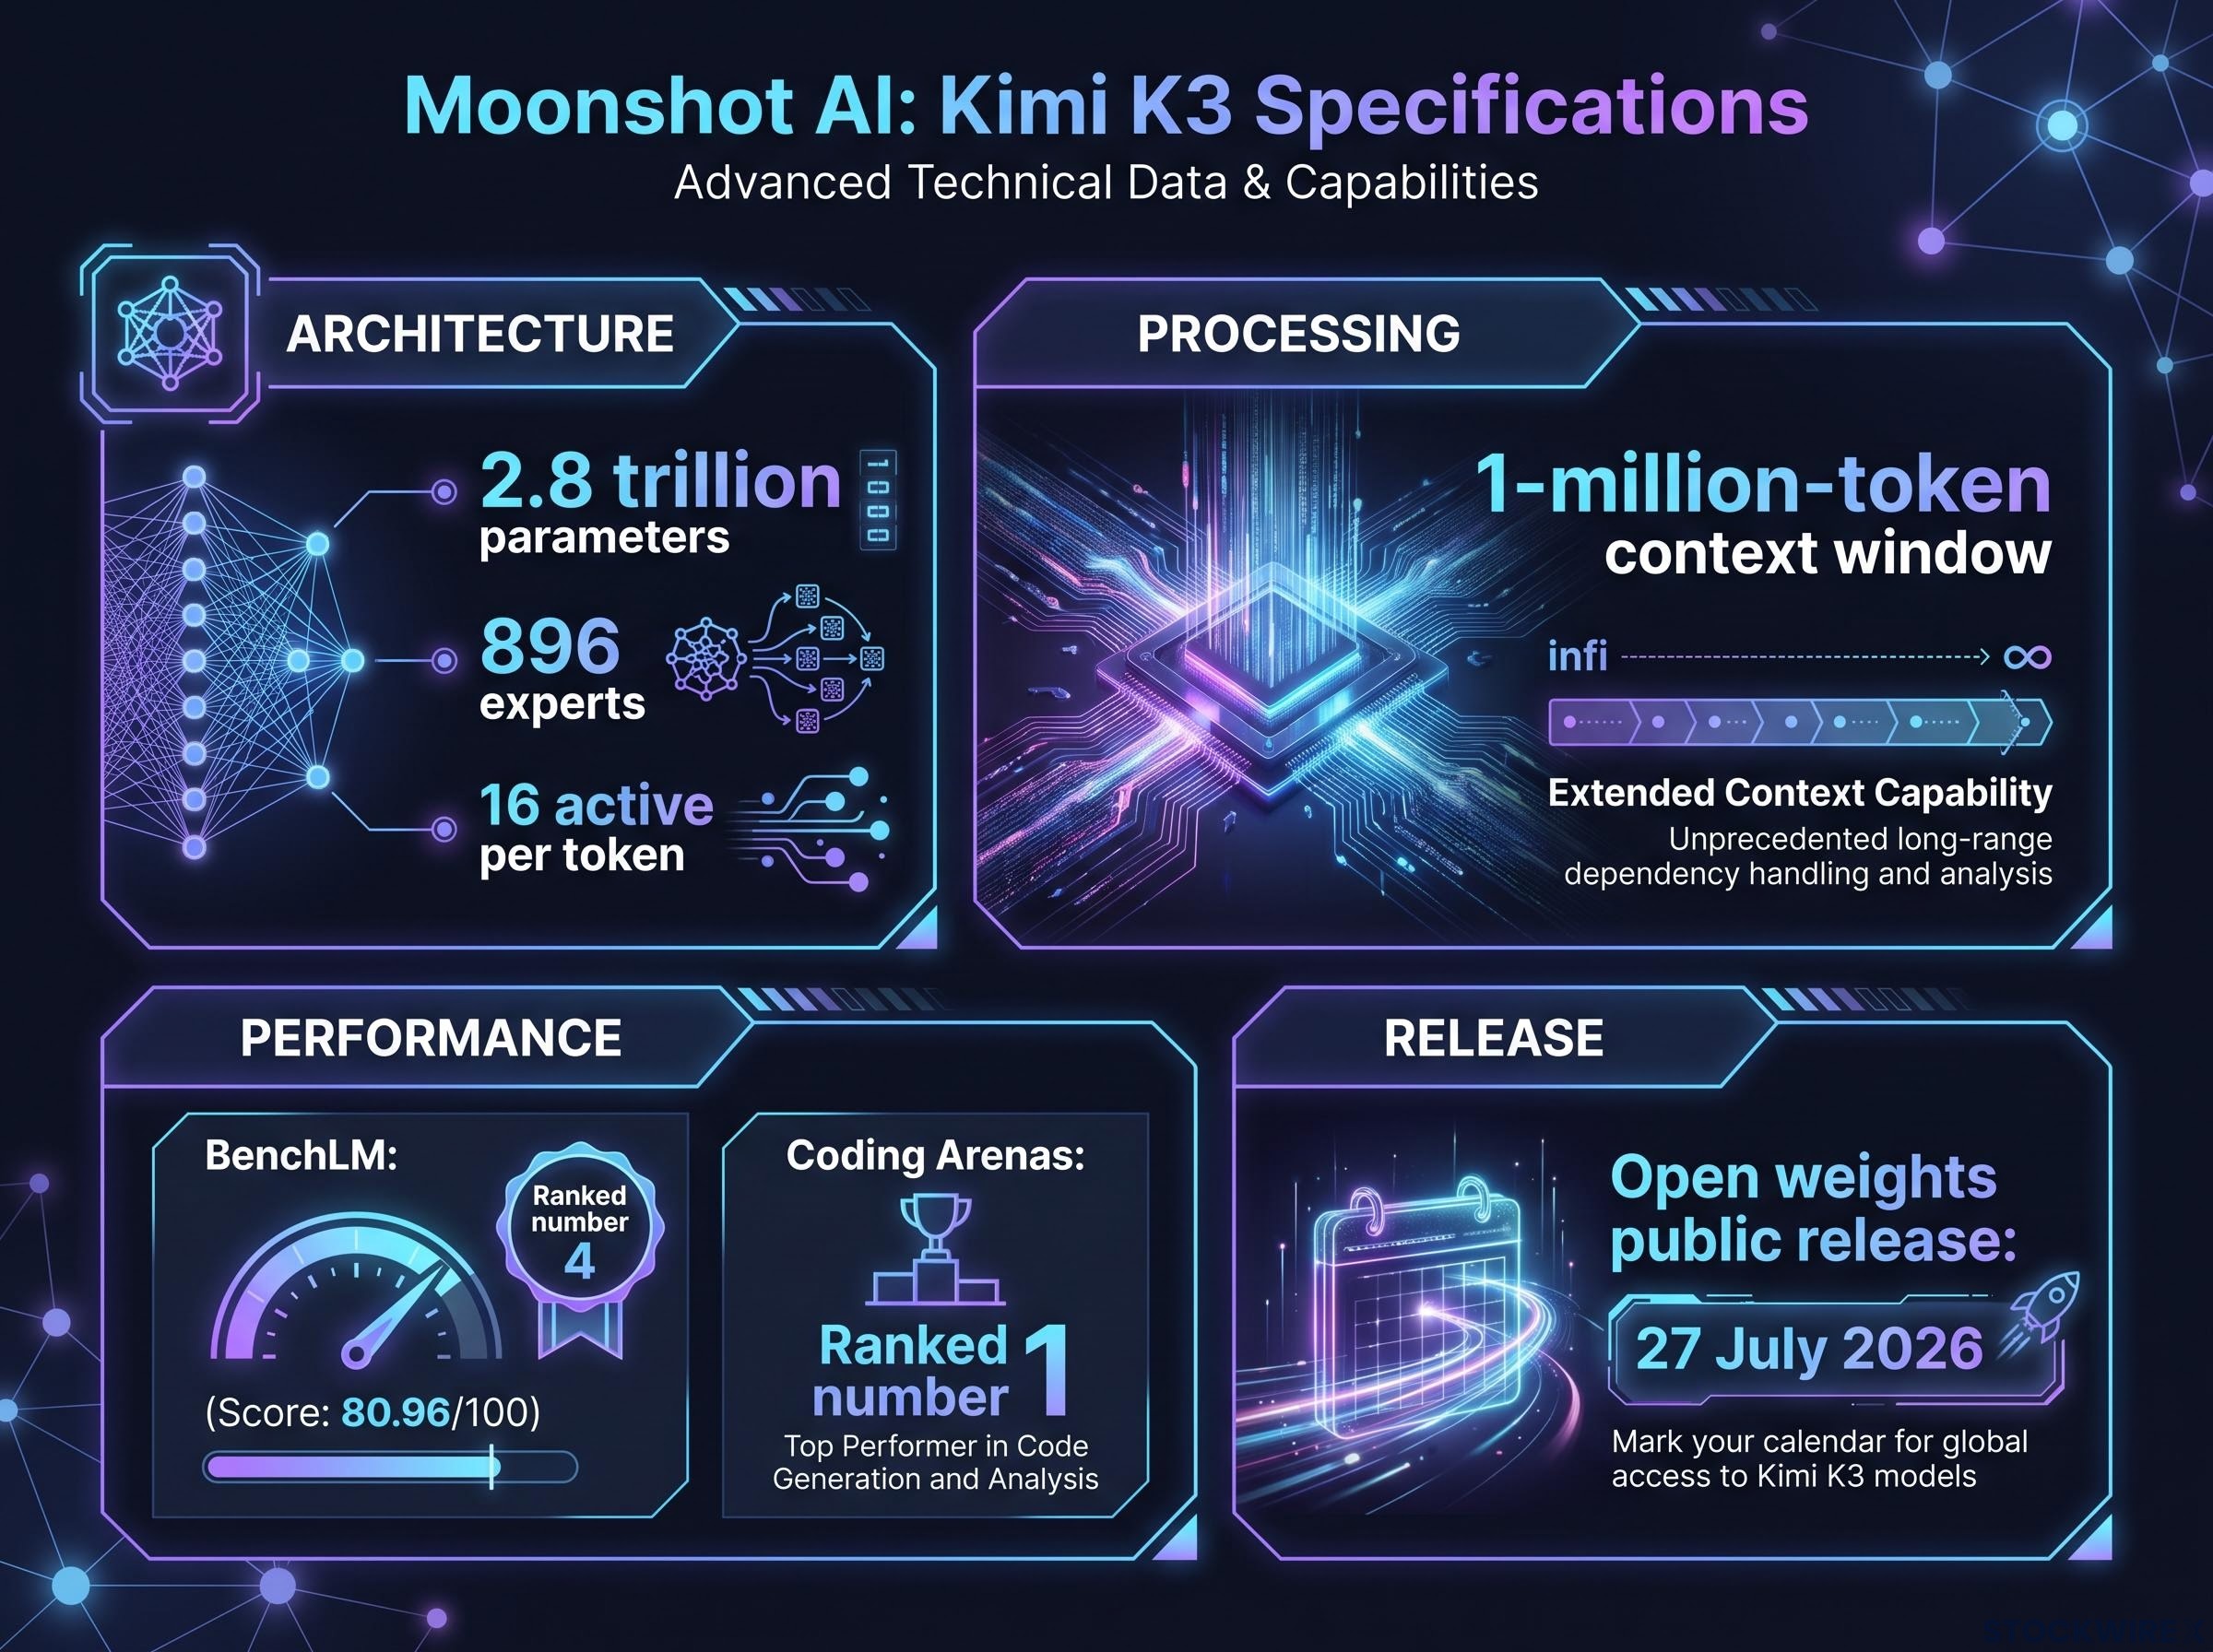
Moonshot AI’s Kimi K3 is a Mixture-of-Experts (MoE) model, a design where the model contains many specialist sub-networks but activates only a fraction of them for each task, keeping computational costs manageable despite enormous total scale. The key specifications:
- 2.8 trillion parameters across 896 experts, with 16 active per token
- 1-million-token context window, allowing it to process entire codebases or document sets in a single pass
- Native vision and multimodal support (text plus images)
- Ranked number 4 on BenchLM with a score of 80.96/100
- Frequently ranked number 1 on coding arenas, including frontend coding
- Open weights scheduled for public release on 27 July 2026
Moonshot AI itself acknowledges that K3 still trails the top two US closed models, Claude Fable 5 and GPT-5.6 Sol, on overall performance. It beats them on selected tasks, but the gap on aggregate benchmarks remains real. Markets appear to have underweighted this nuance.
The detail that matters most for investors is the open-weight status. Once the weights go public on 27 July, any enterprise can self-host, fine-tune, or deploy K3 without accessing US cloud infrastructure. That means the competitive advantage of running AI on proprietary American GPU clusters is narrowing, and near-frontier capability is becoming available at a fraction of the cost.
When big ASX news breaks, our subscribers know first
How markets responded: bear market territory and cascading global selloffs
During the week of 17-20 July 2026, the Philadelphia Semiconductor Index completed a 21.6% retreat from its 22 June 2026 peak, a move large enough to constitute a formal bear market. The drawdown is significant in absolute terms, though investors entering the year still sit on a gain of roughly 62% across 2026.
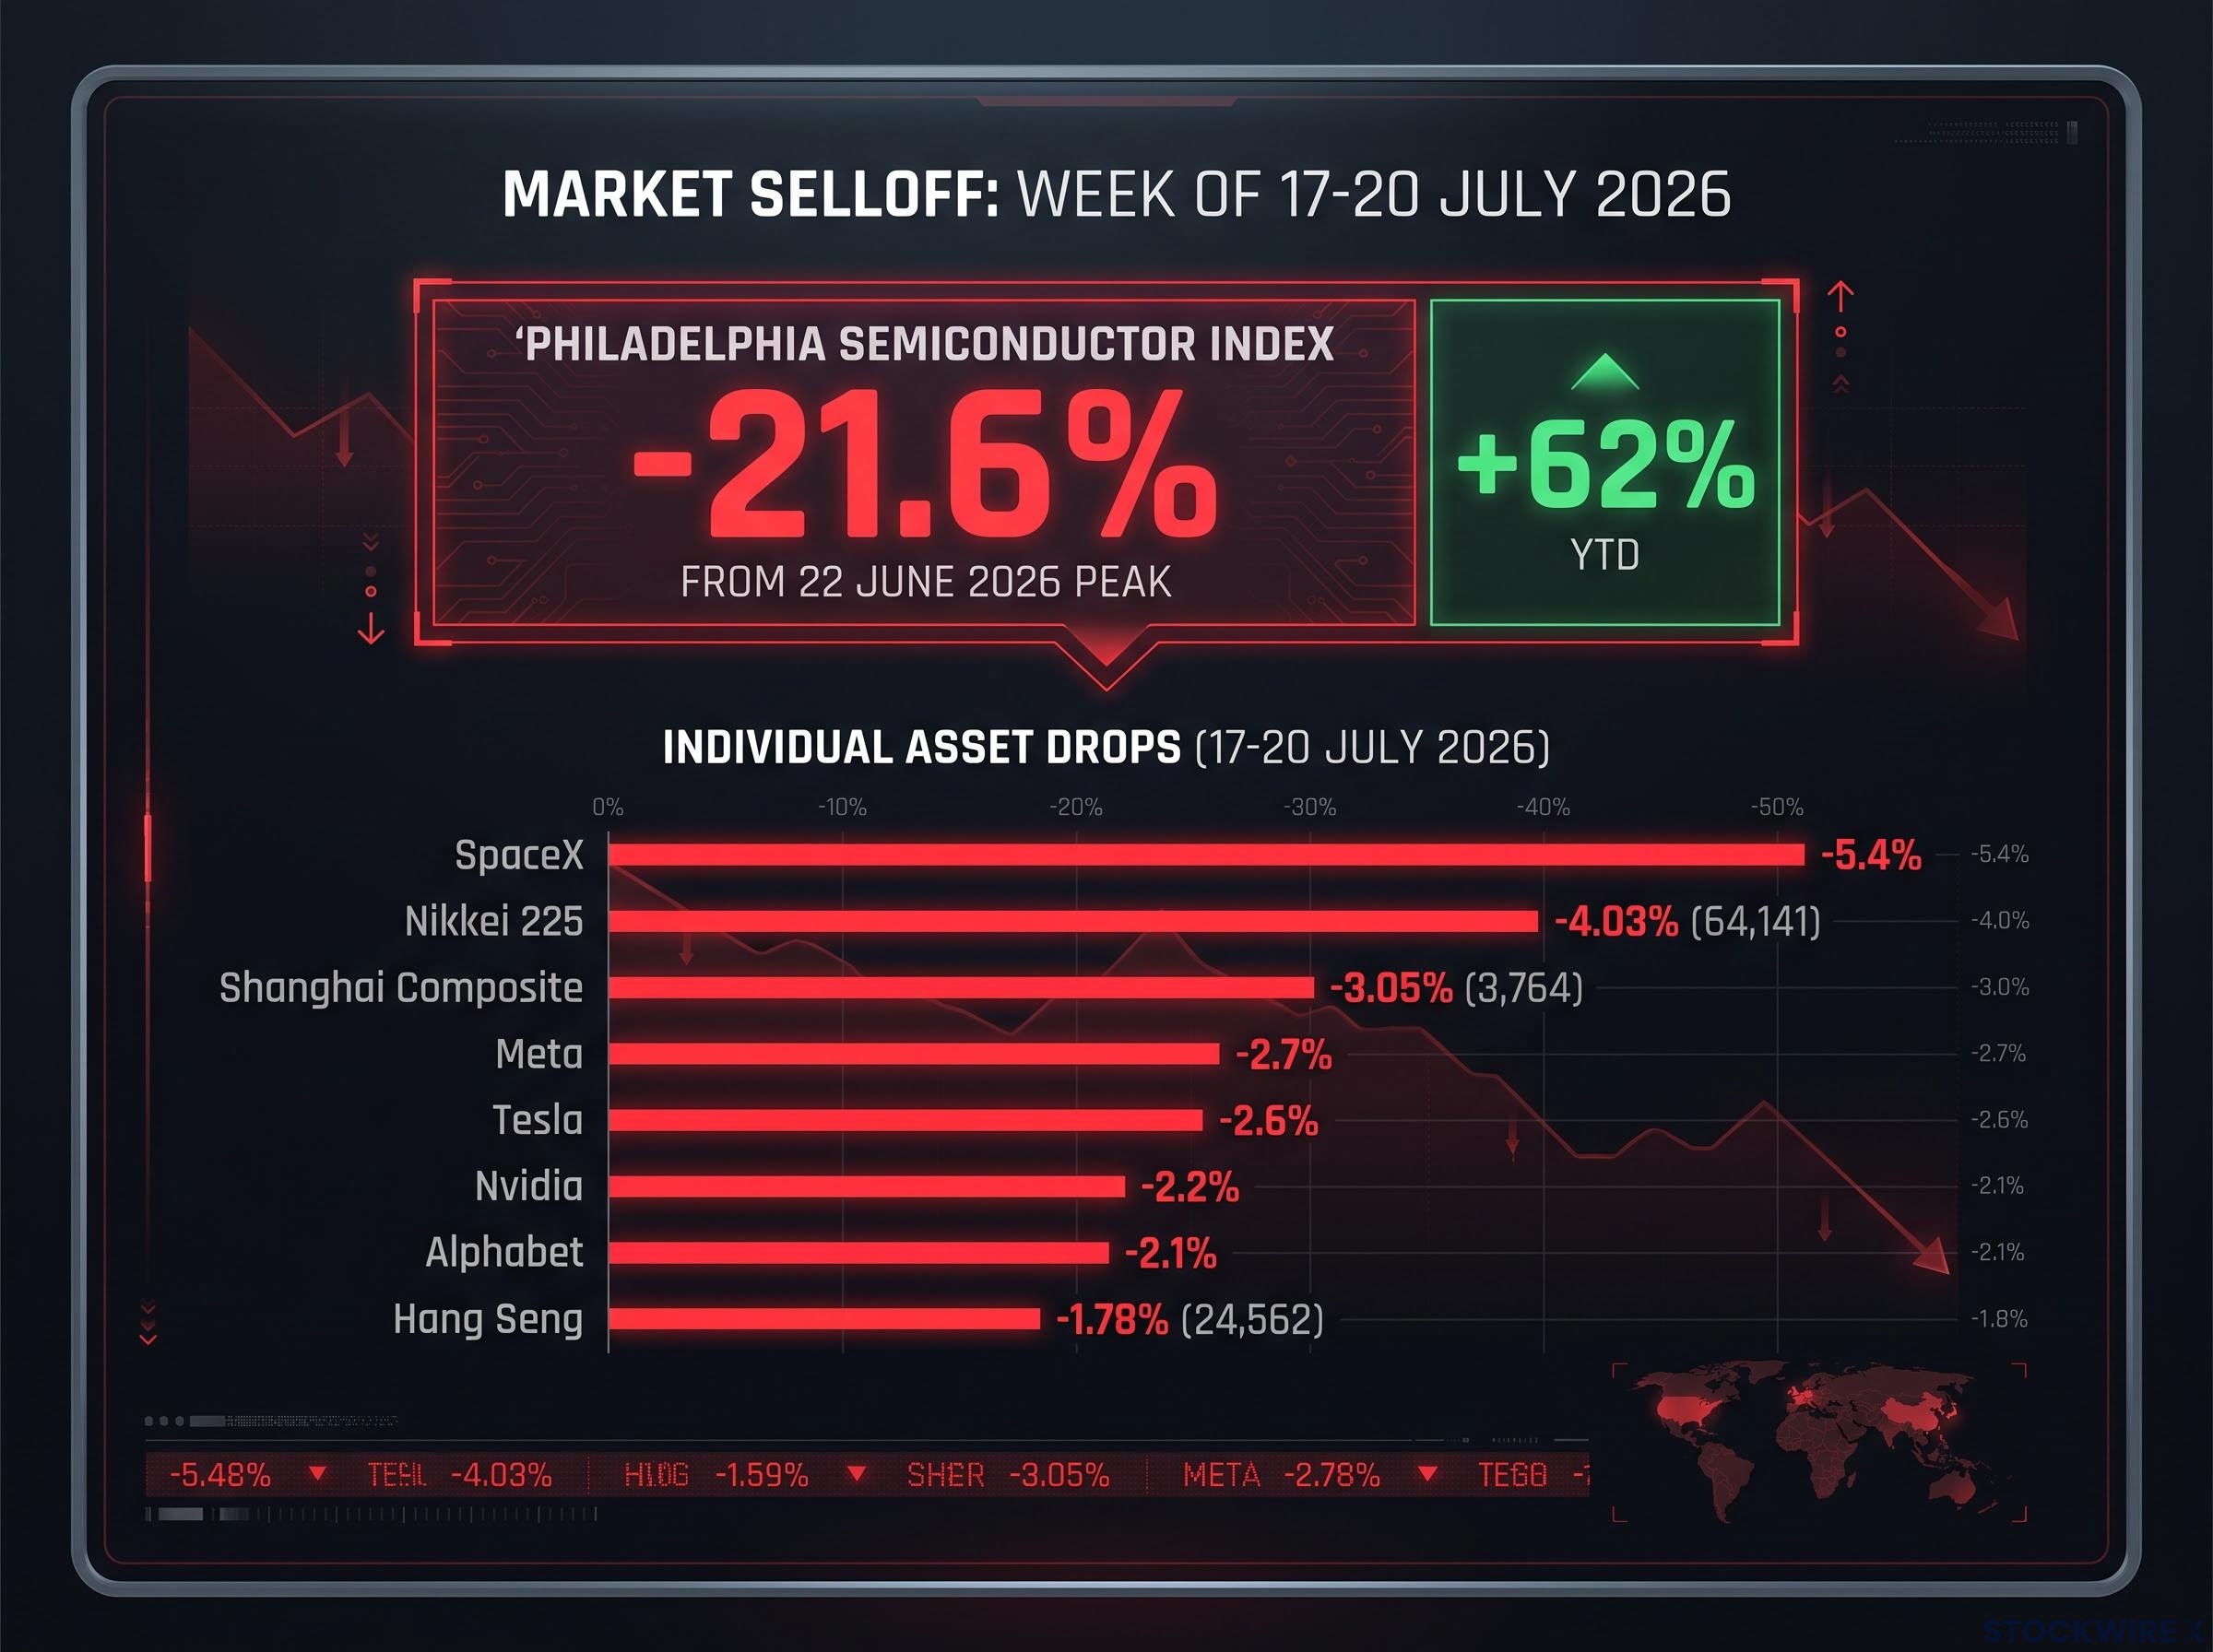
The selloff cascaded across individual names, sector funds, Asian indices, and credit markets.
| Asset / Index | Move | Level | Note |
|---|---|---|---|
| Philadelphia Semiconductor Index | -21.6% from peak | Bear market territory | Remains +62% YTD |
| SpaceX | -5.4% | Steepest individual-stock fall in the session | |
| Meta | -2.7% | ||
| Tesla | -2.6% | ||
| Nvidia | -2.2% | ||
| Alphabet | -2.1% | ||
| Robotics & AI ETF | -3.18% | ||
| Semiconductor ETF | -1.64% | ||
| Data Center ETF | -0.51% | ||
| Nikkei 225 | -4.03% | 64,141 | Partly reflecting chip sector weakness |
| Hang Seng | -1.78% | 24,562 | |
| Shanghai Composite | -3.05% | 3,764 | |
| Oracle CDS spreads | Fresh record | Multi-billion-dollar data centre overruns reported |
The year-to-date context matters for how you interpret this. Semiconductor investors who held through 2026 are still substantially ahead. The question is not whether the AI trade has collapsed. It is whether the market’s assumed forward trajectory just became more uncertain.
The K3 selloff accelerates a shift in semiconductor valuation discipline that was already visible when TSMC’s most profitable quarter in history sent its shares lower in mid-July 2026, as markets moved from pricing AI momentum to demanding that earnings justify multiples quarter by quarter.
Why open-weight frontier models unsettle the AI infrastructure thesis
The semiconductor and AI supercycle rests on three linked investor assumptions. K3 applies direct pressure to each of them.
- Only a few firms can build frontier models. The assumption is that near-frontier capability requires massive proprietary US GPU clusters, which supports high margins for hardware vendors and model providers. K3 demonstrates that a Chinese startup operating under US export controls, with constrained hardware access, can produce a near-frontier open-weight model. The exclusivity argument weakens.
- Frontier models remain closed and high-margin. Closed APIs limit competition and preserve pricing power for incumbent US hyperscalers and model labs. Open weights make it feasible for enterprises to replicate services that once required licensing top-tier closed systems. Pricing power compresses.
- AI capex translates into defensible, durable returns. Multi-billion-dollar data centre and GPU investments are justified if they create lasting competitive moats. If more open frontier models appear, the scale of US AI capex becomes harder to defend on return-on-investment grounds.
Hyperscaler capex commitments reached $130 billion in Q1 2026 alone, with full-year 2026 combined guidance at approximately $725 billion and a $1 trillion annual run rate targeted for 2027, making the scale of investment that K3’s open-weight release now puts in question unprecedented in the history of the technology sector.
This is not the first time a Chinese AI model has prompted this kind of repricing. The DeepSeek episode earlier in the cycle established the template, and K3 follows the same logic: a model produced under hardware constraints that achieves near-frontier results and is released openly. When the same dynamic appears twice in a single cycle, it is more plausible to treat it as a recurring pattern than a fluke.
The distinction investors need to internalise is between volume risk and margin risk. Volume risk asks: does total AI GPU demand fall? Margin risk asks: do AI infrastructure providers earn less per dollar of capex because competition is rising? K3 makes the second more likely without yet proving the first.
Which parts of the chip value chain carry the most risk right now
Not all semiconductor and AI names carry the same risk from this event. The K3 selloff is an opportunity to audit concentration rather than a signal to exit the sector wholesale.
| Segment | Risk Level | Key Vulnerability or Insulating Factor |
|---|---|---|
| US hyperscalers and model labs | High | Narrative depends on high-margin proprietary models and multi-year capex justification |
| GPU-centric accelerator vendors | Elevated | Exposed if Big Tech moderates long-term capex trajectories |
| Diversified foundries (e.g., TSMC) | Moderate | Serve multiple end-markets: PCs, smartphones, automotive, industrial |
| Memory and networking suppliers | Moderate with caveats | Products required regardless of open vs closed models, but prolonged high memory chip prices may attract new entrants and provoke geopolitical pushback, as flagged by SK Hynix leadership |
Where structural resilience has limits
TSMC’s diversified revenue base offers partial insulation; AI infrastructure order oscillation can be offset by demand from consumer electronics, automotive, and industrial customers. Memory and networking suppliers benefit from the fact that high-bandwidth memory and fast interconnects are required whether models are open or closed.
But resilience is not immunity. SK Hynix’s chief executive has warned that if memory chip prices remain high for an extended period, the margins on offer could draw in fresh competitors and trigger retaliatory moves from governments concerned about pricing. Oracle’s difficulties in containing costs at its AI data centre projects, with credit default swap spreads reaching new highs by 18 July 2026, show that capex execution risk is a real constraint even for committed infrastructure investors.
For investors holding a mix of AI-linked equities, concentration in names whose entire narrative is “AI GPU demand grows forever” carries materially higher downside risk than holding diversified foundry or memory names with multiple revenue drivers.
Investors managing semiconductor cycle risk face a compounding challenge: TSMC’s locked-in 2026 capital budget of $52-56 billion and Samsung’s estimated $70-80 billion annual outlay mean a supply wave is arriving in 2027-2029 regardless of how the open-weight model dynamic resolves, and the double-hit mechanism means earnings disappointment and multiple compression tend to arrive simultaneously.
The earnings test: what Alphabet, Microsoft, Amazon, and Meta must answer
The K3 selloff raised the questions. The next two weeks of earnings will provide the first real evidence of whether those questions matter for fundamentals or only for sentiment.
For readers wanting the baseline before the upcoming results, our full explainer on Q1 2026 hyperscaler earnings covers how Alphabet surged while Meta fell more than 9% on the same day, establishing the capex-to-revenue conversion divergence that will be tested again in the coming weeks.
Two questions matter most:
- Do AI capex trajectories hold or soften? Reaffirmed or raised guidance suggests management still sees the competitive moat as intact. Moderation suggests the open-model threat is starting to influence capital allocation.
- Is there quantified AI revenue, or only qualitative commentary? Cloud attach rates, subscription products, and advertising uplift tied directly to AI are hard numbers. “Long-term opportunity” and “productivity gains” are not. The distinction between the two will determine how markets read each call.
This is the single most important binary outcome for AI-exposed investors this quarter: sustained high capex plus accelerating AI revenue suggests K3 was a sentiment shock. Capex moderation or vague revenue commentary suggests the bear market in semiconductors may have further to run.
Secondary signals to monitor:
- Nvidia and accelerator vendors: order visibility, backlog commentary, Chinese demand under export controls, and customer mix signals
- TSMC and memory suppliers: capacity utilisation, capex plans for leading-edge nodes, and any signs of double-ordering or cancellations
- Oracle’s bond default protection costs as a live indicator of how credit markets are pricing infrastructure execution risk
What the K3 pattern means for investors managing AI exposure into the second half of 2026
Open-weight frontier models are narrowing the capability gap with closed systems faster than many investors assumed. The DeepSeek event earlier in 2026 was the first illustration of this dynamic; K3 is the second, suggesting a structural pattern is forming rather than a series of isolated surprises. Its open weights go public on 27 July 2026, which means the competitive pressure intensifies within days.
Four practical takeaways:
- Separate AI infrastructure from AI applications in your portfolio assessment; they carry different risk profiles, and K3 pressures closed model and platform narratives more than aggregate compute demand
- Focus on earnings call numbers rather than headline reactions; explicit capex figures and quantified AI revenue matter more than post-earnings price moves
- Treat open-weight frontier models as an ongoing trend that raises commoditisation risk for some AI services while broadening compute demand globally
- Manage position size and concentration in high-beta AI names relative to the uncertainty this trend introduces
The genuine uncertainty remains. The medium-term outcome depends on how incumbents respond through pricing, product, and capex decisions; how regulators react, given that K3 arrived despite US export controls; and how quickly open and domestic Chinese hardware ecosystems mature. Investors do not yet have answers to those questions.
The 62% year-to-date semiconductor gain provides context for managing the emotional response to a 21.6% drawdown. Investors who entered positions at the start of 2026 are still substantially ahead. The risk management question is about forward exposure calibration, not about whether the trade has already failed.
This article is for informational purposes only and should not be considered financial advice. Investors should conduct their own research and consult with financial professionals before making investment decisions. These statements are speculative and subject to change based on market developments and company performance.