
Goldman Flags $100 Billion CTA Selling Threat in U.S. Equities
2 mins ago

Samsung Electronics and SK Hynix have collectively gained 798% from their 500-day trough, according to Jefferies analysis published on 2 June 2026. That figure exceeds the 717% peak advance recorded during the dot-com IT bubble, a benchmark that stood for more than two decades as the outer limit of what semiconductor stocks could deliver in a single rally phase. Jefferies is not treating the comparison as a warning. The bank believes both stocks have further room to run, sustained by earnings strength and retail investor demand that, in its assessment, show no signs of exhaustion. What follows is an examination of the rally’s scale, the structural logic behind Jefferies’ continued optimism, the specific conditions that would signal the cycle is turning, and why this AI-era semiconductor run may differ from every prior boom-and-bust pattern investors have encountered.
The acceleration began in late May 2026. By 2 June, the combined advance from the 500-day trough had reached 798%, per Jefferies, clearing the prior dot-com era peak of 717% by a significant margin.
The combined 798% rally from the 500-day trough now exceeds the 717% peak recorded during the dot-com IT bubble, making this the largest comparable semiconductor stock advance in modern market history, according to Jefferies.
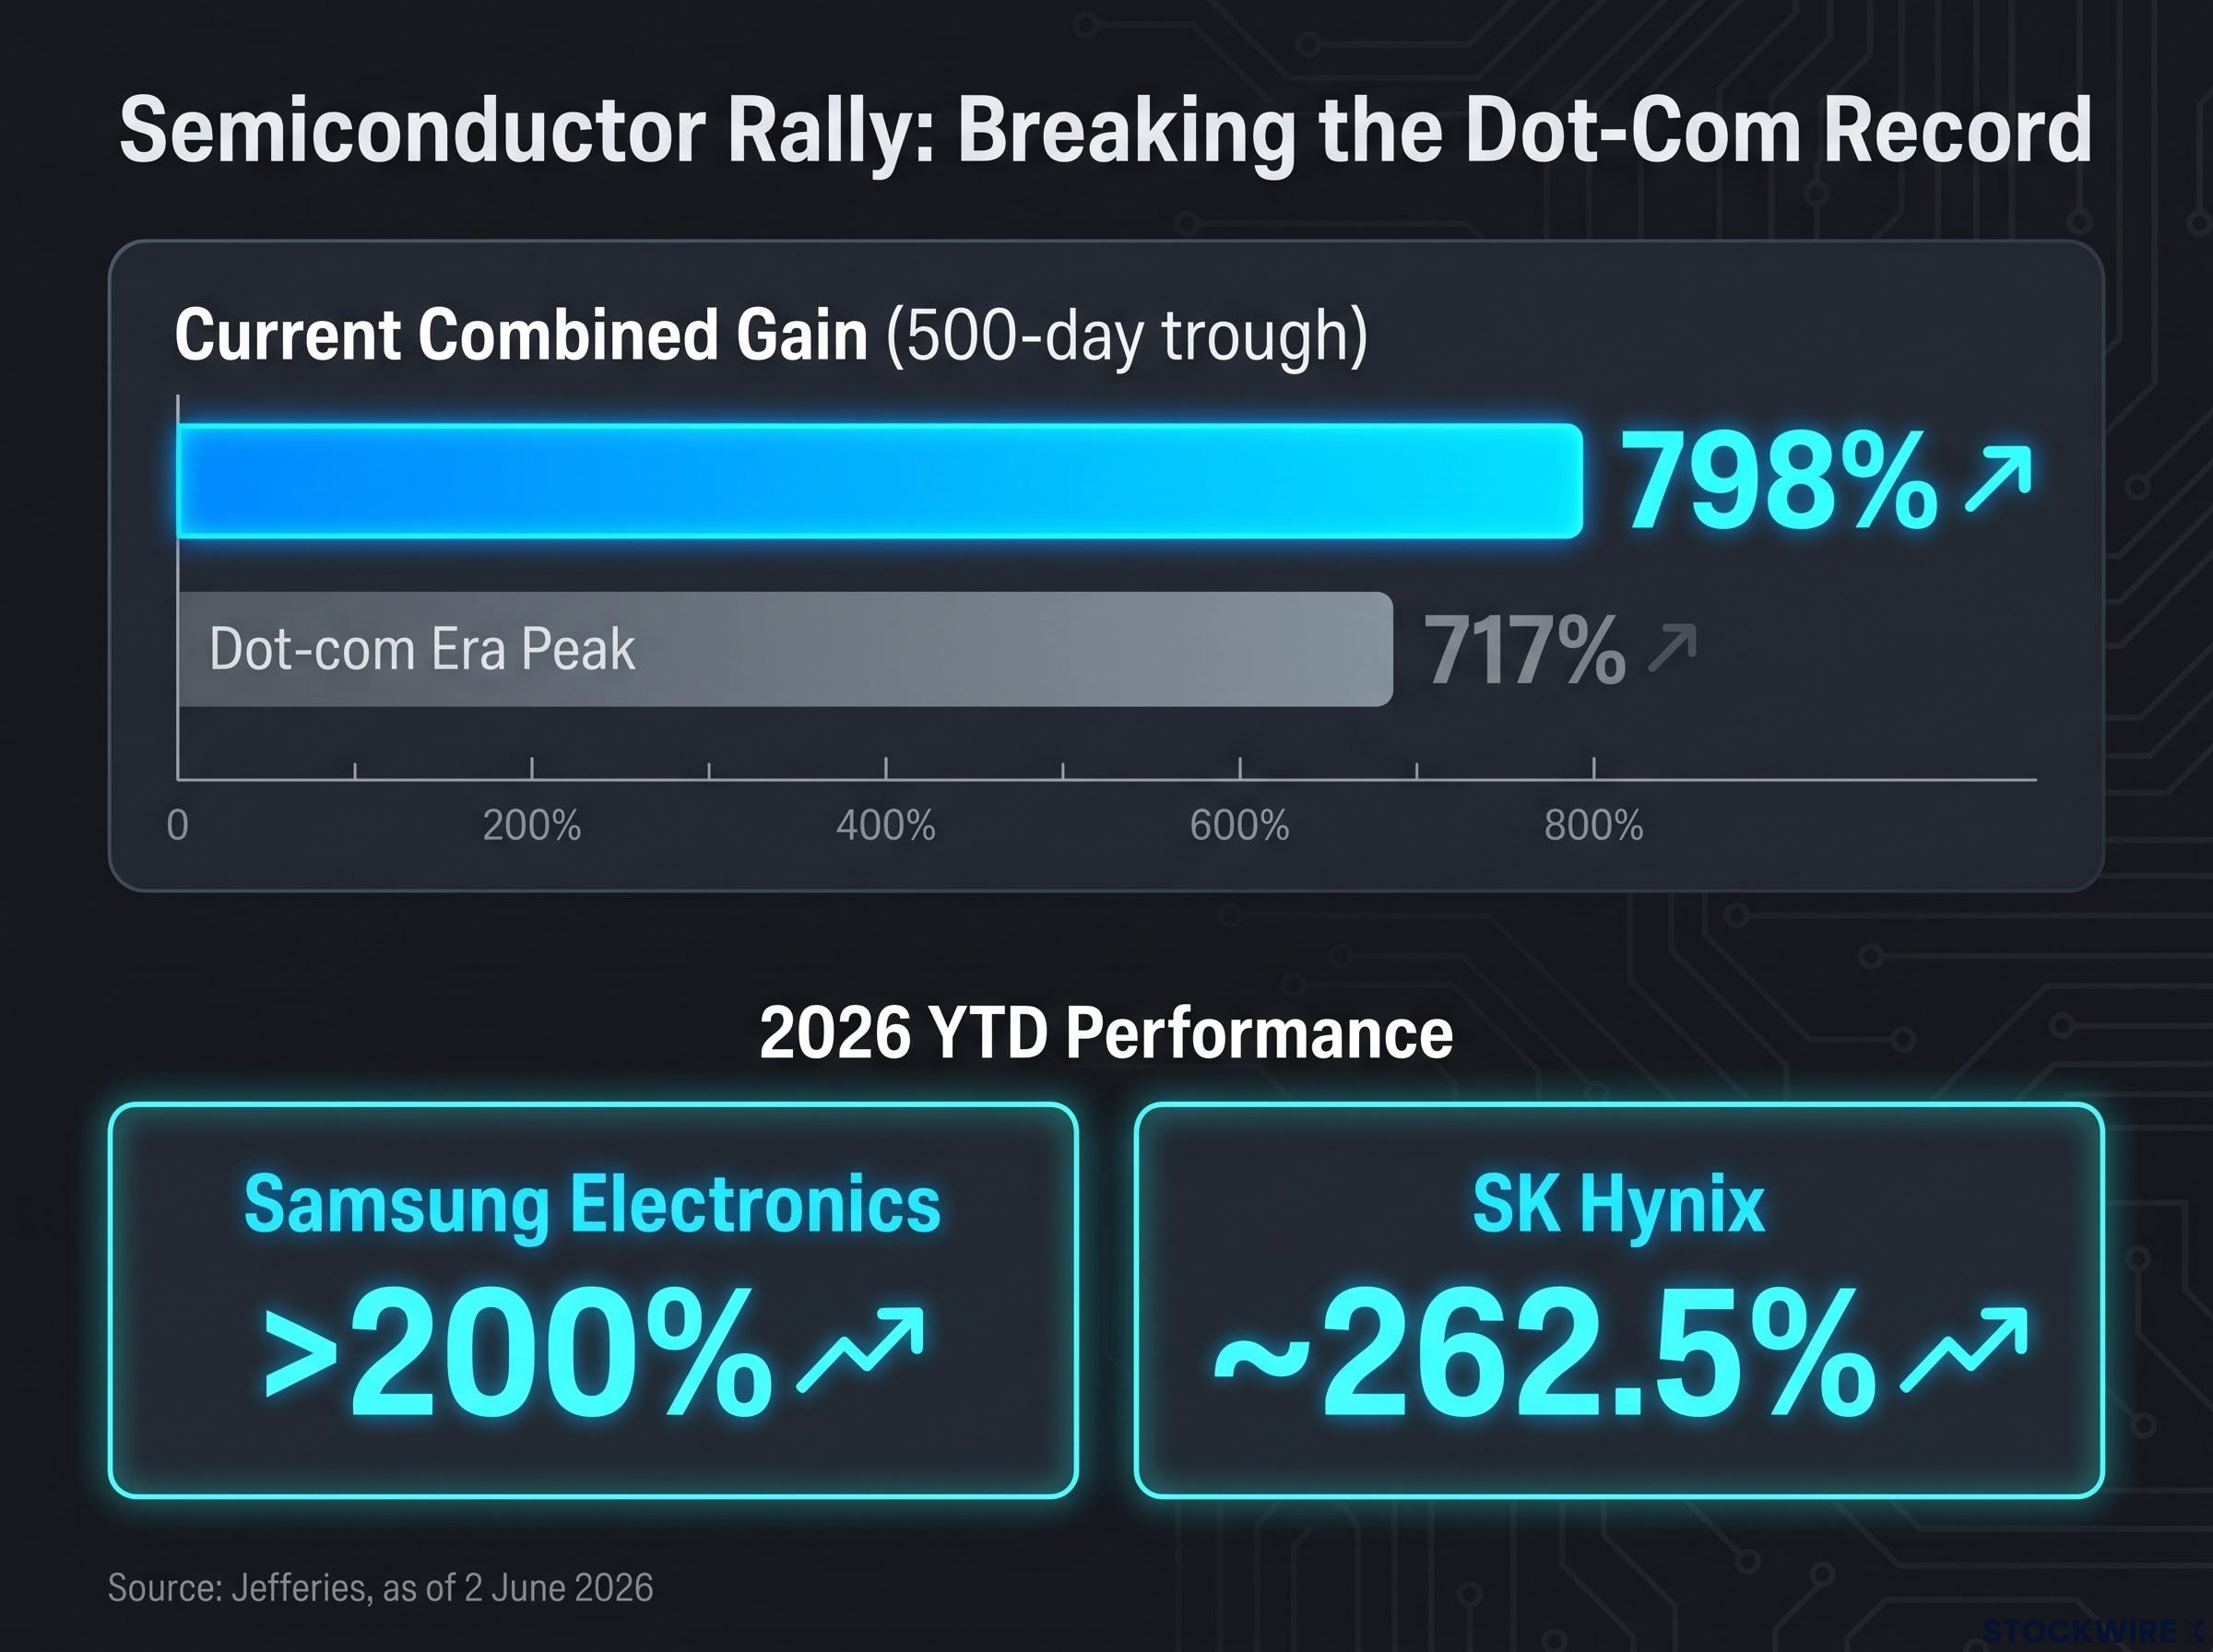
Individually, the gains are striking. Samsung Electronics has risen more than 200% year-to-date as of 2 June 2026, while SK Hynix has advanced approximately 262.5% over the same period, per Jefferies’ figures.
| Metric | Figure | Reference Period |
|---|---|---|
| Combined gain from 500-day trough | 798% | As of 2 June 2026 |
| Dot-com era comparable peak | 717% | IT bubble period |
| Samsung Electronics YTD gain | >200% | 2026 YTD |
| SK Hynix YTD gain | ~262.5% | 2026 YTD |
The scale of these numbers is the starting point, not the conclusion. Whether the 717% threshold matters as more than a historical curiosity depends on what Jefferies believes is structurally different about this rally, and what regime it thinks the market is operating in now.
The semiconductor supercycle debate has intensified across the broader sector, with the PHLX Semiconductor Index adding approximately $3.8 trillion in market value over six weeks and names like Micron posting record quarterly net income of $13.79 billion, a pattern that frames the Samsung and SK Hynix advance as part of a wider structural shift rather than an isolated Korean market story.
Jefferies’ use of the word “bubble” is deliberate but specific. The bank is not predicting an imminent collapse. It is describing a market regime, one in which the normal rules governing how far leading stocks can travel before mean-reverting cease to apply.
In a standard market cycle, a stock that has gained 200% or more would face gravitational pull: valuation compression, profit-taking, rotation into laggards. That logic assumes the cycle is operating within historical norms.
Jefferies’ framework argues that bubble-phase environments override those norms. The distinction matters:
This is the analytical lens Jefferies is applying to Samsung and SK Hynix. The 798% advance is not, in this reading, a sign that the rally has gone too far. It is evidence that the market has entered a regime where “too far” is not yet a useful concept. Whether that reading proves correct depends on the specific conditions sustaining the advance, and on what would cause them to break.
The semiconductor bubble narrative faces direct challenge from Bank of America analyst Savita Subramanian, who points to semiconductor earnings estimates revised upward by more than 20% in 2026 and active long-only positioning at roughly half the 2017 cycle peak as evidence that the current regime is grounded in fundamentals rather than speculation.
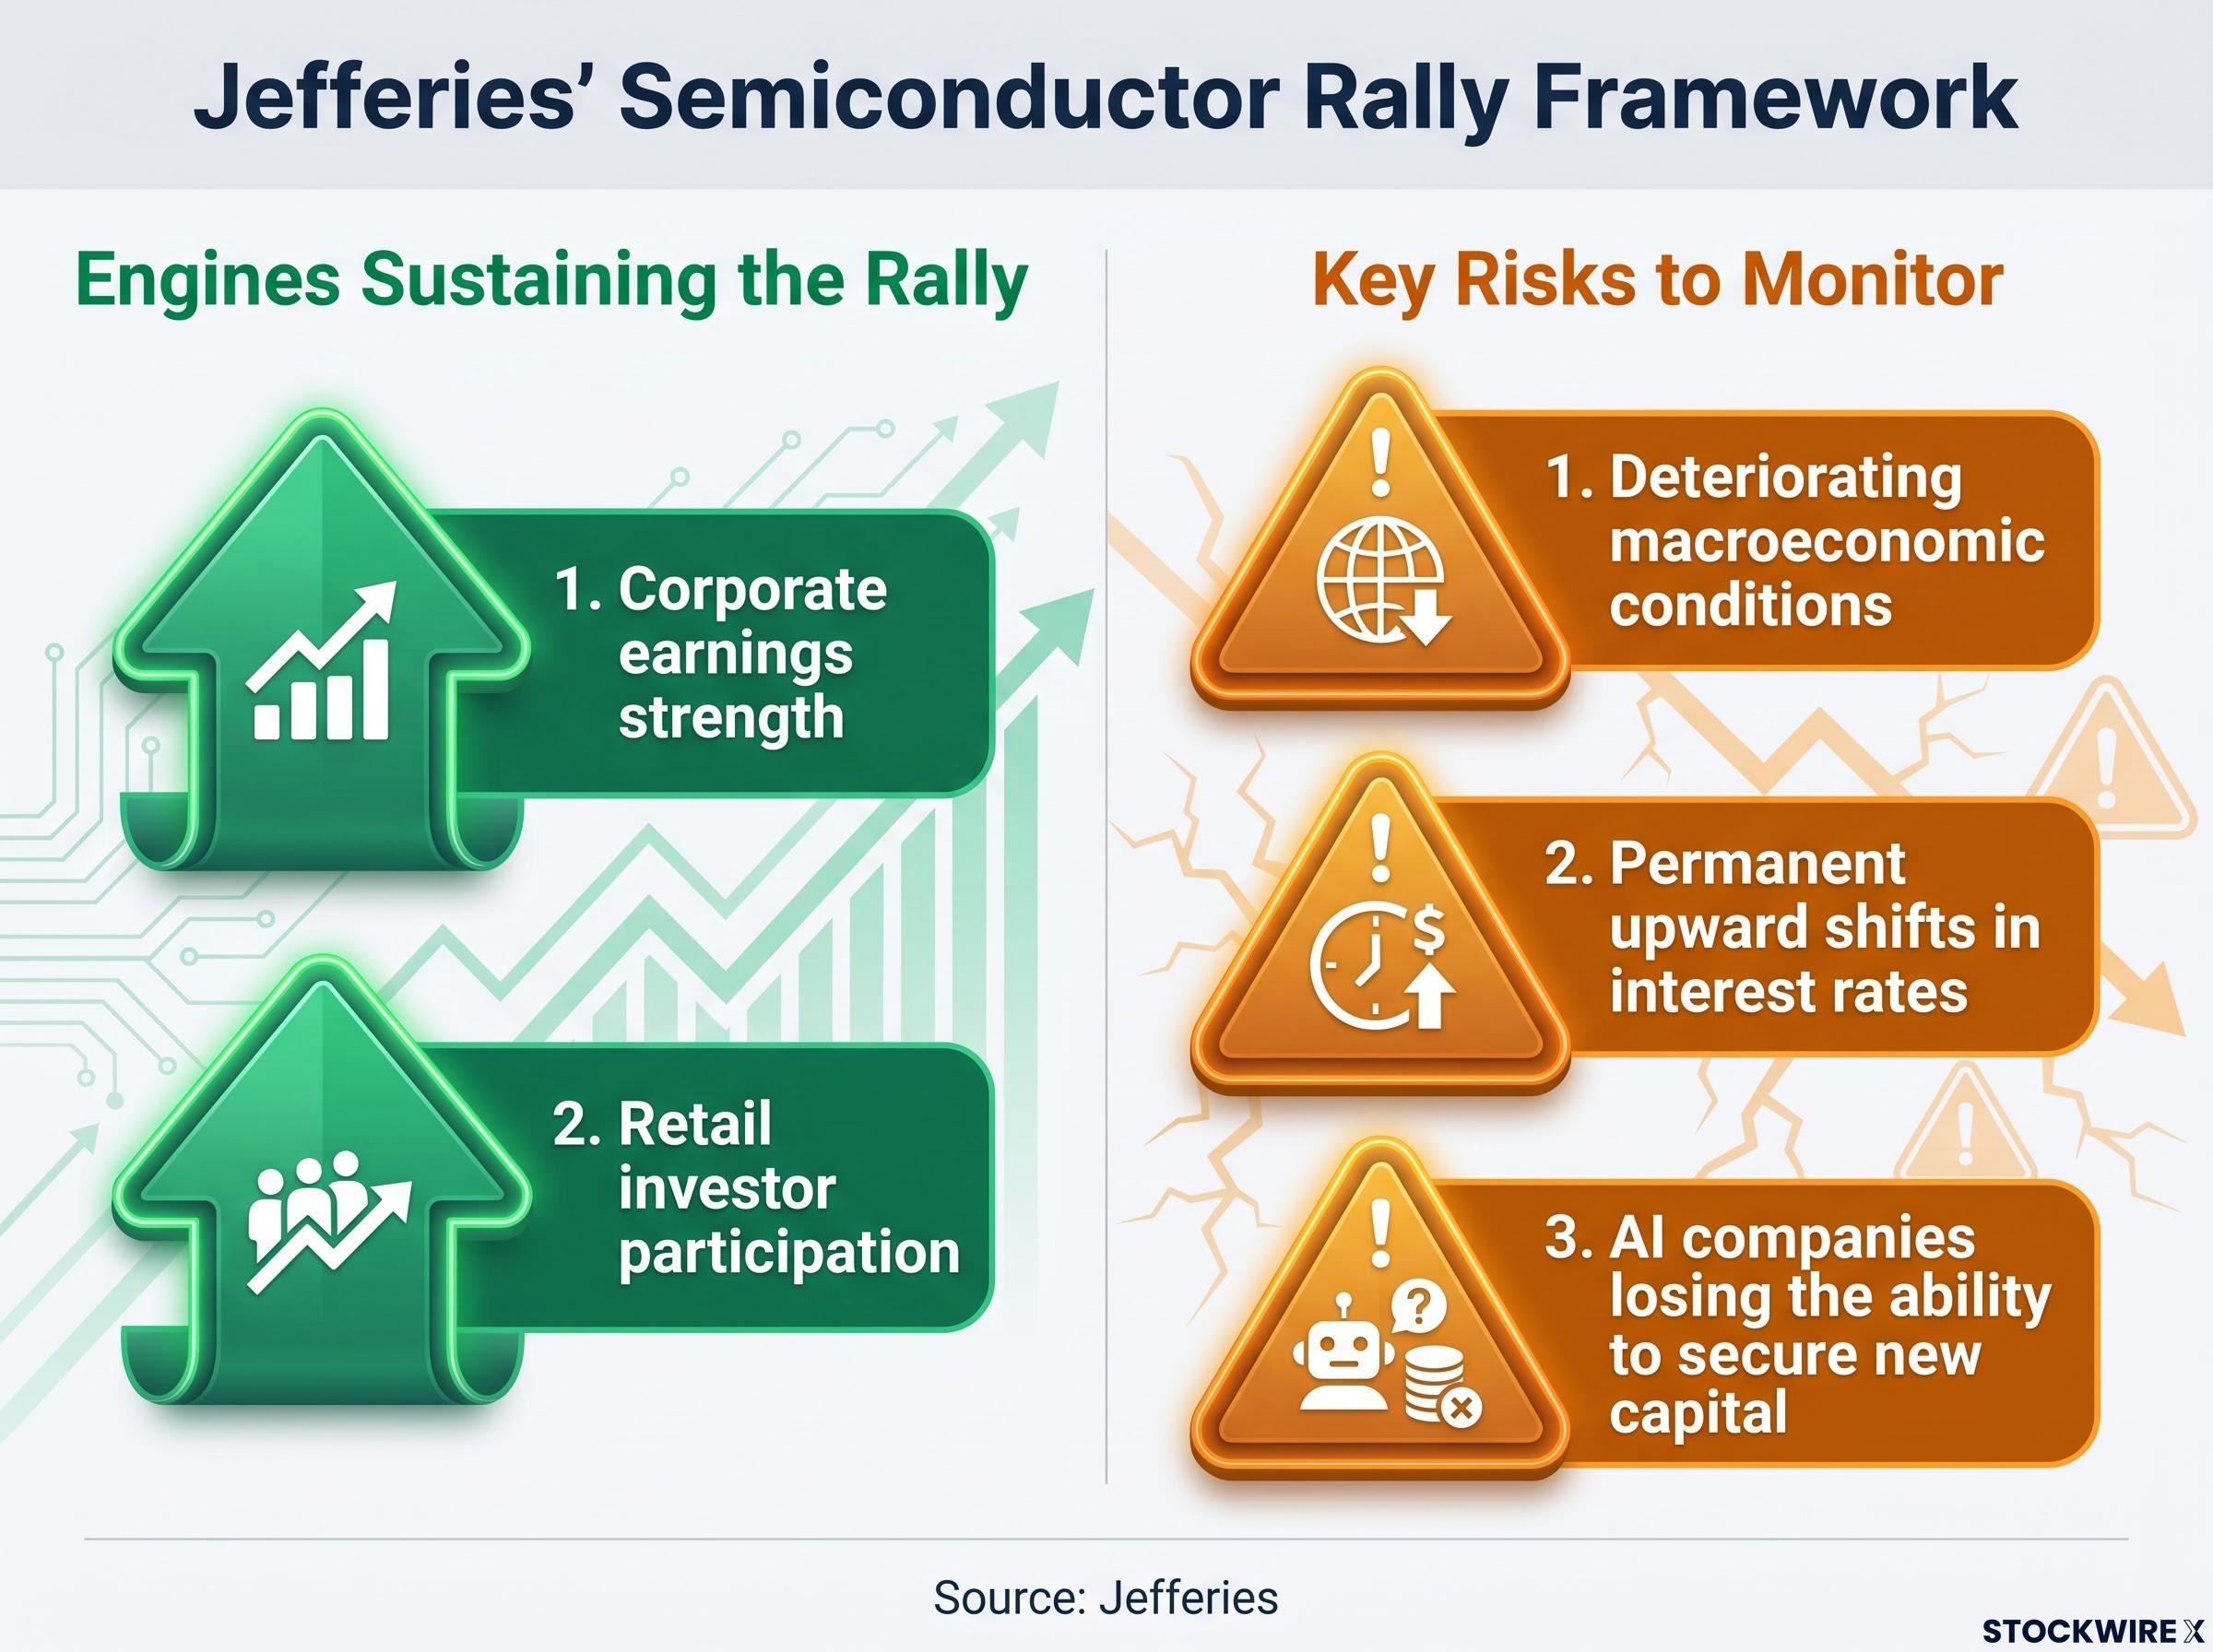
Jefferies identifies two demand-side forces feeding the current rally, both described as active as of early June 2026:
Hyperscaler capital expenditure is the upstream demand signal underpinning the earnings strength Jefferies identifies as the rally’s fundamental floor: Amazon, Microsoft, Alphabet, and Meta collectively spent $130 billion on AI infrastructure in Q1 2026 alone, with full-year 2026 combined guidance reaching approximately $725 billion and a $1 trillion annual run rate projected for 2027.
Both conditions are, per Jefferies, currently intact. The value of identifying them separately is practical: if either deteriorates visibly, the structural case for continued upside weakens, even if the other holds.
Jefferies has specified three conditions it views as the warning indicators for a potential unwinding of the rally. Each targets a different structural pillar:
According to Jefferies, as of 2 June 2026, none of these three conditions had materialised. The bank expressed the view that sufficient time likely remains before any of them become proximate risks.
That assessment is explicitly forward-looking and carries no guaranteed timeframe. The value of the framework is not as a prediction but as a monitoring tool: investors tracking these three variables have a concrete structure for evaluating when the risk environment is shifting, rather than relying on price action alone to signal a turn.
Semiconductor stocks have historically followed a pronounced boom-and-bust pattern. Periods of undersupply drive chip prices higher, which lifts company revenues, which attracts capital, which eventually funds capacity expansions that create oversupply. The correction follows: chip prices fall, revenues contract, and share prices retrace. The cycle then resets.
Prior semiconductor upswings were driven by demand from identifiable consumer product categories:
Each of these demand drivers was ultimately constrained by market saturation. Consumers buy a finite number of PCs, phones, and televisions. When penetration rates peak, semiconductor demand growth slows, and the cycle turns.
The AI investment boom driving semiconductor demand now represents 4.9% of US GDP in Q1 2026, a level that surpasses both the dot-com era peak of approximately 4.2% and the cloud buildout peak of approximately 3.8%, providing quantitative context for why the current demand cycle is structurally different from the consumer hardware saturation that ended prior semiconductor rallies.
The dot-com era 717% peak is meaningful not because the current AI-driven rally mirrors the dot-com economy, but because both represent moments when a new technology paradigm created demand that exceeded prior assumptions about sustainable growth. The dot-com cycle was the last time semiconductor stocks entered a regime where conventional valuation frameworks temporarily lost explanatory power.
TradingKey’s analysis of dot-com era stock performance shows that the 10 best-performing Nasdaq 100 stocks averaged gains of 784% in the year before the 2000 bubble peak, with individual names like Qualcomm surging 2,600% in 1999 alone, a benchmark that contextualises just how far the current Samsung and SK Hynix advance has now extended.
The difference Jefferies’ framework identifies is structural. AI infrastructure spending, the current demand driver, is not constrained by consumer device saturation in the same way. It is driven by corporate and hyperscaler capital expenditure on data centre capacity, a spending category that operates on different timelines and budget scales than consumer hardware cycles. The 798% advance, in this reading, reflects a new demand regime rather than a cyclical overshoot repeating old patterns.
A combined 798% advance that has surpassed the most extreme semiconductor rally benchmark in modern market history is, by any measure, exceptional. Jefferies’ position is that the structural conditions supporting it, earnings strength, retail demand, and AI-driven capital expenditure, remain intact as of 2 June 2026, and that the three warning signals it has identified have not yet emerged.
The story is unresolved. What distinguishes informed positioning from reactive trading is whether investors can identify the variables that will determine the outcome before the outcome arrives. Jefferies has named three. Whether they materialise in weeks, months, or not at all will shape the next chapter for Samsung Electronics and SK Hynix, and for the broader question of how far an AI-era semiconductor rally can travel.
This article is for informational purposes only and should not be considered financial advice. Investors should conduct their own research and consult with financial professionals before making investment decisions. The forward-looking assessments cited in this article originate from Jefferies and are subject to change based on market developments and macroeconomic conditions.
The 500-day trough rally measures the combined percentage gain for Samsung Electronics and SK Hynix from their lowest point over a 500-day period. As of 2 June 2026, Jefferies calculated this combined advance at 798%, surpassing the prior dot-com era record of 717%.
According to Jefferies figures published on 2 June 2026, SK Hynix had advanced approximately 262.5% year-to-date, while Samsung Electronics had risen more than 200% over the same period.
Jefferies identifies three warning signals: a deterioration in macroeconomic conditions, a permanent upward shift in interest rates, and AI companies losing access to new capital. As of 2 June 2026, the bank stated none of these conditions had materialised.
Jefferies argues that AI infrastructure spending, unlike consumer hardware demand, is not constrained by device saturation. Hyperscalers and corporations are driving capital expenditure on data centre capacity at a scale and timeline that differs fundamentally from the PC and mobile device cycles that ended prior semiconductor rallies.
Jefferies cites continued corporate earnings strength, which provides a fundamental floor beneath the price action, and ongoing retail investor participation, which adds momentum-driven buying pressure. The bank describes both forces as active and mutually reinforcing as of early June 2026.


