
Why Emerging Market Stocks Are Outpacing the S&P 500 in 2026
6 hrs ago

In the first quarter of 2026, SaaS revenue growth reached 17% year-on-year, marking the sector’s strongest quarterly reading in more than three years of consecutive data. Meanwhile, large-cap SaaS companies carry enterprise value-to-sales multiples of 9.5x, a level that places them a full standard deviation beneath their own long-run valuation averages.
That gap is not a rounding error. The AI disruption narrative, specifically the fear that agentic AI and coding agents will cannibalise seat-based software demand, has driven a sentiment-led repricing that is now measurably disconnected from what these companies are actually reporting. The market is pricing a future impairment that has not appeared in any major SaaS incumbent’s income statement.
If you are already watching this space, what follows gives you a structured way to read the dislocation rather than simply observe it: a framework for distinguishing AI fear that is justified from AI fear that has been priced in too early, and a set of company-level filters for evaluating which names within the sector are sentiment victims versus those whose discounts reflect something real.
Measured on a last-twelve-months basis, SaaS revenue growth came in at 17% year-on-year in Q1 2026. That reading is the strongest the sector has produced in over three years, arriving 4.4 percentage points above where the same measure stood twelve months earlier. This is not a plateau. It is an improvement trend, and it arrived while the market was actively selling the sector.
Revenue growth alone does not tell the full story. The quality benchmarks that have historically justified premium multiples are also being met:
Rule of 40 performance has become a more aggressively priced signal than at any prior point in the decade, with each 10-point improvement above the 40-point threshold adding 1.1x EV/Revenue multiple as of Q4 2025, up from 0.8x in early 2023.
These are not marginal readings. They are the metrics that, in any prior cycle, would have driven premium multiples higher.
The contradiction in one line: SaaS companies are posting 17% YoY revenue growth, their strongest in over three years, while trading at 9.5x EV/Sales, a level that sits at negative one standard deviation below historical norms. The financials say premium; the market says discount.
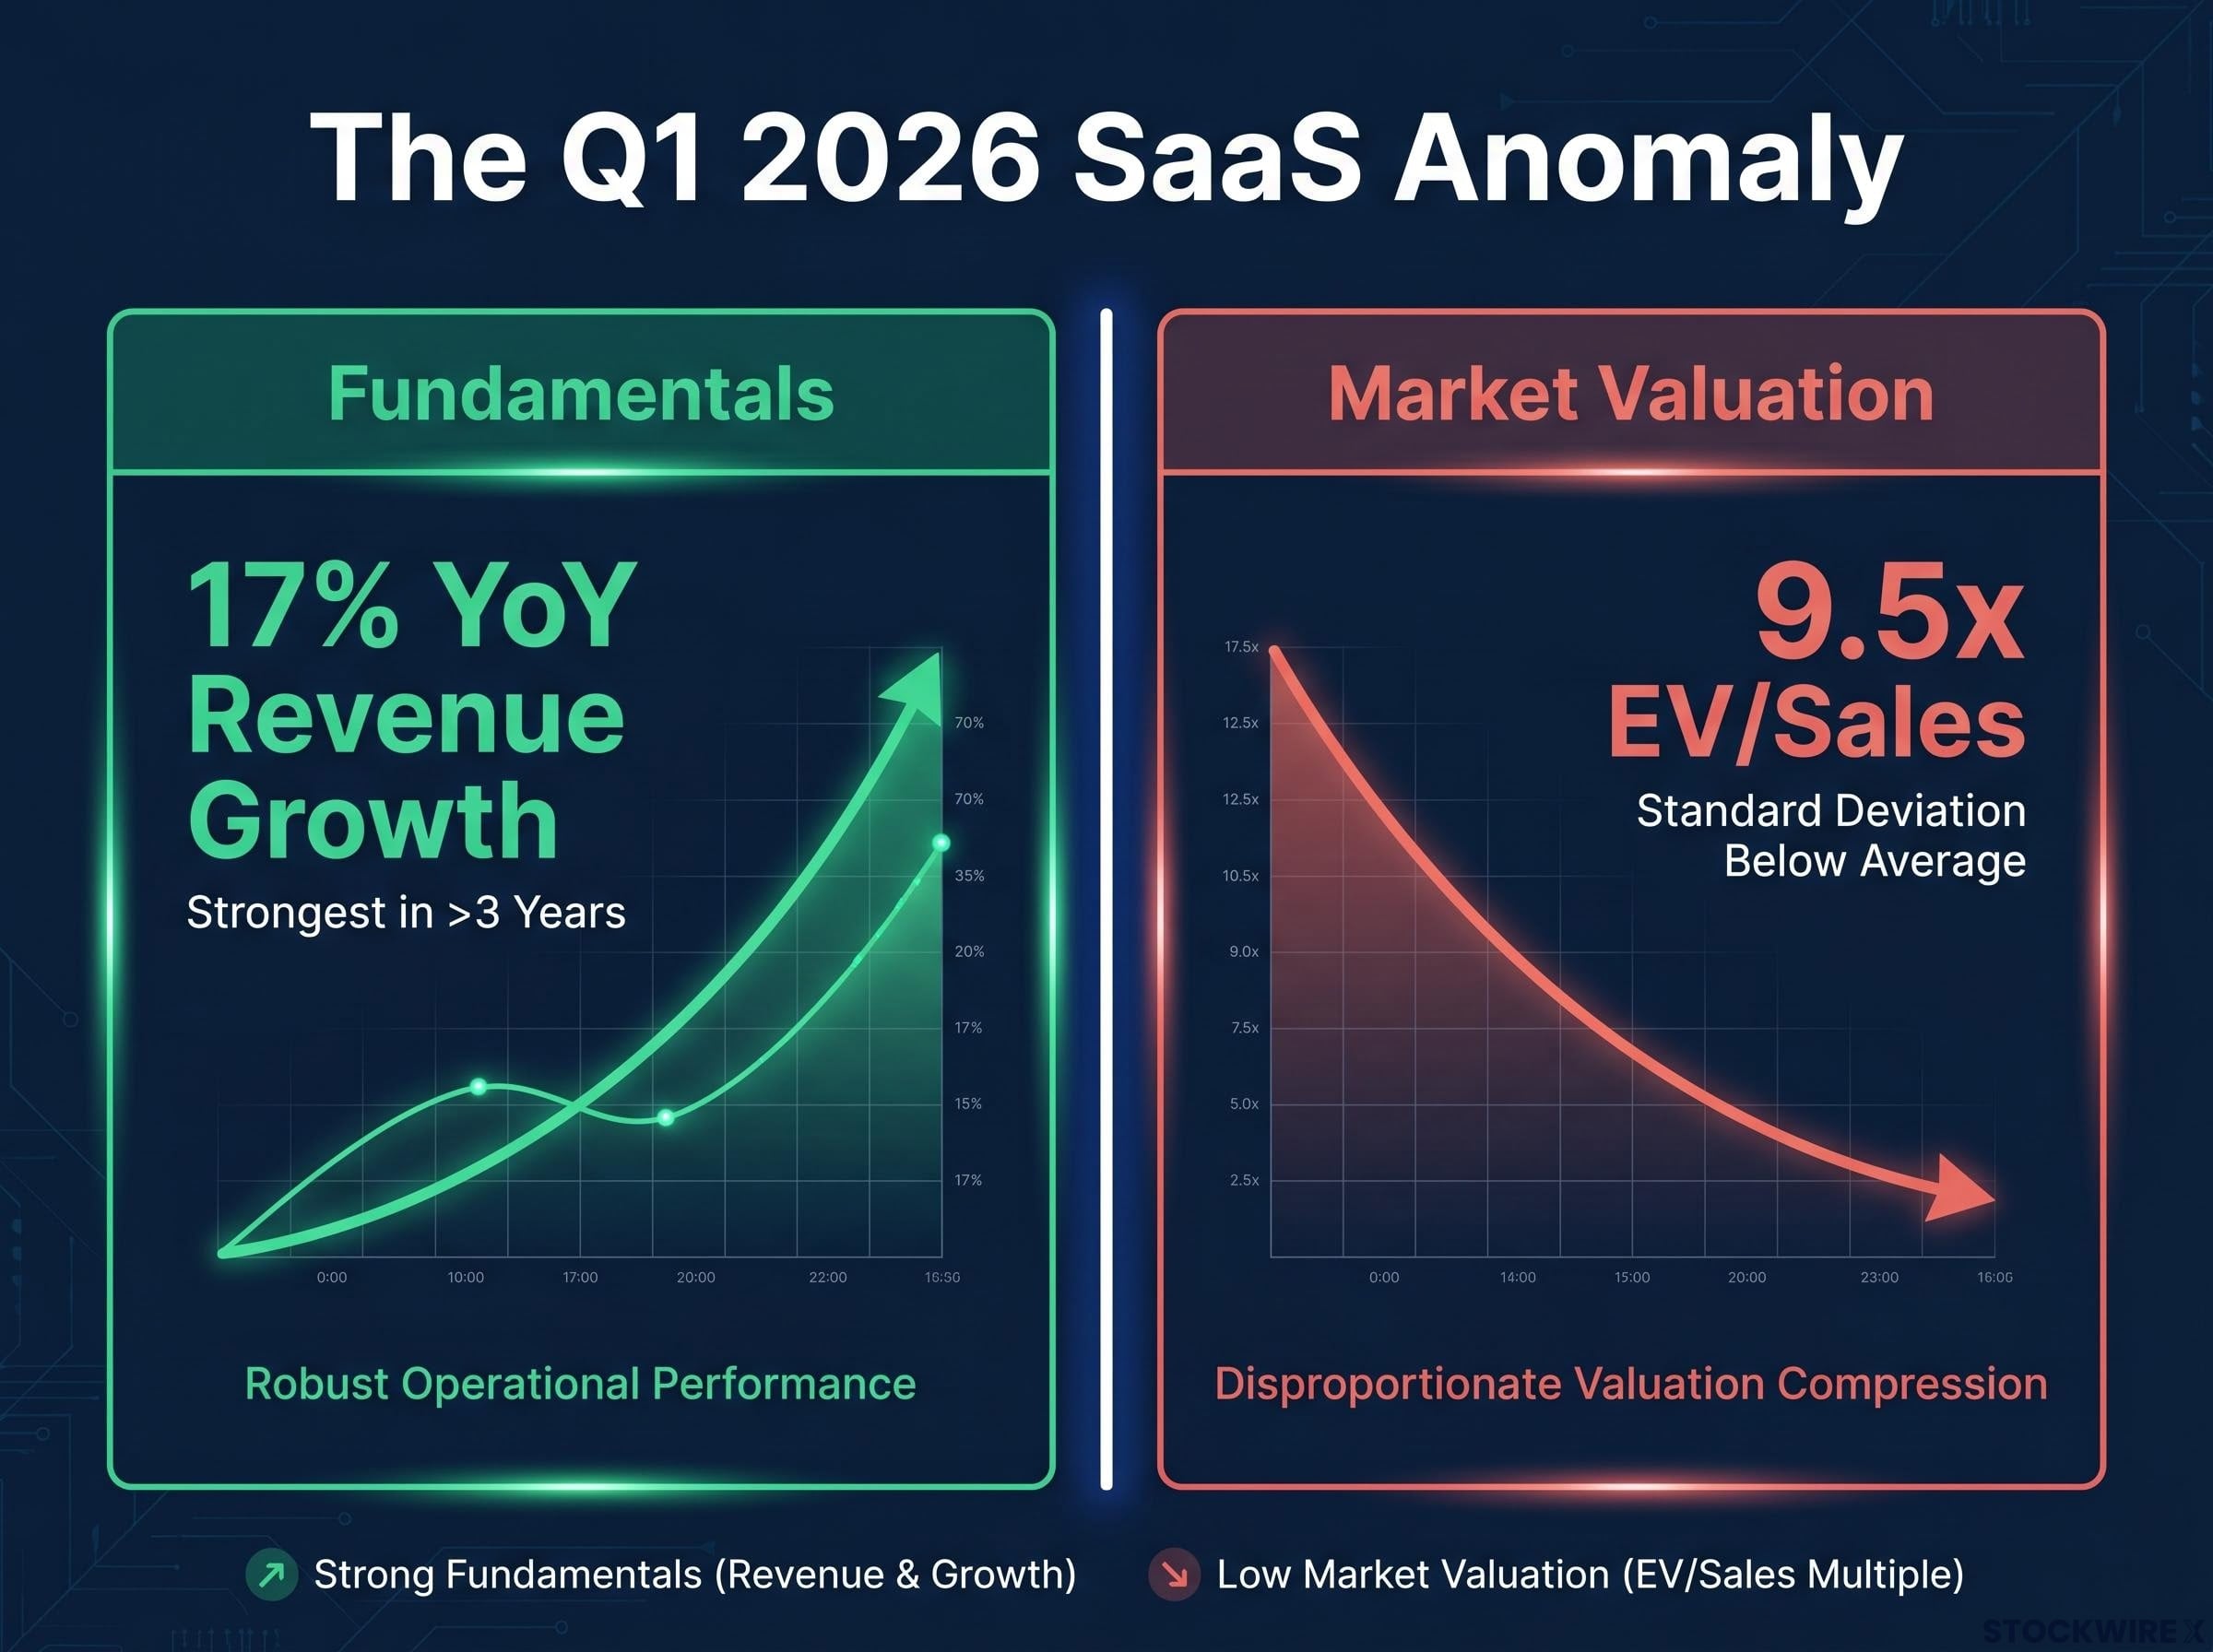
That 9.5x figure, sitting at a statistical extreme while the underlying business metrics hit multi-year highs, is the core anomaly. The market is grading these businesses on a curve that their financials do not justify, and that gap is the analytical starting point for everything that follows.
The wedge between price and performance is being driven by three forces that compound one another. Understanding the mechanism matters because it tells you the discount is not a verdict on SaaS business models; it is a pricing artefact of how capital flows in response to disruption narratives.
The AI narrative is the primary catalyst. Analysis from multiple sources links the 2025-2026 multiple troughs directly to the rollout of advanced reasoning models and coding agents from late 2025 onward. The bear thesis is specific: AI agents will perform human workflows, compressing seat-based software demand, and pricing will migrate from per-seat to usage-based or agent-based models with lower realised average revenue per user.
The regime shift runs deeper. Public-market investors are no longer paying up primarily for topline velocity paired with an AI story. They are re-anchoring valuations to growth quality, margin profile, and capital efficiency.
“Multiples are no longer granted. They are earned, through Rule of 40 performance, high net revenue retention, clear GTM repeatability, and capital efficiency.”
Even well-run SaaS businesses have seen 50%+ multiple compression simply because the cost of capital is higher and the tolerance for future uncertainty is lower. Median public SaaS EV/Revenue sat at roughly 6-7x in early 2026, down from approximately 18x at the 2021 peak.
The SaaS Capital Index historical multiples chart confirms the scale of this compression, recording a median ARR multiple peak of 16.9x in August 2021 before the sustained decline to the low single-digit range that defined the 2025-2026 environment.
The flow dynamic is the most underappreciated element. Once the narrative gains momentum, underperformance in broad SaaS indices drives risk-off flows from generalist funds. Those compressed public multiples then anchor lower private and M&A multiples (Aventis Advisors reports a 3.4x median EV/Revenue for SaaS M&A transactions as of March 2026), reinforcing the idea that 6-7x is the new normal. This pushes prices below what individual company fundamentals would justify, creating sector-wide overshoot that is structurally separate from any single company’s income statement.
The year-to-date declines tell you that scale alone is not a defence. Palantir shed close to 40% of its value, Adobe gave back roughly 44%, and Salesforce retreated around 43% by the close of Q1 2026. These are large, well-resourced companies with active AI integration programmes, and the market sold them anyway.
The question is not whether SaaS is in trouble. It is which SaaS is pricing in the right amount of AI risk, and the answer breaks along category lines.
| SaaS Category | Representative Names | Current Multiple Range | AI Risk Profile |
|---|---|---|---|
| Horizontal workflow (CRM, marketing automation, productivity) | Salesforce, HubSpot | 5-8x revenue | Highest: direct substitution risk from agentic AI |
| Cybersecurity and infrastructure | Palo Alto Networks, CrowdStrike | Relative premium | Lower: AI increases demand for security and governance |
| Data analytics and AI-native applications | Palantir, vertical AI platforms | 7-10x+ ARR (private); varies public | Mixed: beneficiaries if positioned correctly |
| Design and engineering software | Autodesk, Adobe | Premium where AI enhances core product | Moderate: AI augments rather than replaces creative workflows |
Cybersecurity and infrastructure software commands higher valuation resilience for structural reasons:
The specific declines in Adobe and Salesforce, two companies with active AI integration programmes, tell you something important: the market is not rewarding AI strategy announcements. It is waiting for AI strategy to show up in revenue durability and seat expansion metrics before paying up.
The current SaaS pricing environment maps to a recognisable five-stage pattern. This is not a prediction; it is a framework drawn from how these cycles have historically played out.
The current SaaS environment sits in stage four, or more precisely, in the transition between stages four and five. Revenue and margins have not reverted to 2015-2016 levels, but multiples have. The statistical extreme is visible in the data. What is missing is the catalyst.
Goldman’s 2026 software verdict, delivered by analyst Gabriela Borges in May, framed AI-driven outperformance as a 2027 event rather than a 2026 catalyst, placing the current sector squarely in the extended ‘wrong but stable’ condition the five-stage framework describes.
Three resolution catalysts are most likely: a clear multi-quarter pattern showing AI adoption increasing, not decreasing, revenue for SaaS incumbents; a major platform revenue miss that validates the bear case; or a macro shift that narrows the equity risk premium.
The phrase “wrong but stable” captures the current condition precisely. Multiples can remain disconnected from fundamentals for extended periods without a catalyst, which means timing this trade requires a view on when that catalyst appears, not just a view on whether the dislocation is real.
Sector-level analysis only gets you so far. The practical question is which specific companies are sentiment victims and which are trading at discounts that reflect something real. Four metrics separate the two.
| Metric | Premium Threshold | What It Signals in a Disruption Environment |
|---|---|---|
| Net revenue retention (NRR) | 110%+ | Existing customers are expanding, not contracting; AI is not eroding the installed base |
| Gross margin | 70-85% | Revenue quality remains high; the business model is not being diluted by lower-margin AI services |
| Rule of 40 | 40+ | Growth and profitability are balanced; the company is not buying revenue at the expense of economics |
| YoY revenue growth | 15%+ (mature); 25%+ (earlier-stage) | Demand trajectory has not decelerated despite AI competitive pressure |
Each metric carries more signal than headline revenue growth alone in a disruption environment. NRR in particular is the canary: if AI were genuinely cannibalising seat-based demand at scale, you would see NRR compressing first, before topline growth decelerates.
Beyond the financial metrics, you need to examine how each company is integrating AI, because two trajectories lead to opposite conclusions:
Seat-based pricing erosion is most acute in analytical SaaS, where documented enterprise cases show companies reducing software seat counts by 90% through natural language AI interfaces, a concrete illustration of the usage automation trajectory the quality benchmark framework is designed to screen for.
A SaaS company posting 17% revenue growth, 115% NRR, 78% gross margins, and a Rule of 40 score of 45 while trading at 7x revenue because the sector is under pressure is a fundamentally different situation from one posting similar topline growth with 90% NRR and a declining Rule of 40. The former is a sentiment victim. The latter is reflecting something real.
This article is for informational purposes only and should not be considered financial advice. Investors should conduct their own research and consult with financial professionals before making investment decisions.
The bull case is specific: large-cap incumbents adapt successfully, AI expands their addressable market, and current valuations represent a sentiment-driven anomaly where high-quality cash flows are available at historically discounted prices. With large-cap SaaS multiples compressed to 9.5x EV/Sales, a level one full standard deviation below historical norms, that figure serves as the valuation anchor for the bull thesis.
The bear case is equally specific: today’s multiples are not a floor but a waypoint in a longer repricing process. The structural shift from seat-based to usage-based or agent-based pricing carries real downside to average revenue per user that current multiples have not fully absorbed.
The reported data through Q1 2026 currently supports neither case conclusively, but the evidence is not evenly distributed. The impairment that the bear case depends on is not yet visible in leading SaaS fundamentals. Revenue accelerated. NRR held. Margins remained intact. That gives the bull case more near-term empirical support, while the bear case remains a forward-looking structural thesis that you should hold as a risk rather than dismiss.
The three resolution catalysts determine which scenario unfolds:
The core decision you face is not whether AI will change SaaS economics. It will. The decision is whether today’s multiples already compensate for that change or are still in the process of adjusting, and the answer is company-specific, not sector-wide.
Forward-looking statements in this section are speculative and subject to change based on market developments and company performance.
The central insight from this analysis is not confined to July 2026. When sentiment compresses an entire category in response to a plausible but unconfirmed disruption narrative, the gap between price and reported fundamentals is the signal, not the story. Monitoring that gap over successive quarters is more useful than reacting to any single data point.
Two categories of variables matter most going forward:
The Q1 2026 data represents the latest point in a live case study: 17% year-on-year growth, the strongest in over three years, sitting alongside 9.5x EV/Sales, among the most compressed multiples in recent history. Resolution depends on catalysts that have not yet materialised. The five-stage framework described earlier gives you the structural context for tracking where this dislocation sits each quarter.
The reader who tracks NRR and Rule of 40 across four consecutive quarters while watching enterprise AI adoption data has a much cleaner signal on whether this is a sentiment anomaly resolving or a structural re-rating continuing than the reader who reacts to weekly price movements in SaaS ETFs. That is the difference between positioning and noise.
—
EV/Sales (enterprise value to sales) is the ratio of a company's total enterprise value to its annual revenue, used to assess whether a SaaS stock is cheap or expensive relative to its revenue base. Large-cap SaaS companies were trading at approximately 9.5x EV/Sales in Q1 2026, well below their historical averages.
The compression is driven by three compounding forces: the AI disruption narrative (fear that agentic AI will cannibalise seat-based software demand), a regime shift requiring demonstrated capital efficiency before premium multiples are awarded, and sentiment-driven index selling that drags down entire sectors regardless of individual company performance.
Net revenue retention (NRR) measures the percentage of revenue retained from existing customers including expansions; a reading above 110% signals that the installed base is growing, not shrinking. In a disruption environment, NRR is the earliest indicator of whether AI is actually eroding seat-based demand, making it the most important single metric to track.
The Rule of 40 is a benchmark where a SaaS company's revenue growth rate plus its profit margin should sum to at least 40, indicating a healthy balance between expansion and efficiency. As of Q4 2025, each 10-point improvement above that threshold added 1.1x to EV/Revenue multiples, up from 0.8x in early 2023.
The clearest signal is the combination of NRR, gross margin, Rule of 40, and revenue growth trajectory: a company posting 17% revenue growth, 115% NRR, 78% gross margins, and a Rule of 40 score of 45 while trading at 7x revenue is a fundamentally different situation from one with similar topline growth but 90% NRR and a declining Rule of 40.


