
The Memo That Halved Meta’s AI Infrastructure Cost Estimate
5 hrs ago

Reece Limited’s trailing dividend yield of approximately 1.4% sits nearly 30% above its five-year historical average of 1.1%. Its forward yield of 1.9%, based on analyst estimates, is approaching double that long-run baseline. For a stock rarely flagged as cheap, that divergence warrants closer examination.
Reece is not the kind of business that typically flashes as a deep-value opportunity. More than a century old, ASX-listed, with a conservative balance sheet and a dividend covered more than four times by earnings, it trades at a premium that reflects its quality. Yet dividend yield, when compared against a company’s own history, can surface valuation signals that conventional price movements sometimes obscure. This analysis walks through how to read dividend yield expansion as a relative valuation tool, uses REH’s current position as a live case study, profiles the business behind the numbers, and examines what the signal does and does not tell investors.
A share price on its own carries no inherent reference point. It tells investors where the market values a company today, but not whether that valuation is generous, stingy, or somewhere in between relative to the company’s own track record. Dividend yield, expressed as a percentage of the share price, provides that missing context when measured against a company’s historical average.
When yield rises because the share price has fallen relative to dividends, the market is applying less optimism to the stock than it previously did. This is yield expansion. The inverse, yield compression, occurs when the price climbs faster than dividends grow, pushing the yield below its historical average.
Dividend mechanics, particularly the share price adjustment that occurs on the ex-dividend date, mean that yield expansion driven by price declines represents a real shift in market sentiment rather than an automatic wealth transfer to shareholders.
A yield above a company’s own historical average signals the market is pricing the stock with less enthusiasm than it has historically, all else being equal.
Reece’s trailing yield of approximately 1.36-1.4% versus its five-year average of approximately 1.1% is a concrete example. The forward analyst yield forecast of approximately 1.9% extends the signal further. With a dividend cover ratio of approximately 4.60x and a payout ratio of approximately 39%, the dividend is structurally stable, meaning the yield movement is driven by price, not by dividend instability.
The method loses analytical value under specific conditions: when dividends are being cut, when payout ratios are extreme (either too high to sustain or so low the dividend is immaterial), or when a company’s earnings trajectory has shifted materially downward.
REH satisfies the reliability conditions. Its payout ratio is moderate, its cover ratio is high, and its dividend history is long enough to make the five-year comparison meaningful rather than distorted by a single anomalous year.
Reece Limited is Australia’s largest plumbing and bathroom products supplier, with more than 100 years of operating history. That duration alone places it among the ASX’s most established industrial distributors. What may be less well understood is the breadth of what it actually distributes.
The company’s product and service verticals include:
The distribution network spans Australia, New Zealand, and the United States. The US expansion, in particular, has been identified by analysts as a strategic growth vector, and it is relevant to understanding both the earnings trajectory and why forward estimates project EPS growth of approximately 9.3%.
Reece carries a market capitalisation of approximately A$8.30 billion and a debt-to-equity ratio of approximately 47.2%, a conservative balance sheet by industrial standards. Forward net profit after tax (NPAT) is estimated at approximately A$483.51 million, according to Intelligent Investor projections (noting partial data from search snippets due to access restrictions).
The trailing annual dividend stands at approximately 0.18 AUD per share. The most recent interim dividend was 5.4 cents, 100% franked, with an ex-dividend date of 17 March 2026. The prior final dividend was 12 cents, also 100% franked, with an ex-dividend date of 7 October 2025. That pattern of fully franked semi-annual payments is consistent with what investors have received across recent years.
The distinction between a cash dividend and its grossed-up equivalent matters considerably for Australian investors: the fully franked dividend value that an SMSF in pension phase receives is $1,428.57 for every $1,000 in cash paid, once the ATO refunds the attached franking credit in full.
At share prices in the $13.43-$13.99 range through May 2026, the trailing yield sits at approximately 1.36-1.4%. That is modestly but meaningfully above the five-year historical average of approximately 1.1%, a gap of roughly 30%.
The forward yield forecast of approximately 1.9% extends the expansion further. If realised, that forward figure would approach nearly double the long-run baseline, the widest divergence in REH’s recent yield history.
| Metric | Current Trailing | Five-Year Average | Forward Estimate |
|---|---|---|---|
| Dividend Yield | ~1.4% | ~1.1% | ~1.9% |
| Total Shareholder Yield | N/A | N/A | ~6.5% |
The forward total shareholder yield of approximately 6.5%, comprising a 1.9% dividend yield and a 5.1% buyback yield, reframes the return profile for a stock whose headline dividend alone appears modest.
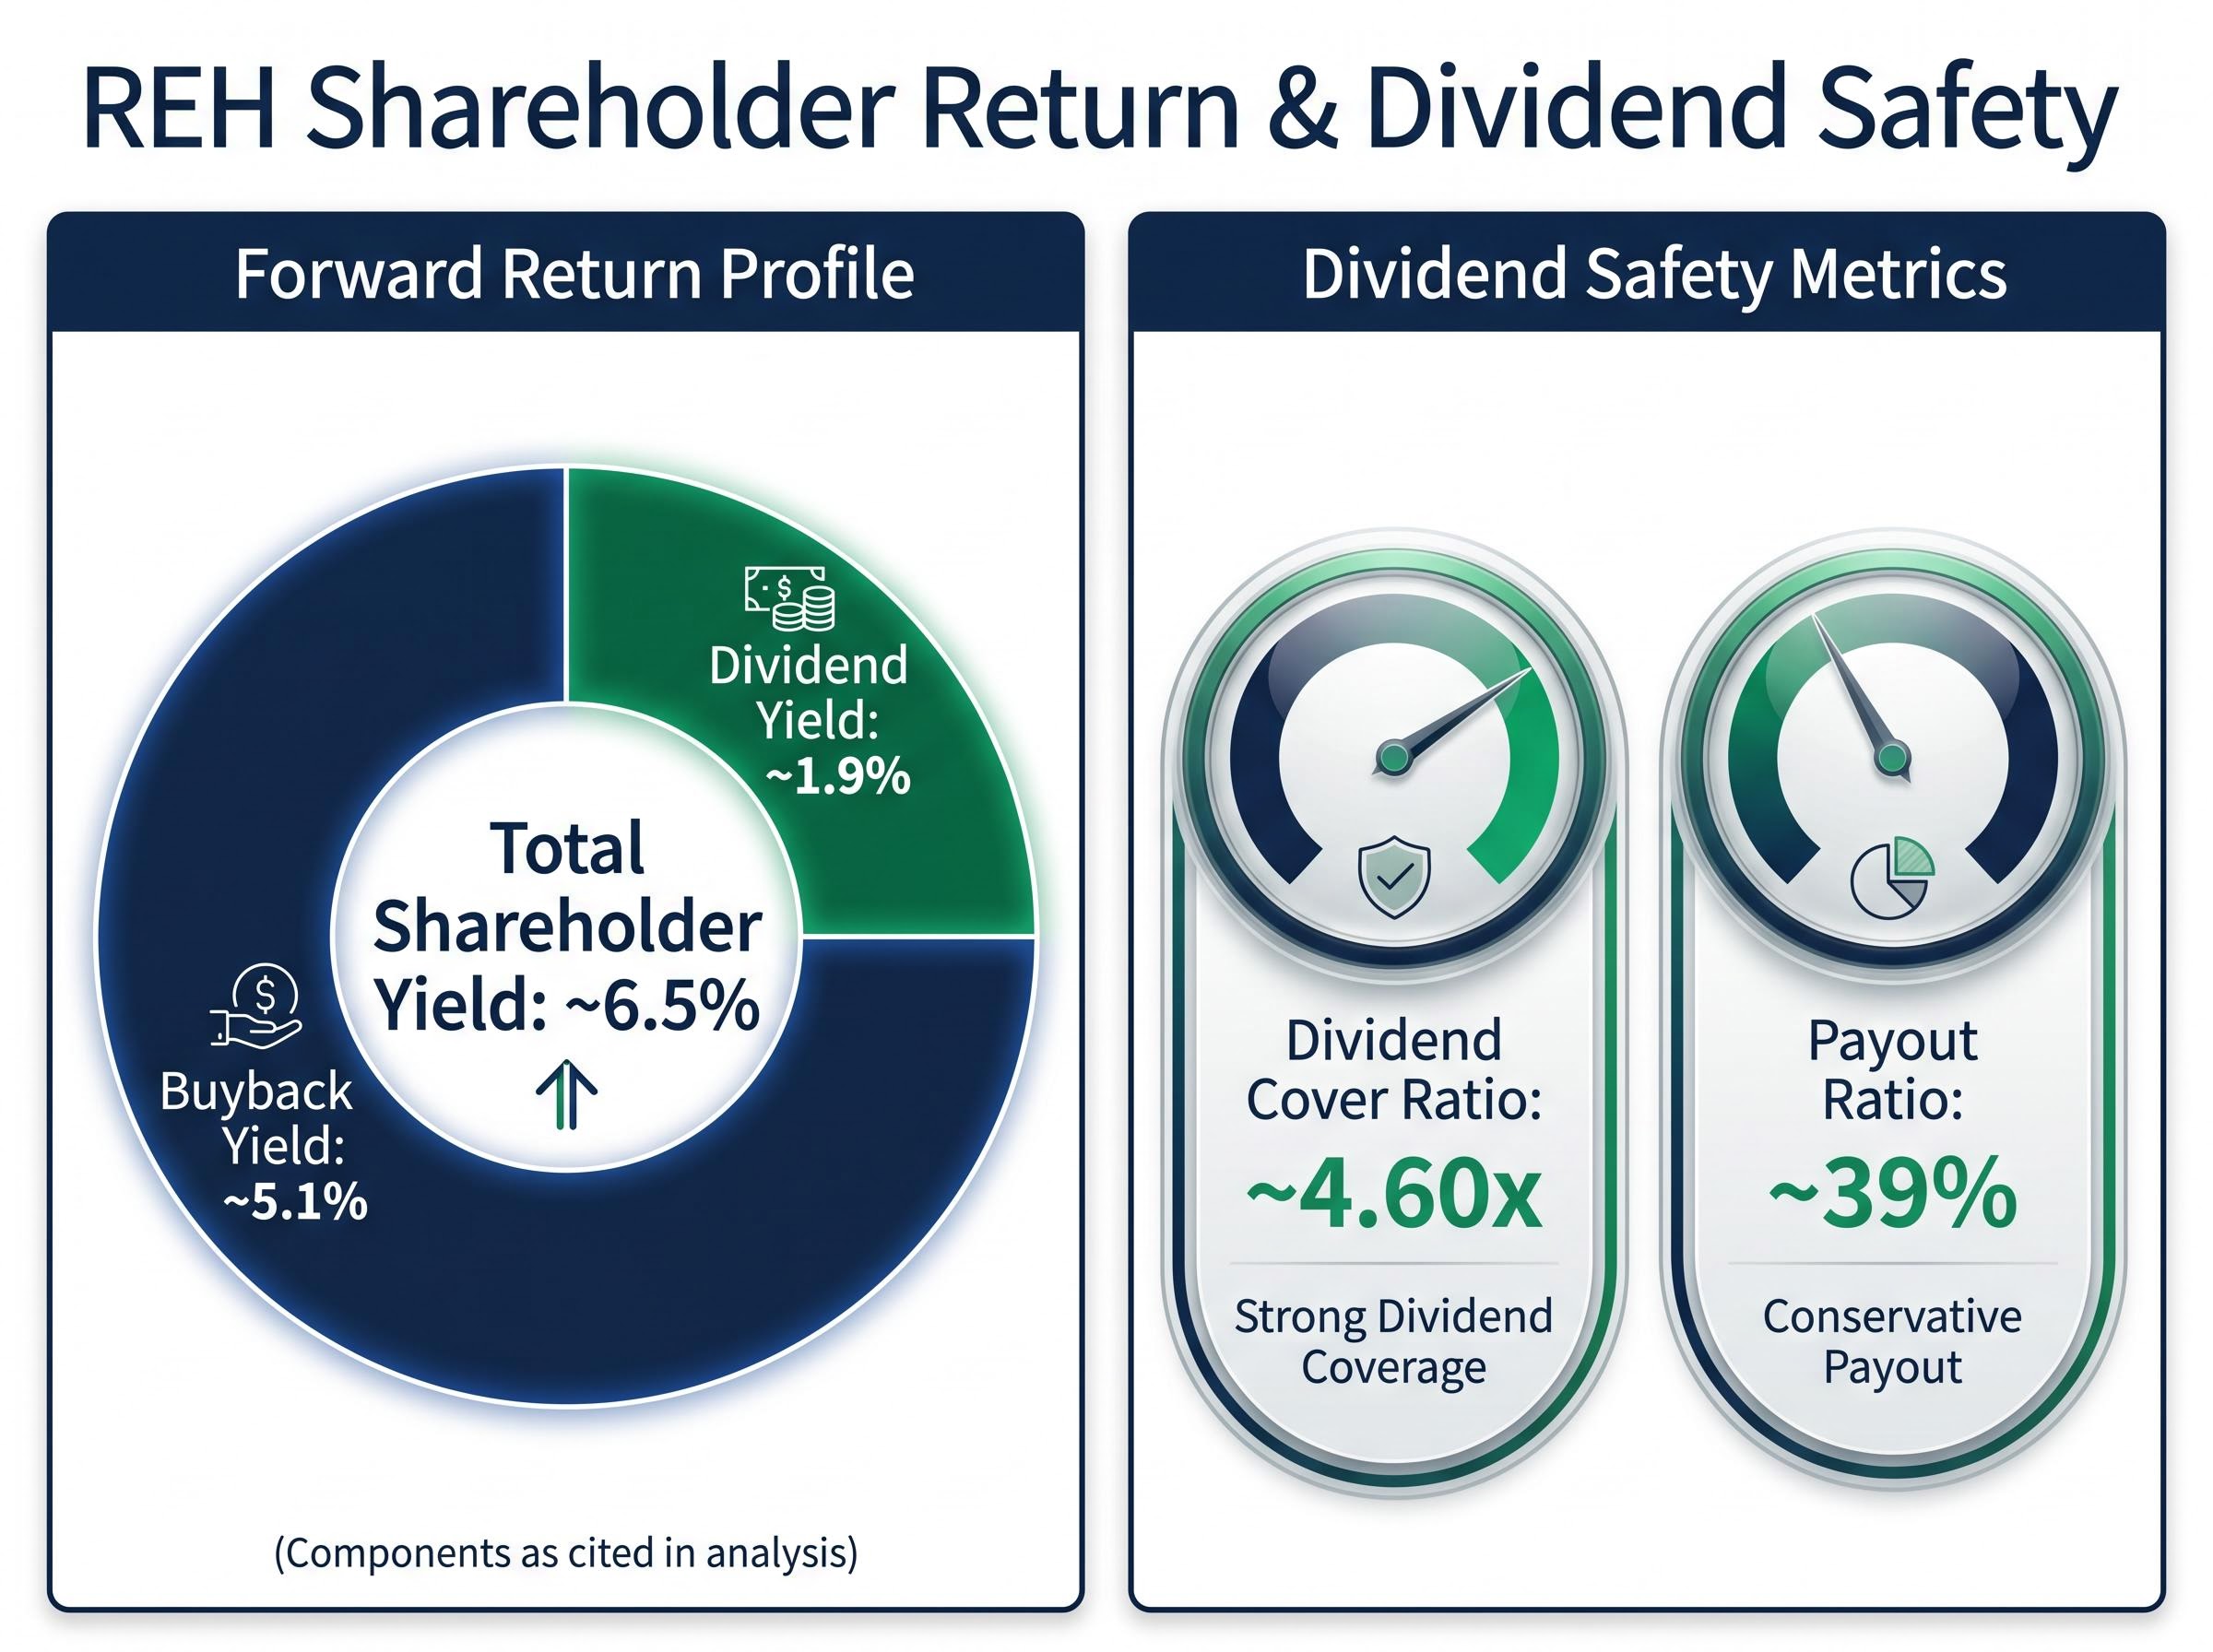
The total shareholder yield figure is worth holding in mind. For investors evaluating REH purely on dividend yield, the buyback component materially changes the picture of what the company is returning to shareholders.
The yield expansion is real when measured against REH’s own history. Measured against the broader ASX, the picture is different.
| Benchmark | Yield | Notes |
|---|---|---|
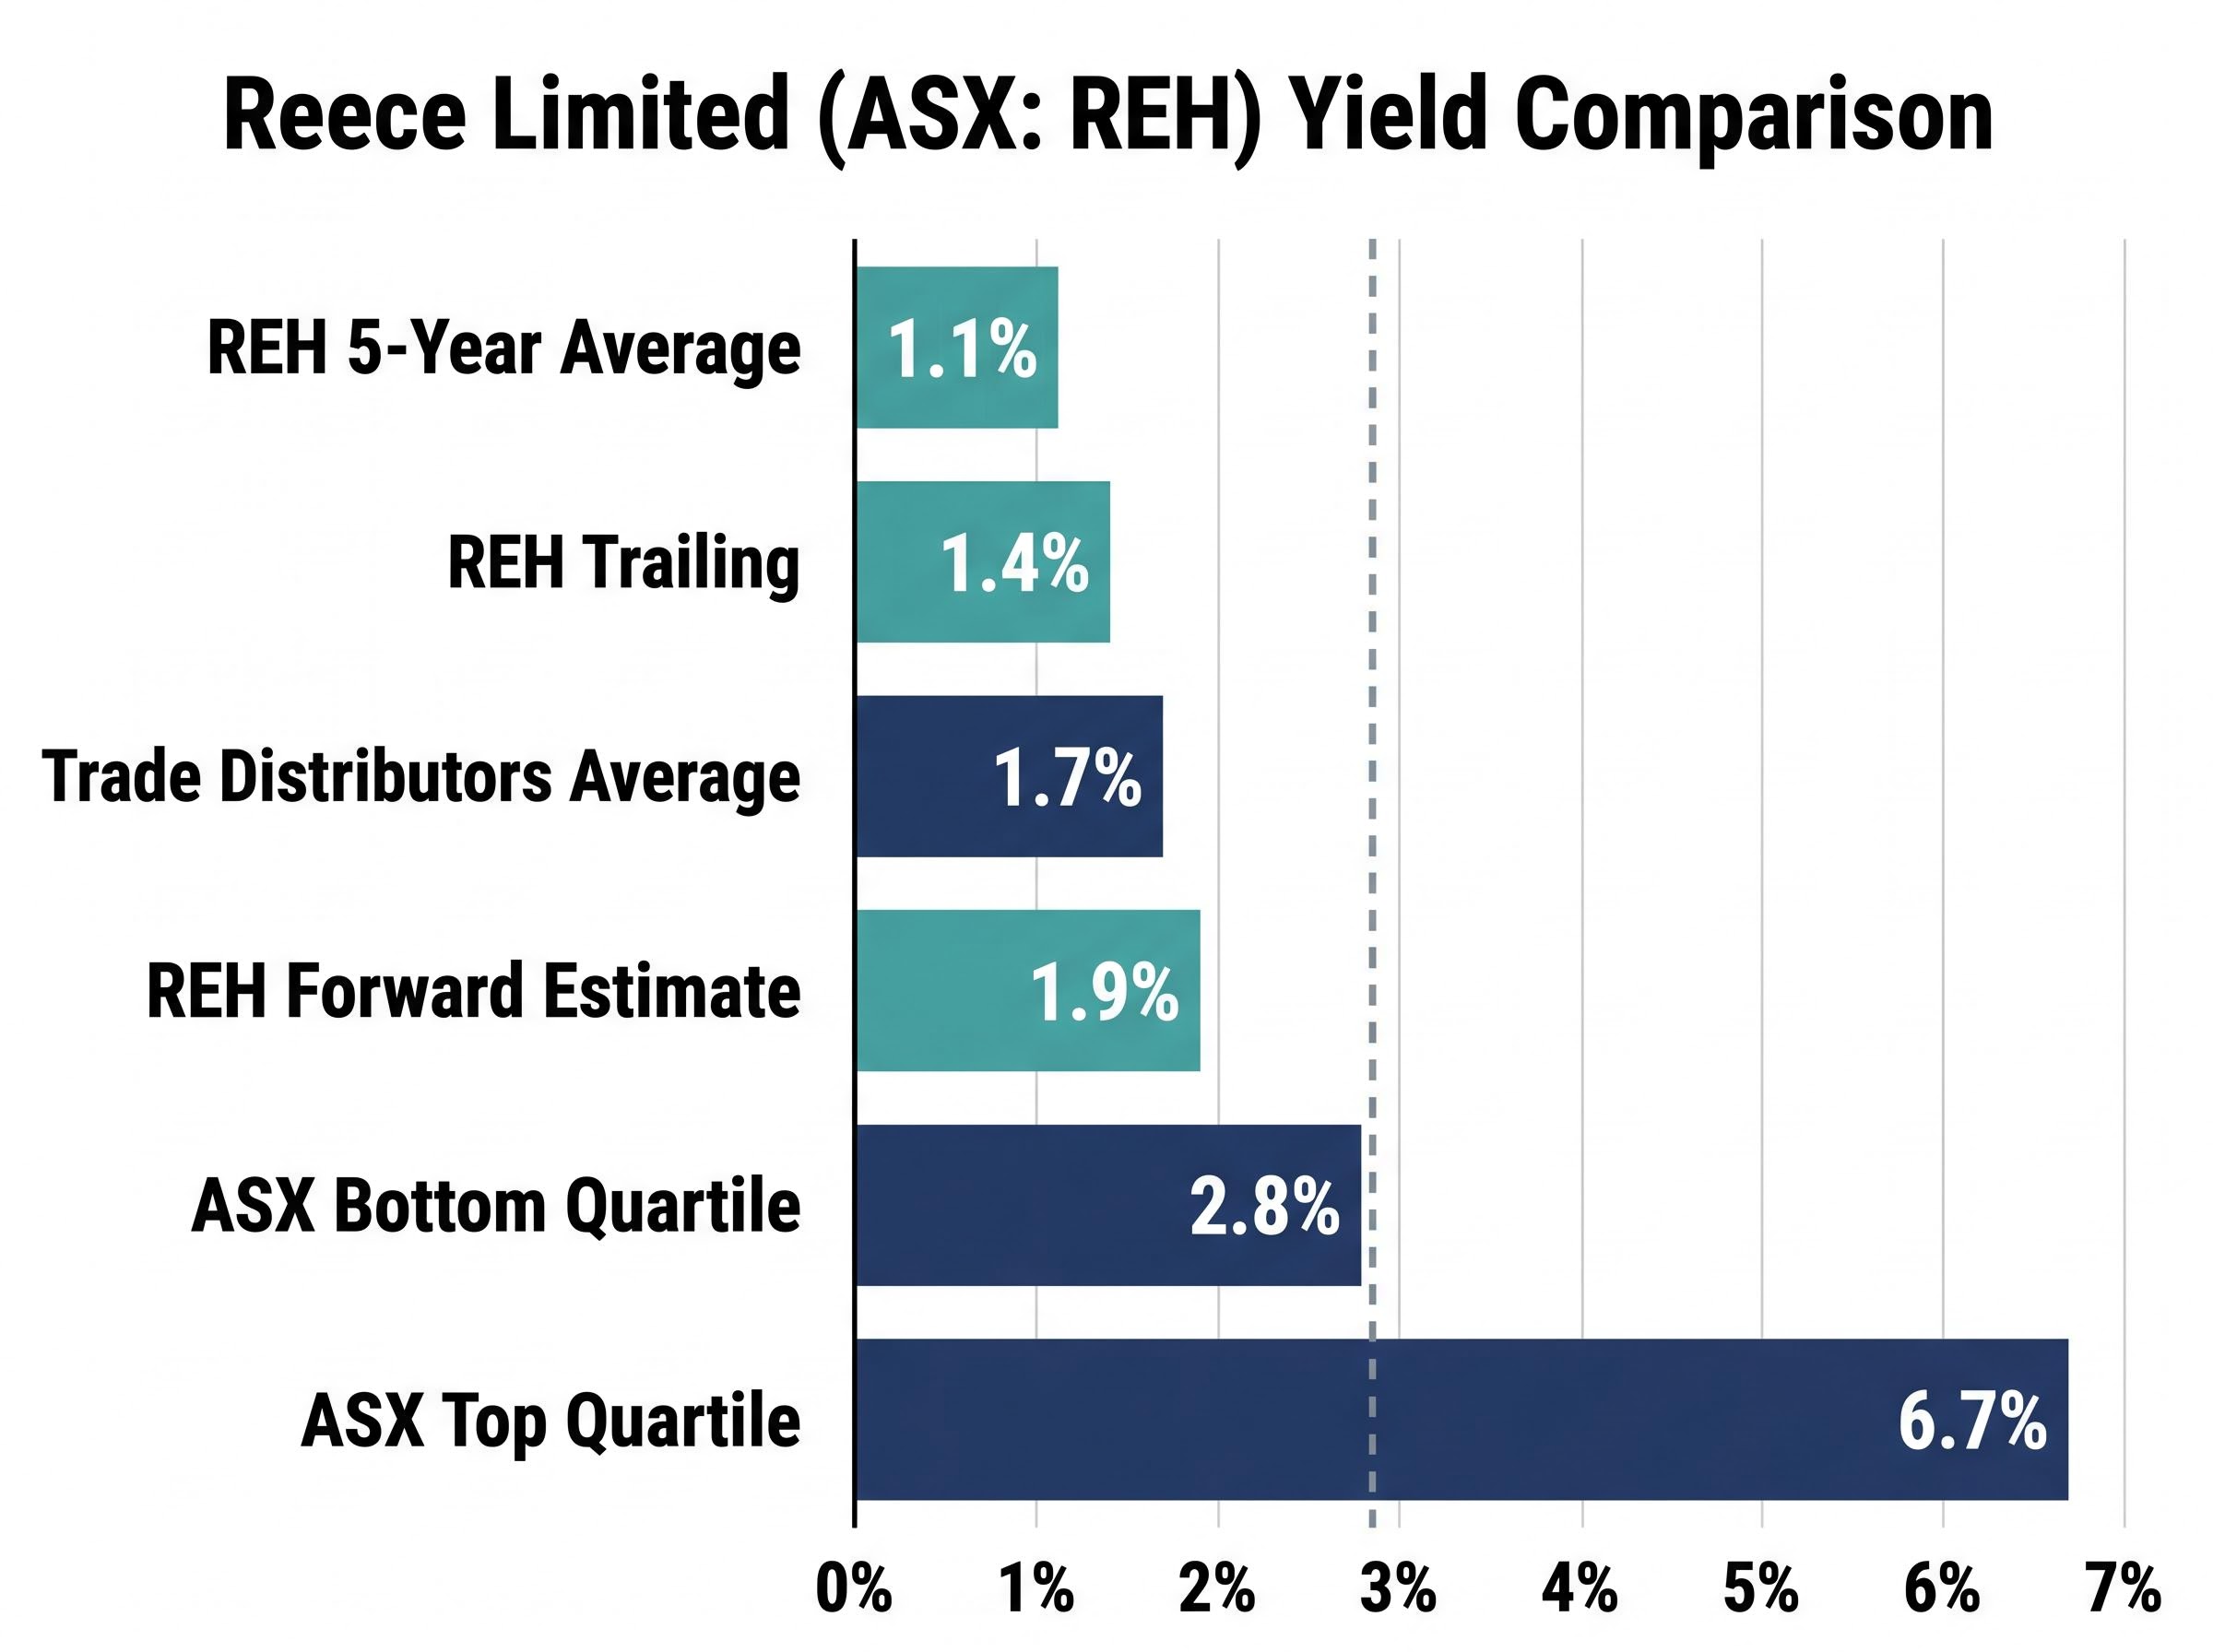
| REH trailing | ~1.4% | Below industry average and ASX bottom quartile |
| REH forward | ~1.9% | Marginally above industry average |
| Trade distributors industry average | ~1.7% | Sector benchmark |
| ASX bottom quartile | ~2.8% | Lowest 25% of ASX-listed yields |
| ASX top quartile | ~6.7% | Highest 25% of ASX-listed yields |
REH’s trailing yield of ~1.4% falls below the ASX bottom quartile threshold of ~2.8%, placing it in the lowest tier for income among ASX-listed companies. Even the forward yield of ~1.9% only marginally exceeds the trade distributors industry average of ~1.7% and remains well below the bottom quartile.
The distinction matters. Yield expansion relative to REH’s own history is a signal about how the market is currently pricing this stock versus its own past. It is not a signal that REH is a high-income investment in absolute terms. Investors seeking yield for income purposes and investors using yield as a valuation screen are asking different questions, and this benchmarking separates the two.
Yield relative to history is a screening signal, not a valuation verdict. It raises the question of whether REH sits at a relative discount to its own track record, but it cannot answer that question alone. Price-to-earnings ratios, discounted cash flow analysis, and the trajectory of future earnings all need to be assessed alongside it.
That tension is already visible in the data. According to Motley Fool analysis published in April 2026, REH was characterised as trading on a lofty price-to-earnings ratio relative to peers. A stock can simultaneously show yield expansion (suggesting less market optimism than usual) and trade at a PE premium (suggesting the market still prices it above sector norms). The two observations are not contradictory; they reflect different facets of valuation.
The forward dividend growth rate is estimated at approximately 2.7% per annum, and as of mid-May 2026, REH shares traded approximately 32.4% above their 52-week low. Neither figure confirms direction. Both provide context.
For investors wanting to apply a structured multi-method framework to REH’s current pricing, our dedicated guide to ASX share valuation methods walks through P/S, EV/EBITDA, DCF, and the Dividend Discount Model with specific guidance on how to gross up fully franked dividends to avoid systematically undervaluing Australian income stocks.
The ABS building approvals data, covering total dwellings approved and the value of residential construction each month, provides the most direct leading indicator for demand across REH’s core plumbing, waterworks, and civil construction product lines.
The RBA historical capital market yields series, specifically the F2 and F2.1 government bond tables, provides the 10-year Commonwealth Government Securities benchmark that investors use to calibrate the relative attractiveness of equity dividend yields when the risk-free rate is rising or falling.
REH’s yield expansion from its five-year average of approximately 1.1% toward a trailing figure of approximately 1.4% and a forward estimate of approximately 1.9% is a meaningful shift for a stock with this level of dividend stability. A cover ratio of 4.60x and a payout ratio of 39% give the dividend structural credibility; this is not a yield inflated by earnings decline or payout unsustainability.
The business behind the yield is a diversified, century-old distributor with US growth exposure, a conservative balance sheet, and an earnings base broad enough to span plumbing, HVAC, civil construction, and irrigation. When buybacks are included, the forward total shareholder yield of approximately 6.5% presents a materially different return profile than the headline dividend alone.
For established ASX businesses with stable dividends, yield relative to their own history is a first-pass valuation screen, not a final verdict.
Dividend yield valuation works best as a starting point: a method for identifying when the market’s pricing of a stock has shifted relative to its own norms. For REH, the shift is visible. What it means requires the follow-on work.
Investors ready to act on yield signals across multiple ASX holdings, rather than a single stock, will find our comprehensive walkthrough of ASX dividend portfolio construction covers payout ratio thresholds, cover ratio filters, ex-dividend date mechanics, and how to build sector diversification that holds up across economic cycles.
This article is for informational purposes only and should not be considered financial advice. Investors should conduct their own research and consult with financial professionals before making investment decisions. Past performance does not guarantee future results. Financial projections are subject to market conditions and various risk factors.
Dividend yield valuation compares a stock's current yield against its own historical average to identify whether the market is pricing the stock with more or less optimism than usual. When yield rises above its historical norm due to a falling share price, it can signal that the stock is relatively cheaper than it has historically been.
By comparing the current dividend yield to a multi-year average, investors can identify meaningful divergences that suggest the market has shifted its pricing of a stock relative to its own norms. A yield materially above the historical average, where the dividend itself is stable, indicates the share price has fallen relative to distributions rather than that the dividend has grown.
Reece Limited's trailing dividend yield is approximately 1.4%, which is nearly 30% above its five-year historical average of approximately 1.1%. The forward analyst estimate extends this to approximately 1.9%, approaching nearly double the long-run baseline.
Total shareholder yield combines the dividend yield with the buyback yield to capture the full cash return a company is directing to shareholders. For Reece, the forward total shareholder yield is approximately 6.5%, comprising a 1.9% dividend yield and a 5.1% buyback yield, which presents a materially different return profile than the headline dividend figure alone.
Dividend yield relative to a company's own history is most reliable when the dividend is stable, the payout ratio is moderate, and earnings have not deteriorated materially. For Reece, a cover ratio of approximately 4.60x and a payout ratio of approximately 39% support the signal's credibility, though it functions as a screening tool rather than a standalone valuation verdict.


