
The Memo That Halved Meta’s AI Infrastructure Cost Estimate
3 hrs ago

REA Group‘s share price is sitting 42.8% below its 52-week high. The company’s revenue grew at 18.6% annually over three years, and eight of twelve covering brokers rate it a Buy. That disconnect between price action and business performance is the analytical question worth answering.
A broad sell-off in long-duration growth stocks, driven by rising bond yields, has punished high-multiple names across the ASX. REA Group has been caught in the downdraft. The question now is whether the market has done the sensible work of repricing a structurally strong business to a fair level, or whether it has overcorrected into genuine value territory.
This analysis unpacks what actually drove the drawdown, examines the financial and property-market evidence for and against the recovery case, and provides a framework for evaluating REA at current prices. It also addresses the valuation debate between brokers sitting on opposite sides of the trade.
The 42.8% drawdown from the 52-week high did not follow an earnings miss, a profit warning, or an operational failure. No company-specific announcement triggered the decline. Instead, REA was swept into a rotation out of long-duration growth stocks as bond yields climbed through May 2026, compressing multiples across the sector.
Three factors dominated the commentary:
“The market is belatedly acknowledging that double-digit growth can’t be extrapolated indefinitely from a mature Australian listings base.” The Australian, 19 May 2026
The distinction matters. A valuation multiple compression event, where the market pays less for the same earnings, looks structurally different from a fundamental earnings deterioration event, where the business itself is weakening. The evidence points to the former. Understanding that difference shapes the recovery thesis entirely.
REA Group reported full-year revenue of A$1,677 million in FY24, reflecting a three-year compound annual growth rate of 18.6%. That top-line trajectory is the kind of consistency that marketplace businesses with pricing power are supposed to deliver.
Then the profit line complicates the story. Net profit declined from A$323 million to A$303 million over the same three-year period. Rising operating costs, largely driven by headcount expansion and product investment, absorbed the operating leverage that revenue growth would otherwise have delivered to the bottom line.
| Metric | FY24 Full Year | HY25 (Dec 2024 Half) |
|---|---|---|
| Revenue | A$1,677M | A$943M (+11%) |
| NPAT | A$303M | A$330M (+8%) |
| Return on Equity | 18.9% | N/A |
The half-year results matter because they reframe the earlier profit dip. If net profit had continued to decline, the cost-investment narrative would look less convincing. It did not.
REA Group‘s HY25 results, released on 7 February 2025, reported total revenue of A$943 million (up 11%), net profit after tax of A$330 million (up 8%), and an interim dividend of A$0.93 per share (up 9%). All three metrics moved in the right direction.
The Q3 FY25 trading update, released on 8 May 2025, confirmed group revenue for the nine months to 31 March 2025 was up 10% year-on-year. Australian residential revenue grew in the high single digits, supported by listing volume growth in Sydney, Brisbane, and Perth.
The FY25 full-year results (year ended 30 June 2025) had not been released as of 24 May 2026, making them the next concrete earnings catalyst for investors tracking the stock.
REA Group‘s realestate.com.au attracts more than 55 million monthly visits. That traffic advantage over Domain and every other Australian property portal is not incidental; it is the visible output of a network effect that compounds over time.
The mechanics work in a self-reinforcing loop. More listings attract more buyers. More buyer traffic attracts more agents. More agents listing on the platform increases the total inventory, which draws yet more buyer attention. Once a platform reaches the dominant traffic position, agents face a rational incentive to prioritise it with premium listing spend, because that is where the eyeballs are.
Three distinct pillars underpin REA’s competitive position:
The NAB home-loan partnership extension (announced September 2025) adds a financial services growth option, with REA describing finance revenue as “a small but fast-growing contributor.”
“For long-term investors comfortable with cyclical earnings, this pullback looks like an opportunity rather than a sign the business is broken.” Motley Fool Australia, 16 May 2026
REA’s platform spans 10 countries and serves approximately 20,000 real estate agents in Australia. That installed base makes switching costs real and measurable.
A price-to-earnings ratio of 27-30x looks expensive when compared against the broader ASX index or a bank trading at 12x. It looks less expensive when compared against REA’s own five-year average of approximately 35x, and more nuanced still when set against global classifieds peers trading in the low-20s.
The question is which comparison is the right one.
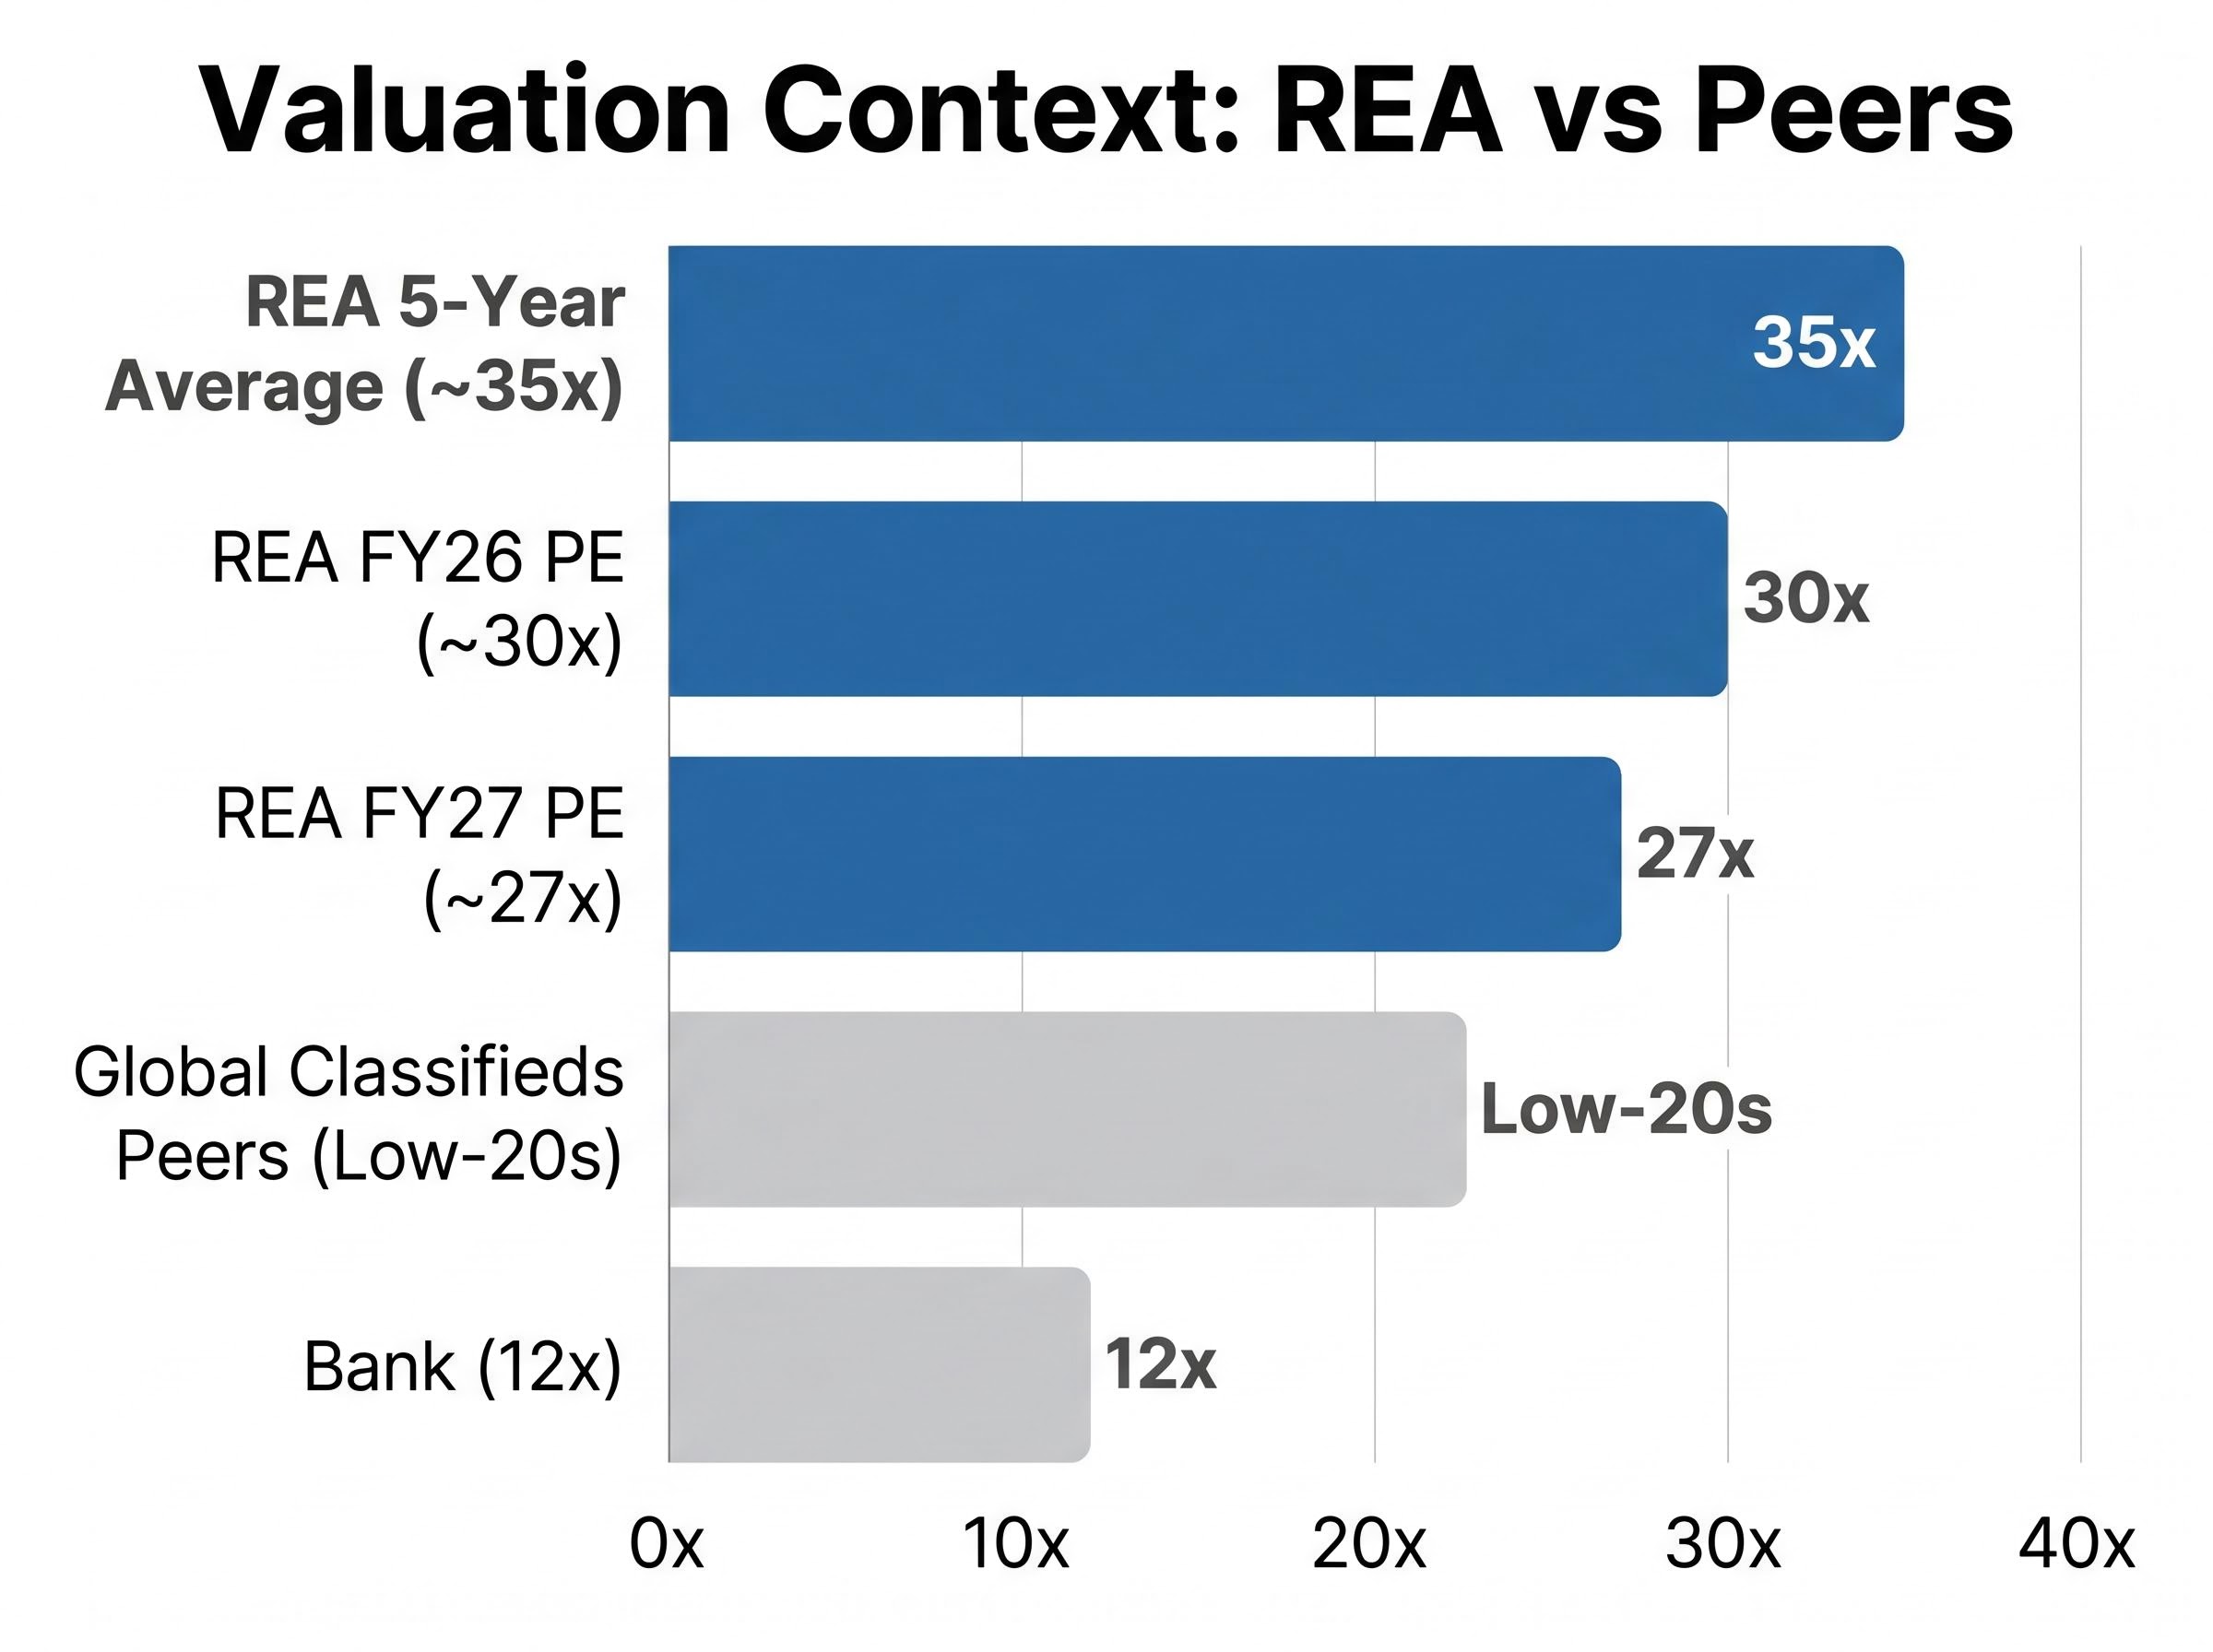
| Metric | REA Current | REA 5-Year Average | Global Classifieds Peers |
|---|---|---|---|
| FY26 PE | ~30x | ~35x | Low-20s |
| FY27 PE | ~27x | ~35x | Low-20s |
| Return on Equity | 18.9% | N/A | Varies |
Morningstar acknowledged REA’s wide economic moat but noted the stock was trading 10-15% above its fair value estimate as of May 2026, according to SMH Business reporting on 18 May 2026. Macquarie described it as “a still-demanding 30x FY26 PE even after a near-40 per cent drawdown.”
A PE ratio is a snapshot, not a verdict. For a business with double-digit revenue growth, high return on equity, and a network-effect moat, the appropriate valuation framework looks forward across multiple years of compounding earnings rather than fixing on a single year’s multiple.
Revenue growth, profit growth trajectory, and capital efficiency over a three-to-five-year horizon are more informative than the ratio at any single point in time. A 30x multiple on a business growing earnings at 15% annually compresses to a lower effective multiple within two to three years. The same 30x on a business with flat earnings stays at 30x indefinitely.
That does not make the current price automatically cheap. It means the valuation question is inseparable from the growth durability question, which is precisely what the broker debate centres on.
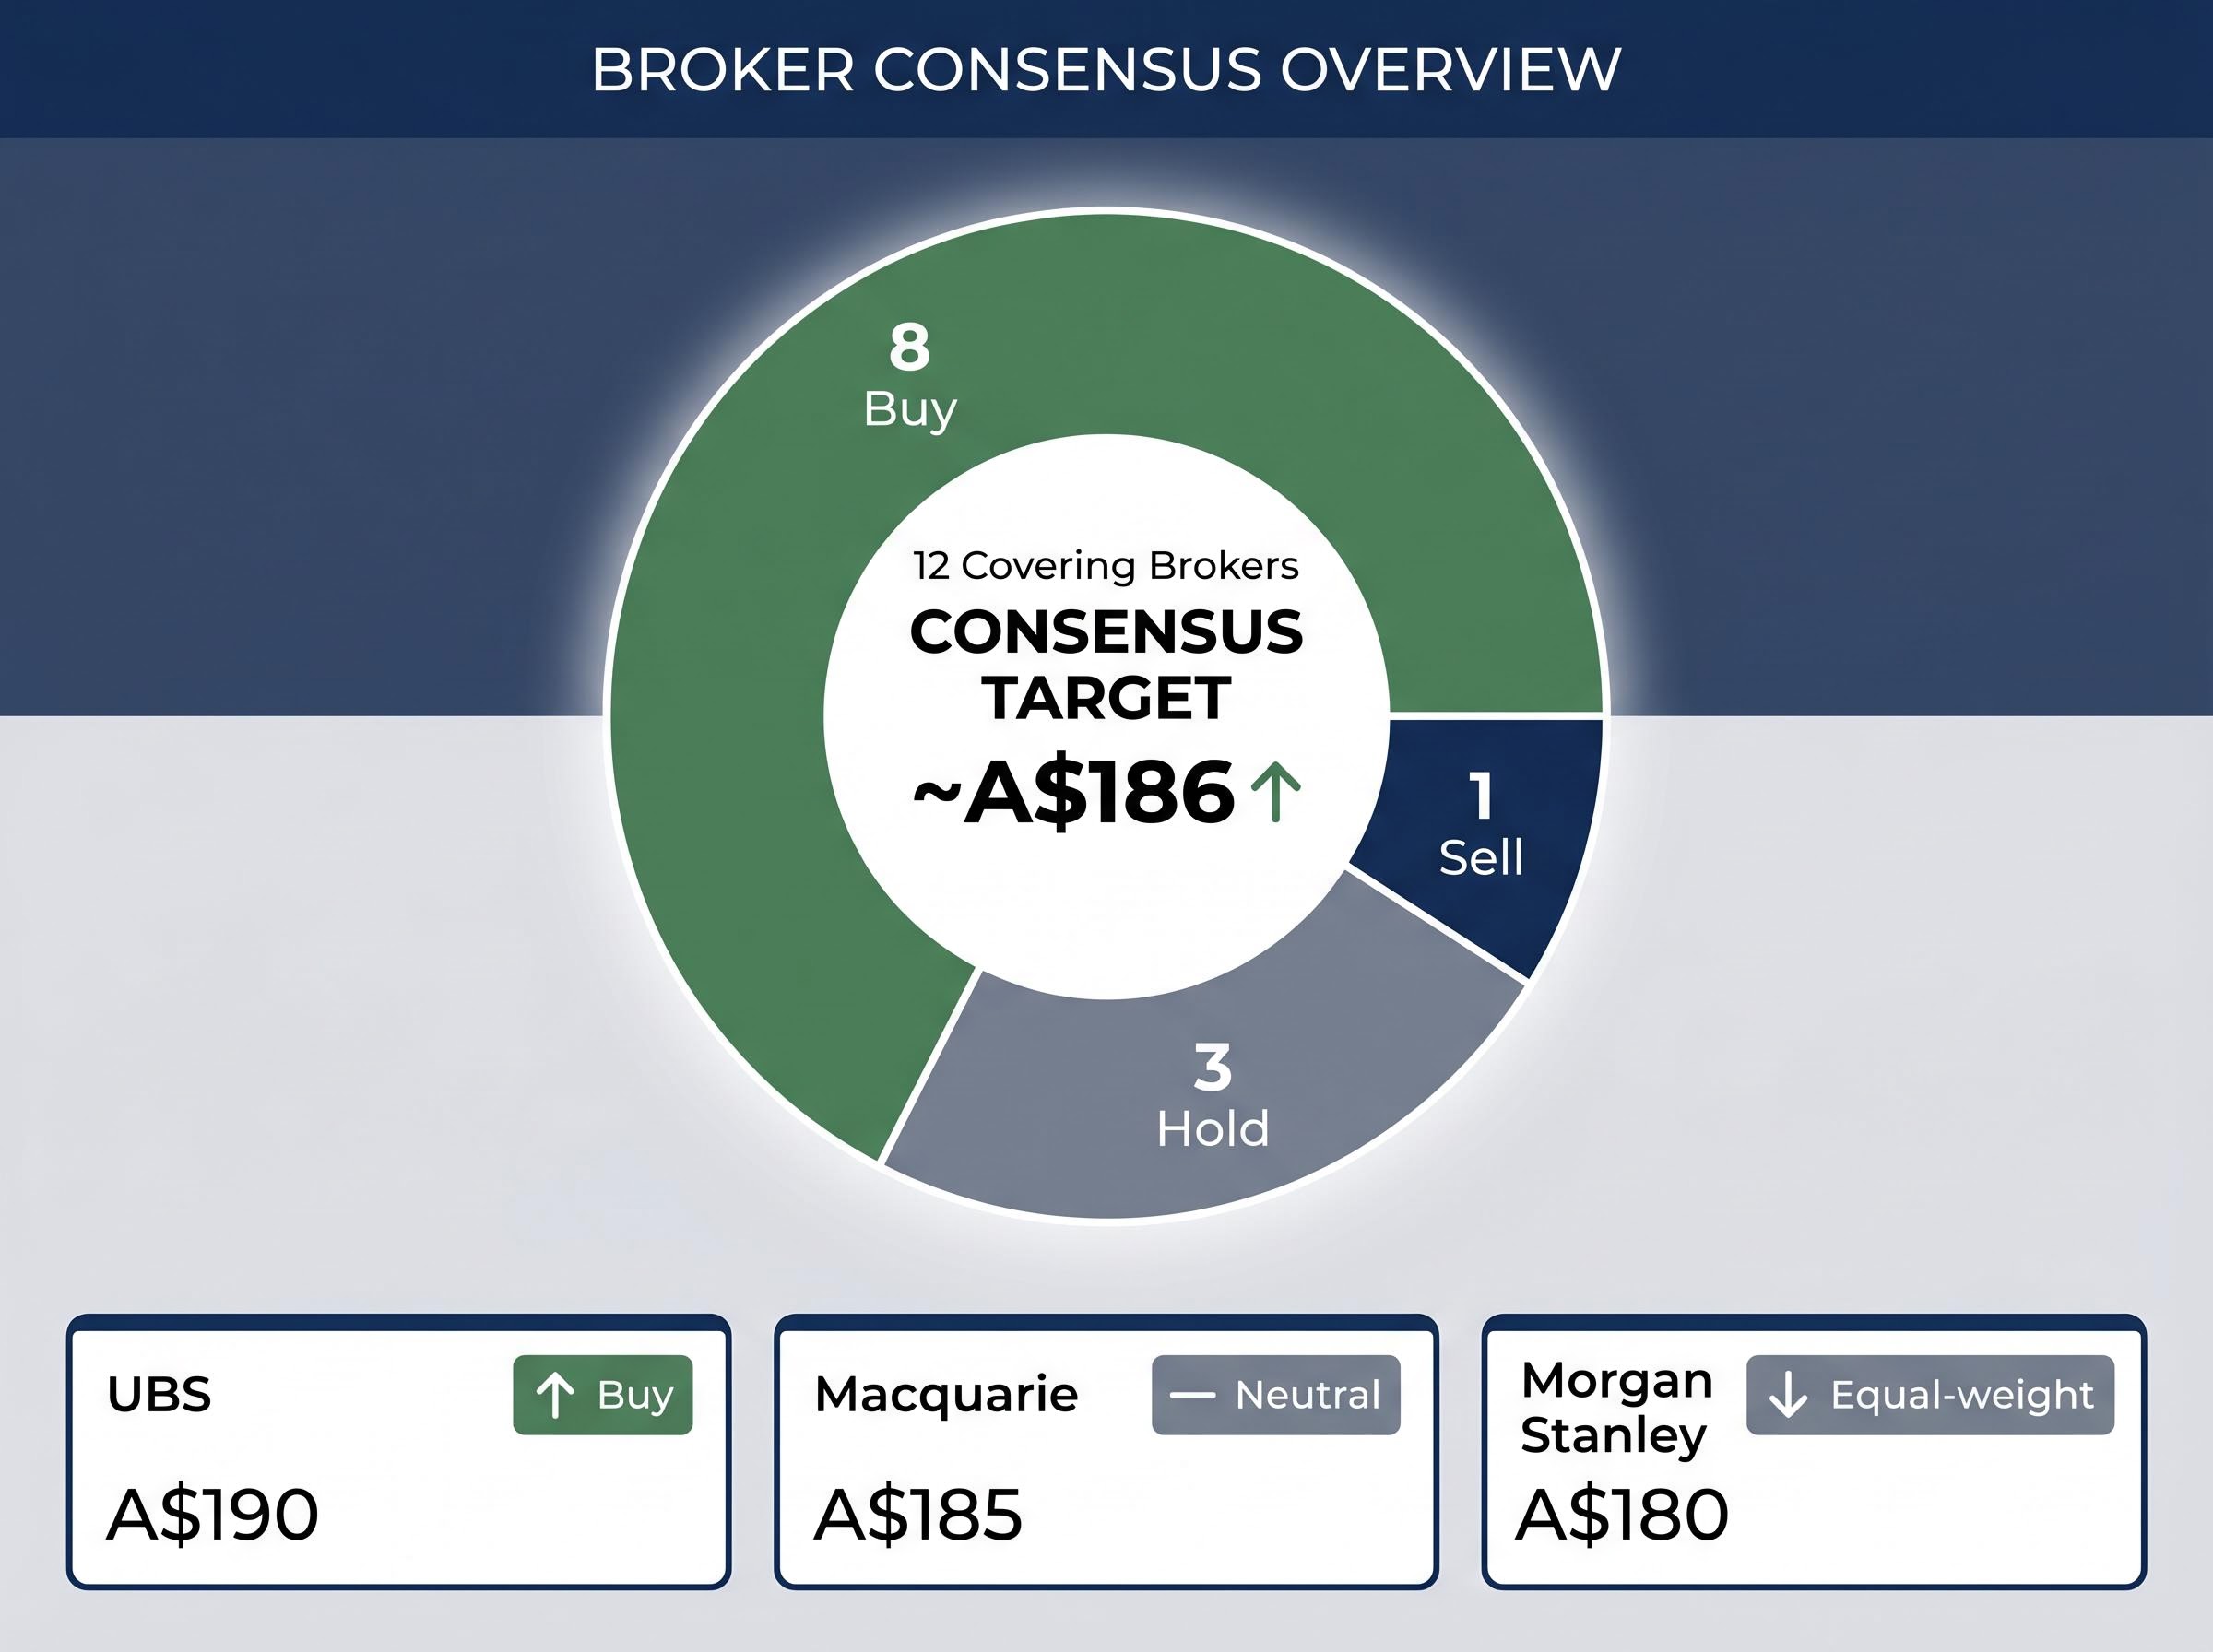
The broker consensus, 8 Buy, 3 Hold, 1 Sell, with an average target of approximately A$186, leans bullish. It is not unanimous, and the disagreement is instructive.
| Broker | Rating | Target | Key Rationale |
|---|---|---|---|
| UBS | Buy | A$190 | Channel checks show solid depth uptake; improving NSW and QLD listings |
| Morgan Stanley | Equal-weight | A$180 | Near-30x FY26 EPS still rich vs global peers at low-20s |
| Macquarie | Neutral | A$185 | Trimmed from A$195; demanding multiple even post-drawdown |
| Consensus (12 brokers) | 8 Buy / 3 Hold / 1 Sell | ~A$186 | Roughly 35% above then-current price |
UBS maintained its Buy rating, arguing that “current levels imply a material derating in returns that we don’t see in our forecasts,” citing channel checks pointing to solid depth uptake and improving new listings in NSW and Queensland (The Australian, 21 May 2026).
The buy-side case finds support in the AFR’s reporting. A fund manager was quoted on 22 May 2026: “With listing volumes recovering and REA still the clear category killer, this looks more like multiple compression than an earnings downgrade story.”
Morgan Stanley projects mid-teens earnings growth but warns that near-30x FY26 EPS remains rich compared with global classifieds peers trading in the low-20s. Limited multiple upside and modest downside if the property cycle underwhelms, in its assessment (AFR, 13 May 2026).
“We don’t see evidence of structural deterioration, but we also don’t think investors are being compensated for cyclical and regulatory risk at the current price.” Morningstar, via SMH Business, 18 May 2026
The quality of the bull case is tested by the strength of the bear case. Both sides have legitimate evidence. The disagreement is not about the business; it is about what price adequately compensates for the risks.
Four specific variables will resolve the valuation debate over the coming months:
Total listings remain approximately 18% below the decade average, a statistic that simultaneously reflects the risk of a supply-constrained market and the structural support it provides: low inventory keeps agents competing for premium platform exposure.
KPMG’s Residential Property Market Outlook 2026 forecasts national house price growth of +7.7% in 2026, with Brisbane and Perth identified as the strongest performers. CoreLogic’s Home Value Index for April 2026 shows national values up 0.6% for the month and 6.2% over twelve months.
The drawdown is macro-driven. The business fundamentals remain intact. The valuation debate is genuinely contested rather than obviously resolved in either direction.
For investors with a three-to-five-year horizon, the AFR and UBS framing carries weight: at approximately 27x FY27 earnings versus a five-year average of 35x, the market appears to be pricing in a more conservative growth scenario than the company’s recent results support. REA is not a broken business.
It is also not a screaming bargain by every measure. Morningstar and Morgan Stanley caution that 30x FY26 earnings, still above global classifieds peers in the low-20s, does not offer a margin of safety against cyclical or regulatory disappointment. Investors with shorter horizons face a genuine risk that the multiple stays compressed until bond yields reverse direction.
Three forward variables will sharpen the picture: the FY25 full-year results (the next concrete earnings data point), the trajectory of national listing volumes through the second half of 2026, and any developments from the ACCC’s ongoing digital platforms inquiry. Tracking those catalysts transforms a passive position into a monitored thesis with clear triggers for reassessment.
This article is for informational purposes only and should not be considered financial advice. Investors should conduct their own research and consult with financial professionals before making investment decisions. Past performance does not guarantee future results. Financial projections are subject to market conditions and various risk factors.
The REA Group share price fell 42.8% from its 52-week high primarily due to rising bond yields in May 2026 driving a broad rotation out of long-duration growth stocks, not any company-specific earnings miss or operational failure.
A multiple compression event occurs when the market pays a lower price-to-earnings ratio for the same level of earnings, reducing a stock's price without any deterioration in the underlying business. REA Group's drawdown fits this description, as revenue and profit metrics remained broadly intact through the selloff.
Eight of twelve covering brokers rate REA Group a Buy with an average price target of approximately A$186, roughly 35% above the then-current price, though Morgan Stanley and Macquarie maintain neutral ratings citing a near-30x FY26 PE ratio that remains demanding relative to global classifieds peers in the low-20s.
Key risks include property cycle sensitivity with total listings still around 18% below the decade average, ongoing ACCC regulatory scrutiny of digital platforms pricing transparency, agent and vendor budget pressure from elevated interest rates, and execution risk from REA's India investment through Elara Technologies.
The FY25 full-year results (for the year ended 30 June 2025) had not been released as of May 2026 and represent the next concrete earnings data point, alongside the trajectory of national listing volumes through the second half of 2026 and any developments from the ACCC's digital platforms inquiry.


