QBE Insurance Group’s trailing dividend yield of approximately 4.6% sits roughly a full percentage point above its five-year historical average of 2.84%. For income-focused investors on the ASX, that gap is not just a number; it is a question worth asking. Dividend yield relative to a stock’s own history remains one of the more reliable valuation signals available for blue-chip companies, particularly in the financials and insurance sectors where earnings are mature and distributions are a primary mechanism of shareholder return. With QBE’s share price sitting 24.2% above its 52-week low but its yield still elevated versus history, the stock occupies an interesting position in the current market. This analysis examines what the yield signal means for QBE, what the underlying business and earnings fundamentals indicate about sustainability, what macro and sector forces are in play, and how a Dividend Discount Model framework can complement yield analysis when assessing valuation.
When a dividend yield rises above its own history, something has shifted
A trailing dividend yield sitting above a stock’s own multi-year average can tell two very different stories. The distinction matters, and getting it wrong is the difference between identifying a genuine opportunity and walking into a value trap.
The two interpretations break down as follows:
- Undervaluation signal: The share price has declined or lagged while earnings and dividends have remained stable or grown, compressing the price relative to the payout. A stable or declining payout ratio supports this reading.
- Earnings risk signal: The yield has risen because the market is pricing in deteriorating fundamentals, potential dividend cuts, or balance sheet stress. A rising payout ratio or declining earnings trajectory supports this reading.
For QBE, the gap between the current trailing yield of 3.78% and the five-year average of 2.84% amounts to approximately 94 basis points. That is a meaningful deviation, neither trivially small nor alarmingly wide.
The Australian Financial Review’s analysis of ASX blue-chip yields found that yields moderately above historical averages (approximately 0.5-1.5 percentage points higher) tend to indicate undervaluation when earnings and payout ratios are stable, while very high yields relative to history often coincide with earnings downgrades or unsustainable payouts.
For blue-chip ASX companies with stable, mature business models, an elevated yield accompanied by a stable or declining payout ratio is more likely to signal undervaluation than dividend stress. The question is whether QBE’s fundamentals support that reading.
Dividend trap signals worth screening for include a rising payout ratio approaching 100%, earnings cover below 1.5x, and a share price decline driving the yield higher rather than a genuine increase in distributions, all three of which are absent from QBE’s current profile but remain the right checklist for any elevated-yield position.
When big ASX news breaks, our subscribers know first
From Townsville marine insurer to global property and casualty group
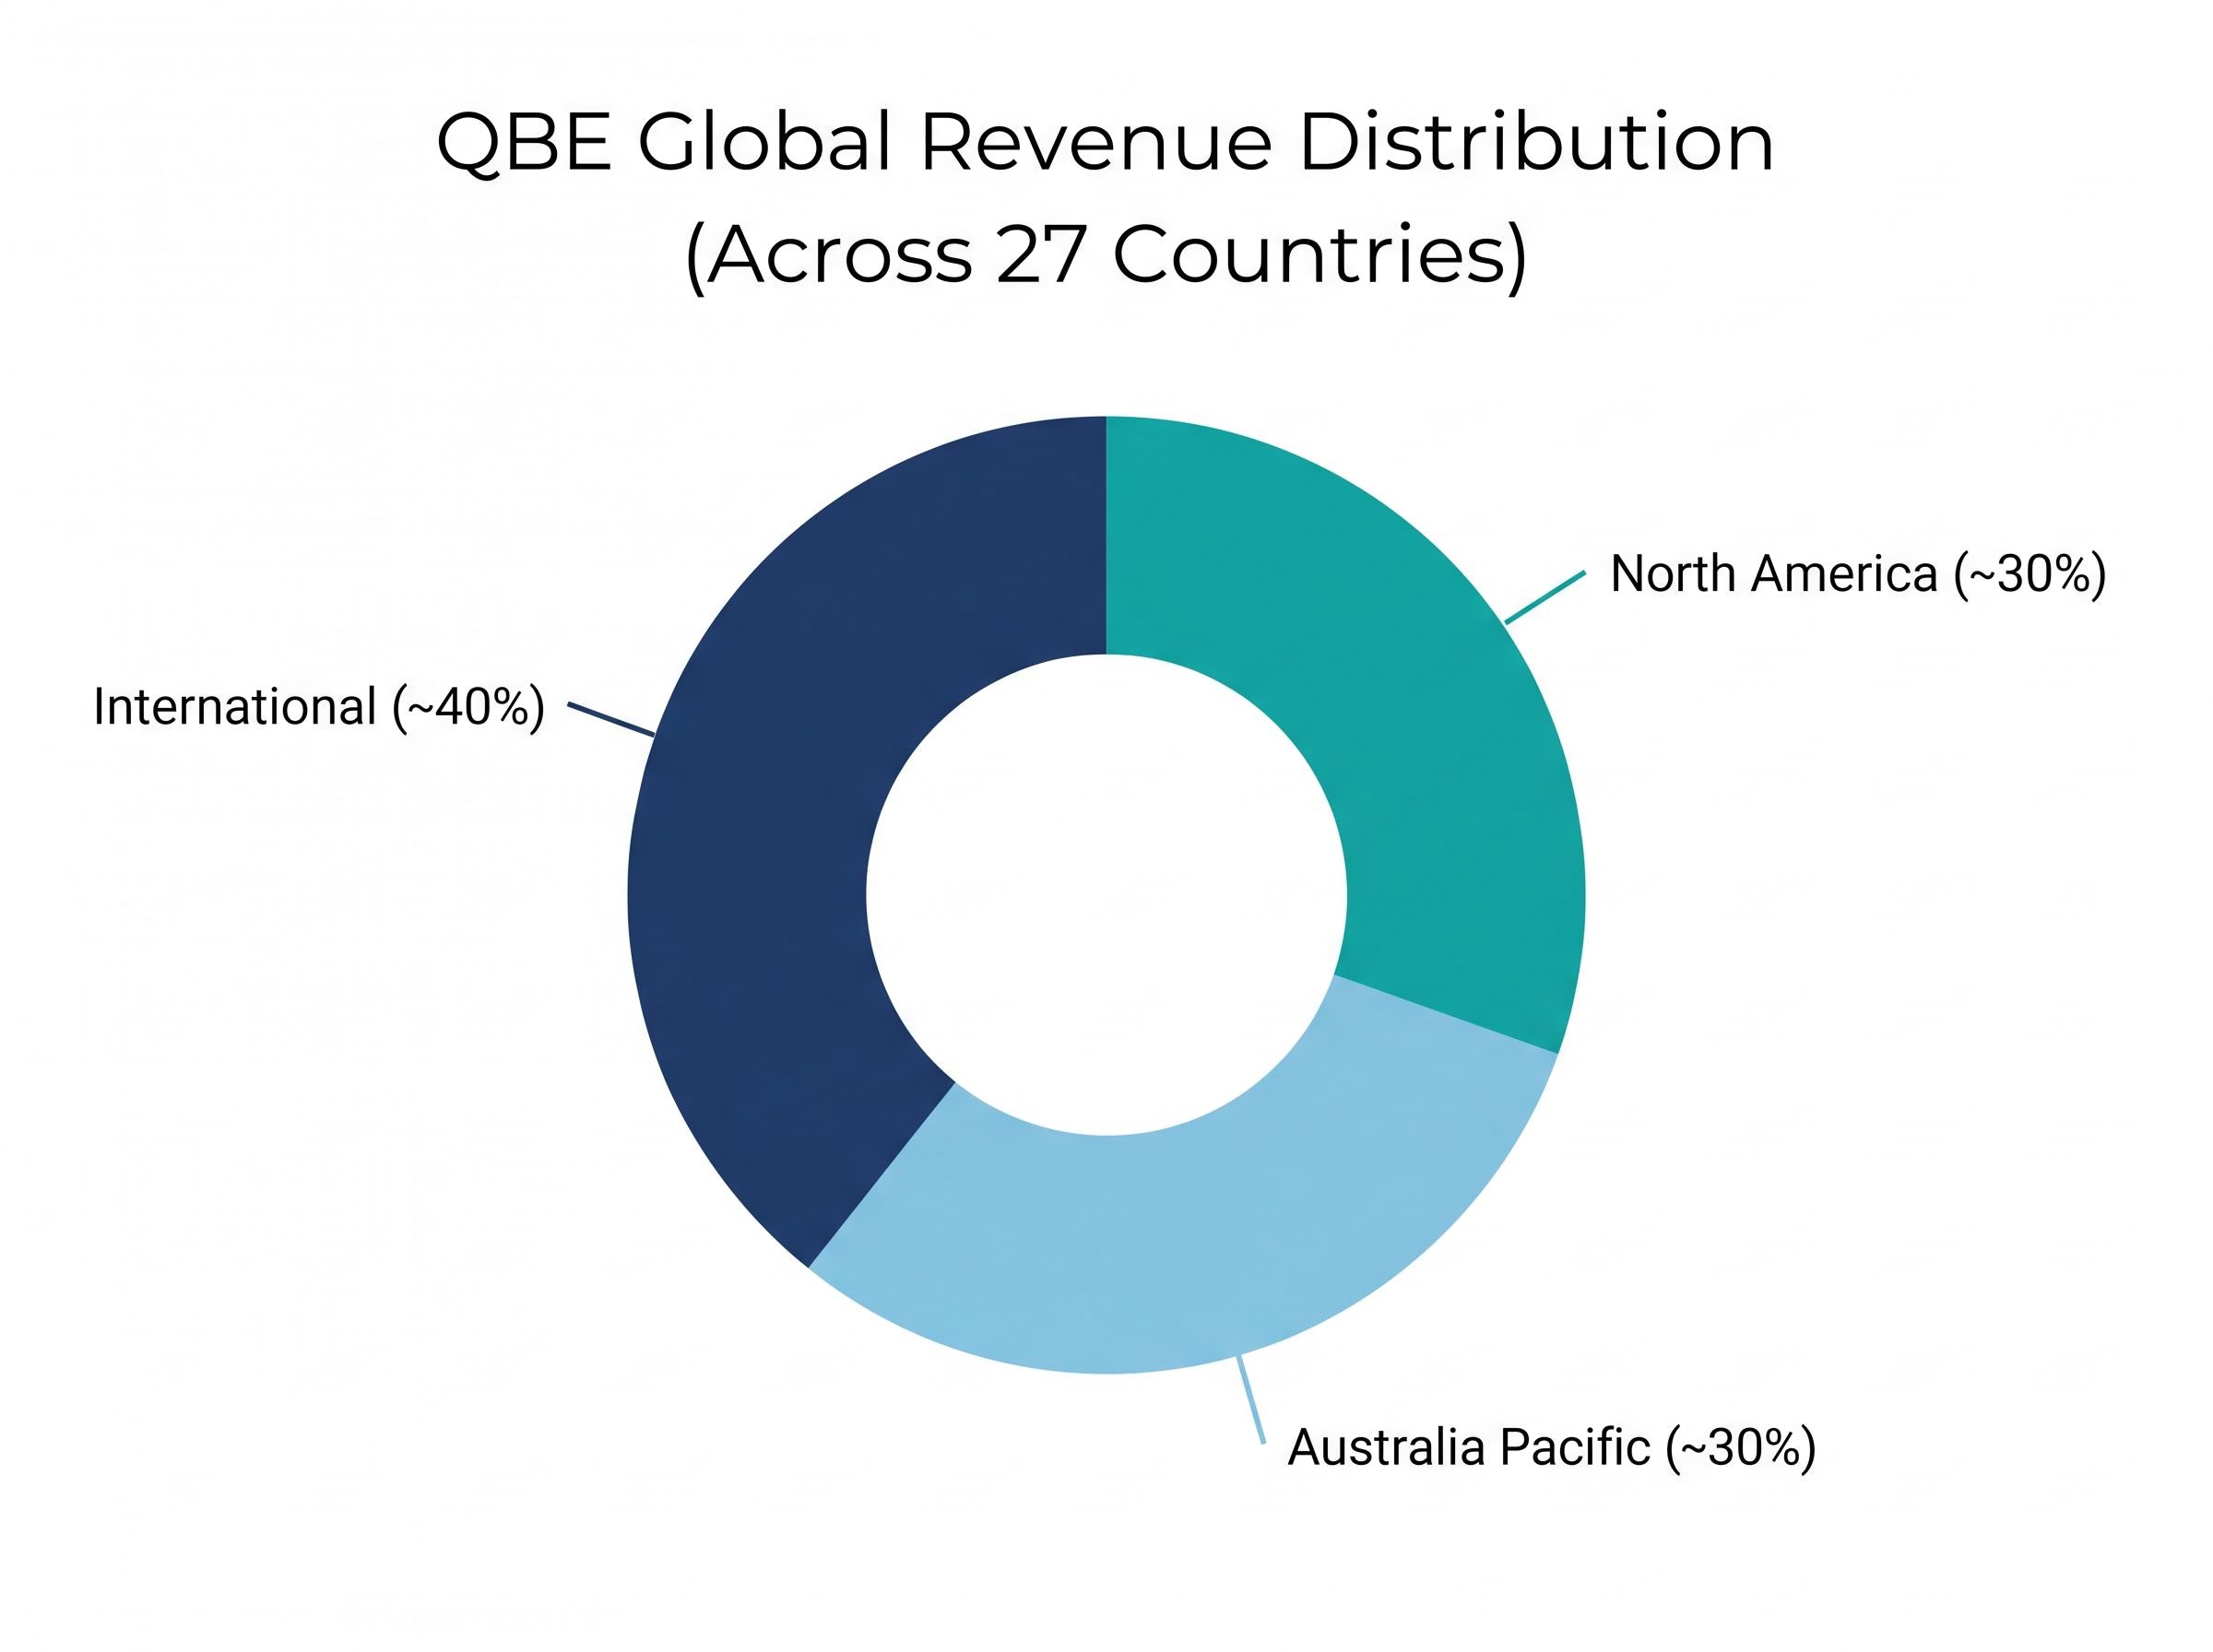
QBE began as a marine insurer in Townsville in the late 19th century. It is now one of Australia’s largest global insurers, operating across 27 countries with a revenue base that spans commercial, consumer, reinsurance, and agricultural insurance categories. The scale of that evolution matters for dividend analysis because it directly shapes the resilience of the earnings base funding distributions.
The group operates through three divisions, each anchored in a distinct geography:
| Region | Operating Division | Approximate Revenue Share |
|---|---|---|
| Australia | Australia Pacific | ~30% |
| United States | North America | ~30% |
| Europe and other markets | International | ~40% |
This geographic diversification reduces dependence on any single regulatory environment, economic cycle, or catastrophe-prone region. It also distinguishes QBE from more domestically concentrated ASX peers such as Suncorp and IAG, whose earnings are more tightly correlated with Australian economic conditions and weather patterns.
QBE’s dividend structure for Australian shareholders
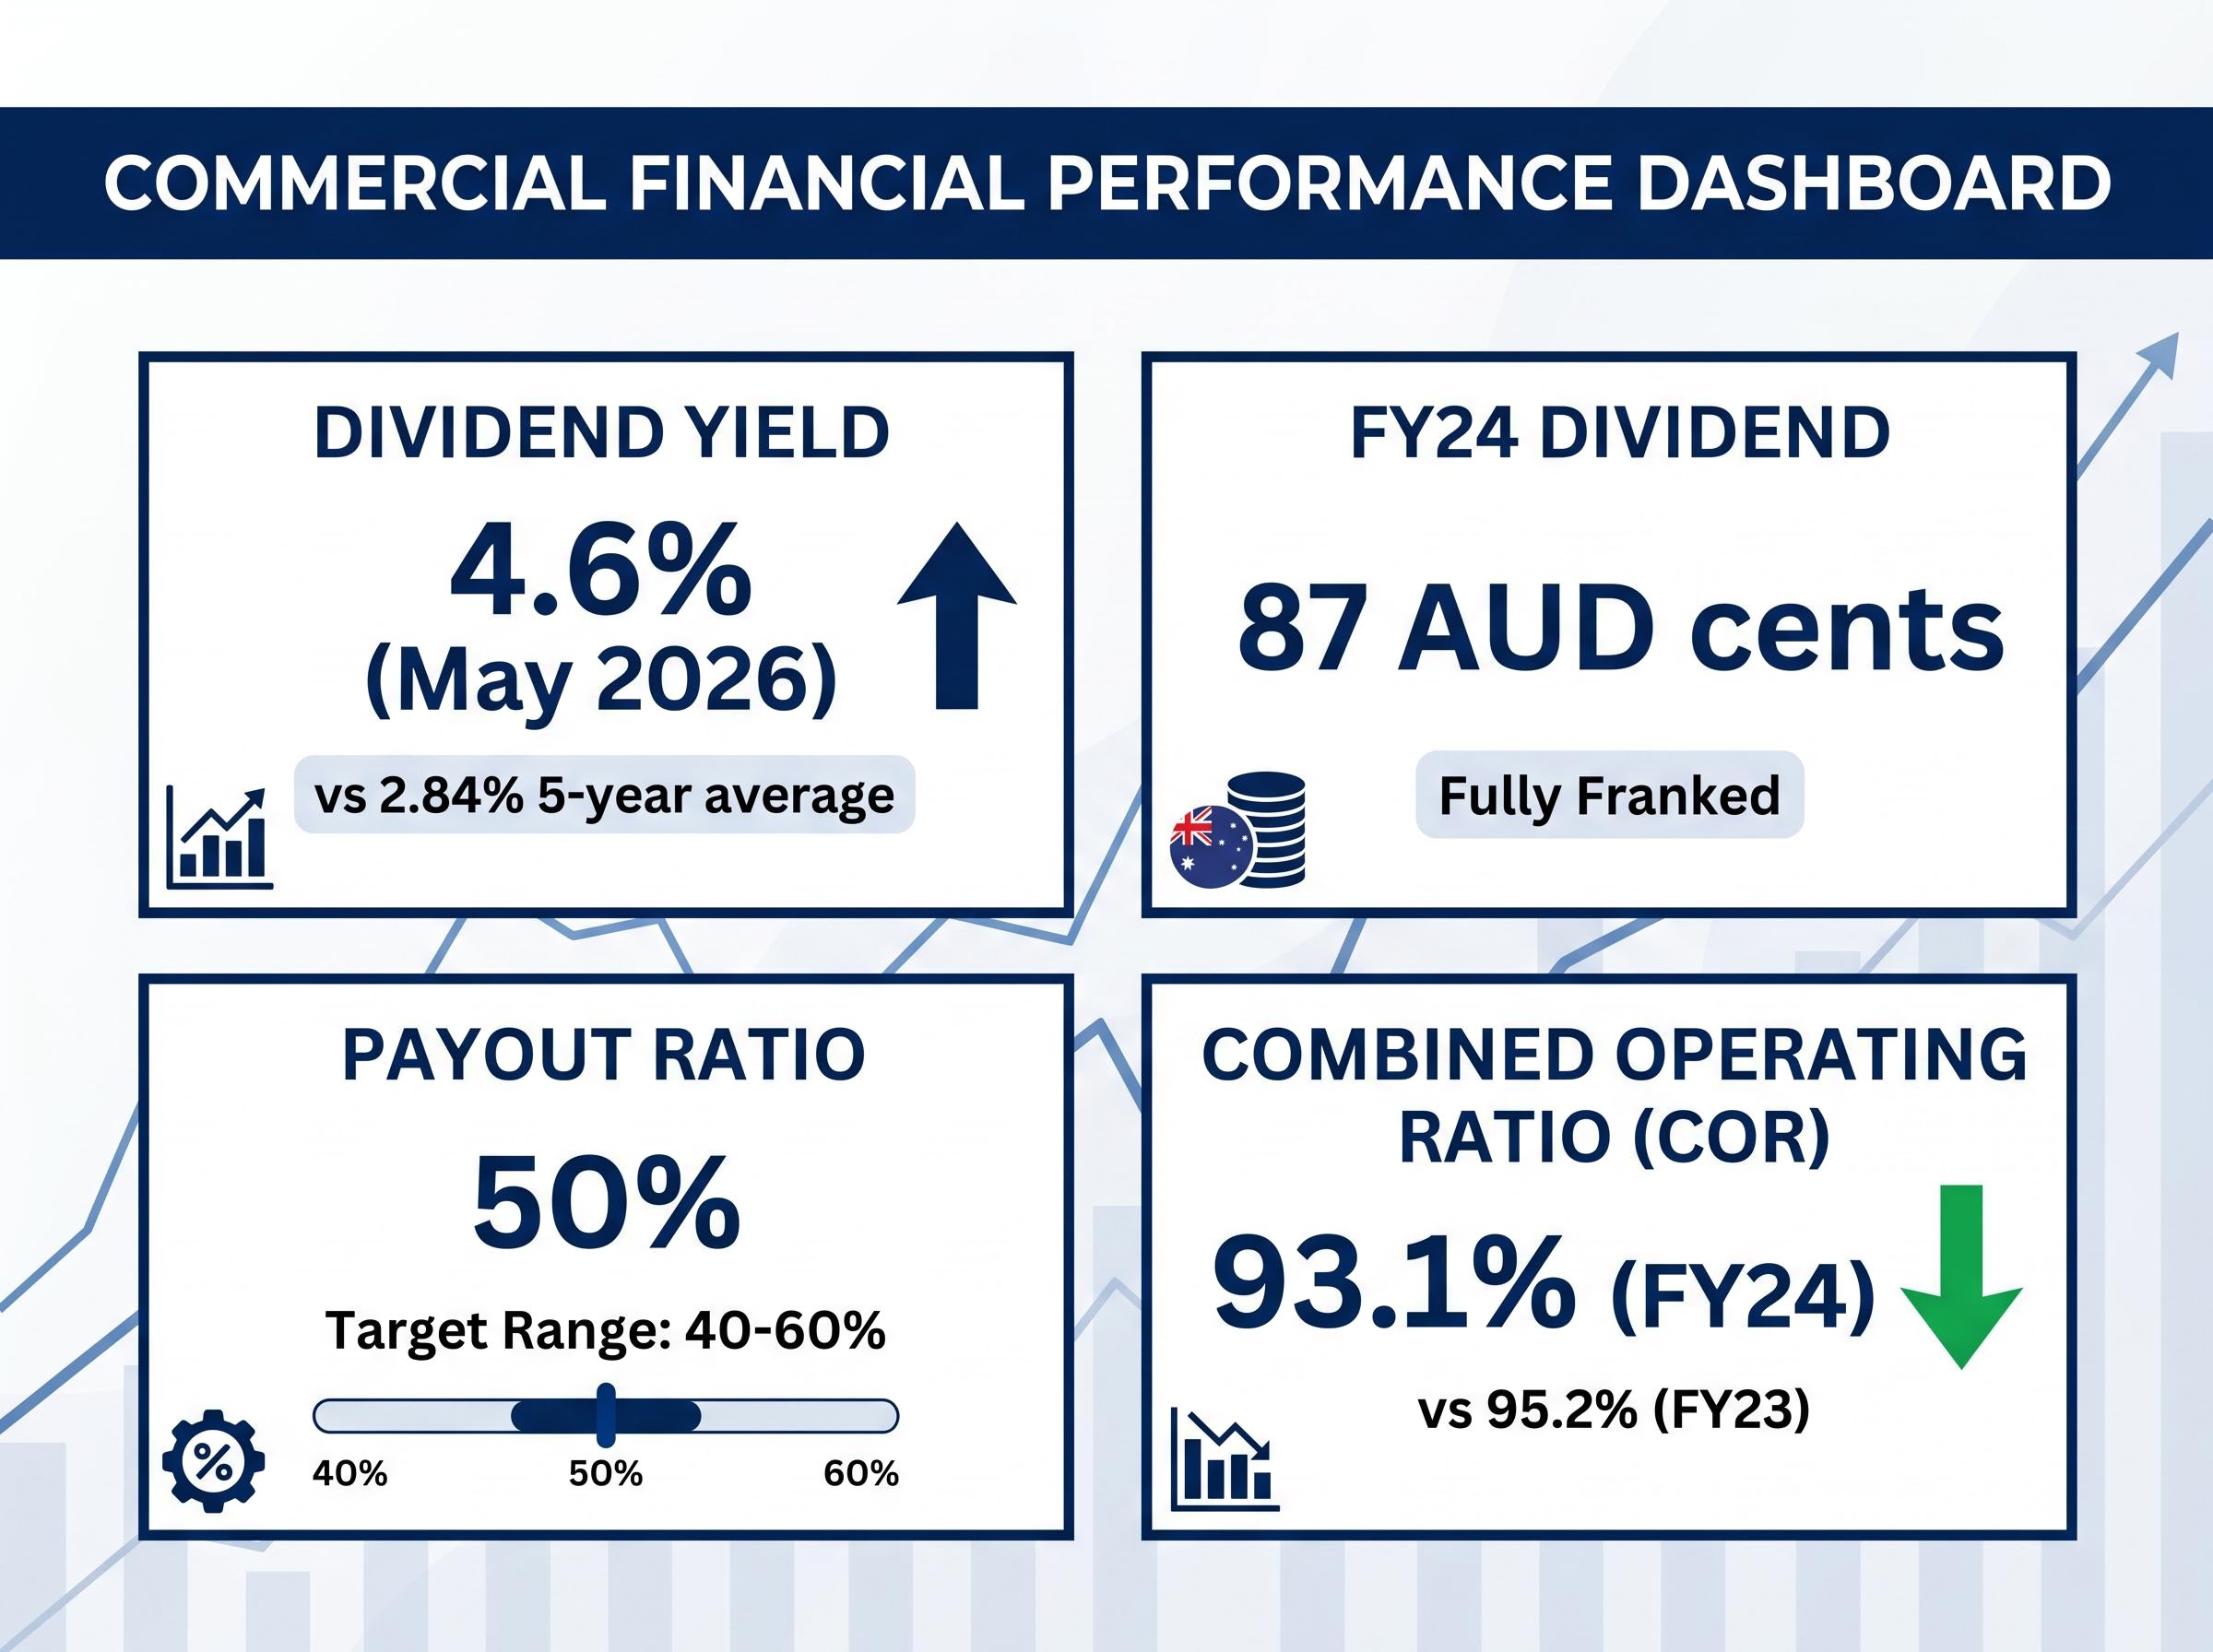
QBE declared a total FY2024 dividend of 87 Australian cents per share (an interim dividend plus a final dividend of 63 Australian cents), fully franked for Australian tax residents. The franking credit provides a tangible tax benefit that enhances the effective after-tax yield for domestic shareholders.
The grossed-up yield on a fully franked dividend can be substantially higher than the face cash figure for eligible Australian investors, with a 30% corporate tax rate translating a $70 cash payment into $100 of total value for zero-tax investors such as SMSFs in pension phase.
The Dividend Reinvestment Plan (DRP) remains active and was offered on the 2024 interim dividend, with the issue price determined by volume-weighted average price over a specified period. The FY2024 payout ratio came in at 50% of adjusted net profit after tax, sitting squarely within management’s stated target range of 40-60%.
The earnings engine behind the yield: underwriting discipline and investment income
QBE’s current yield is not the product of a single earnings driver. Two independent forces pushed FY2024 profits higher, and their interaction explains why the yield is elevated but arguably not fragile.
The first is underwriting profitability. QBE’s FY2024 combined operating ratio (COR), which measures claims and expenses as a proportion of premium income, improved to 93.1% from 95.2% in FY2023. A COR below 95% is widely regarded as a marker of genuine underwriting profitability, meaning the insurer is generating profit from its core business of writing and managing risk rather than relying on investment returns to offset underwriting losses. The 1H 2024 COR of 93.8% confirmed this discipline was sustained through the first half.
The second is investment income. As reinvestment yields on QBE’s fixed-income portfolio improved alongside higher interest rates, investment income grew materially. Net earned premium growth ran in the high single digits year-on-year during FY2024, expanding the premium base over which both drivers operate.
Key FY2024 earnings metrics:
- Combined operating ratio: 93.1% (improved from 95.2% in FY2023)
- Net earned premium growth: high single digits year-on-year
- Payout ratio: 50% of adjusted NPAT, within the 40-60% target range
- Total dividend: 87 Australian cents per share, fully franked
A Livewire Markets broker summary described QBE’s yield as “appealing given the quality of earnings leverage to higher rates.”
The payout ratio of 50% demonstrates that management is distributing profit without stretching the balance sheet. QBE ended FY2024 with a regulatory capital position above its internal target range. It is worth noting that the trailing yield had moved to approximately 4.6% as of late May 2026 based on the prevailing share price, further widening the gap to historical averages.
Tailwinds and risks that income investors cannot ignore
The sustainability of QBE’s yield depends on identifiable macro and sector variables. Each tailwind has a corresponding risk, and income investors benefit from mapping both sides.
| Earnings Tailwind | Key Risk |
|---|---|
| Elevated interest rates boosting investment income on the fixed-income portfolio | Interest rate normalisation could reduce investment income tailwinds |
| Firm commercial insurance pricing supporting premium growth and underwriting margins | Pricing cycle moderation could compress margins over time |
| Strong capital position providing management flexibility to sustain distributions | Elevated natural catastrophe losses above long-term averages increasing claims volatility |
On the tailwind side, the Australian Financial Review noted around the February 2025 result that “as long as global rates remain at or above current levels, QBE’s investment income will remain a strong tailwind for earnings.” Macquarie and Morgan Stanley retain positive or outperform ratings on the stock, according to a Livewire Markets summary from 25 February 2025, citing leverage to higher bond yields and resilient pricing power in commercial lines.
The Swiss Re Institute’s global P&C market outlook for 2025-2026 projects moderating but still positive non-life premium growth alongside improved underwriting profitability, a backdrop that supports the durability of the earnings tailwinds underpinning QBE’s current dividend.
On the risk side, Insurance News reported in October 2024 that natural catastrophe volatility keeps reinsurers and insurers on edge, with rising frequency and severity of weather events. QBE’s FY2024 and 1H 2024 updates confirmed that catastrophe losses remained within budget for the year, but the trend is above long-term averages. Reinsurance costs remain firm but are no longer accelerating, according to Insurance News in January 2025, which reduces one source of earnings volatility.
Income investors who can monitor these three variables, interest rates, catastrophe activity, and reinsurance costs, are equipped to track the dividend thesis dynamically rather than relying on a static yield snapshot.
Why yield alone is not enough: introducing the Dividend Discount Model
The analysis so far has established that QBE’s yield sits above its historical average and that the earnings base appears reasonably sound. The Dividend Discount Model (DDM) formalises this intuition into a structured valuation framework.
The DDM values a stock by discounting expected future dividends back to their present value. In plain terms, it answers a specific question: given what the company is expected to pay in dividends going forward, and given the return an investor requires, what should the share price be today? When the observed yield is above the rate implied by fundamentals, it may suggest the market is pricing in higher risk than the earnings evidence supports.
The three inputs a DDM requires for QBE are:
- Current dividend per share (87 Australian cents for FY2024), which represents what the company has most recently paid to shareholders
- An assumed dividend growth rate, which captures expectations about how quickly future dividends will increase, informed by earnings growth trends, payout ratio stability, and premium growth
- A required rate of return, which represents the minimum return an investor demands for holding the stock, reflecting its risk profile
Maple-Brown Abbott’s Dougal Maple-Brown noted in a February 2026 Livewire Markets discussion that yields above long-term averages often correspond to de-rated names where fundamentals have not deteriorated as much as prices suggest.
A Livewire Markets education piece from March 2024 advised that investors in ASX financials should check payout ratio stability, earnings cyclicality, and capital buffers alongside yield signals. This aligns directly with the DDM’s logic.
Applying the DDM lens to QBE’s current yield
When QBE’s yield sits above its historical average, the payout ratio remains at 50% within the target range, and earnings are growing on the back of underwriting discipline and investment income, the DDM framework suggests the market price may embed a risk premium not fully supported by the current fundamental picture. The gap between the observed yield and historical norms is consistent with a stock trading at a discount to what a fundamentals-driven model would imply.
A formal DDM requires specific assumptions about growth rates and discount rates that carry genuine uncertainty, particularly for insurers where catastrophe events can cause large swings in earnings. Income investors considering this approach should research and validate those assumptions independently rather than treating any single DDM output as definitive.
For readers wanting to understand the theoretical foundations before applying the formula to QBE, our dedicated guide to the dividend discount model traces how John Burr Williams built the framework in 1938, explains the core P = D1 / (r – g) formula, and walks through why small changes in the assumed growth rate produce significant valuation swings.
A yield signal worth examining, not acting on alone
The evidence assembled here points in a consistent direction without eliminating uncertainty. QBE’s trailing yield of approximately 4.6% sits meaningfully above the five-year average of 2.84%. The FY2024 payout ratio of 50% is comfortably within the stated target range. The earnings drivers, a COR of 93.1%, investment income tailwinds from higher interest rates, and firm commercial pricing, provide a reasonably sound foundation for dividend sustainability.
The risks are real. Catastrophe loss volatility, the possibility of interest rate normalisation, and the inherent complexity of a globally operating insurer with multiple moving parts all keep the picture from being one-sided. Macquarie and Morgan Stanley retain positive ratings, but both flag catastrophe activity and reinsurance cost trends as the variables to watch.
The yield signal is a starting point, not a conclusion. Three actions could sharpen the picture from here:
Dividend-growth quality screens that filter for payout sustainability and earnings cover have historically produced stronger risk-adjusted returns than pure yield-chasing strategies, a finding that reinforces why QBE’s 50% payout ratio and improving COR matter more to the income thesis than the headline yield figure alone.
- Check QBE’s upcoming results for COR and payout ratio trends, as these are the two fundamental anchors for dividend sustainability
- Run a simplified DDM using the current dividend per share and a range of assumed growth rates to test whether the implied valuation looks reasonable under different scenarios
- Compare QBE’s yield against ASX insurance peers including Suncorp and IAG to establish whether the premium is sector-wide or company-specific
Income investors who treat an above-average yield as a question to investigate, rather than an answer in itself, are more likely to build a position on sound analytical foundations.
This article is for informational purposes only and should not be considered financial advice. Investors should conduct their own research and consult with financial professionals before making investment decisions. Past performance does not guarantee future results. Financial projections are subject to market conditions and various risk factors.