

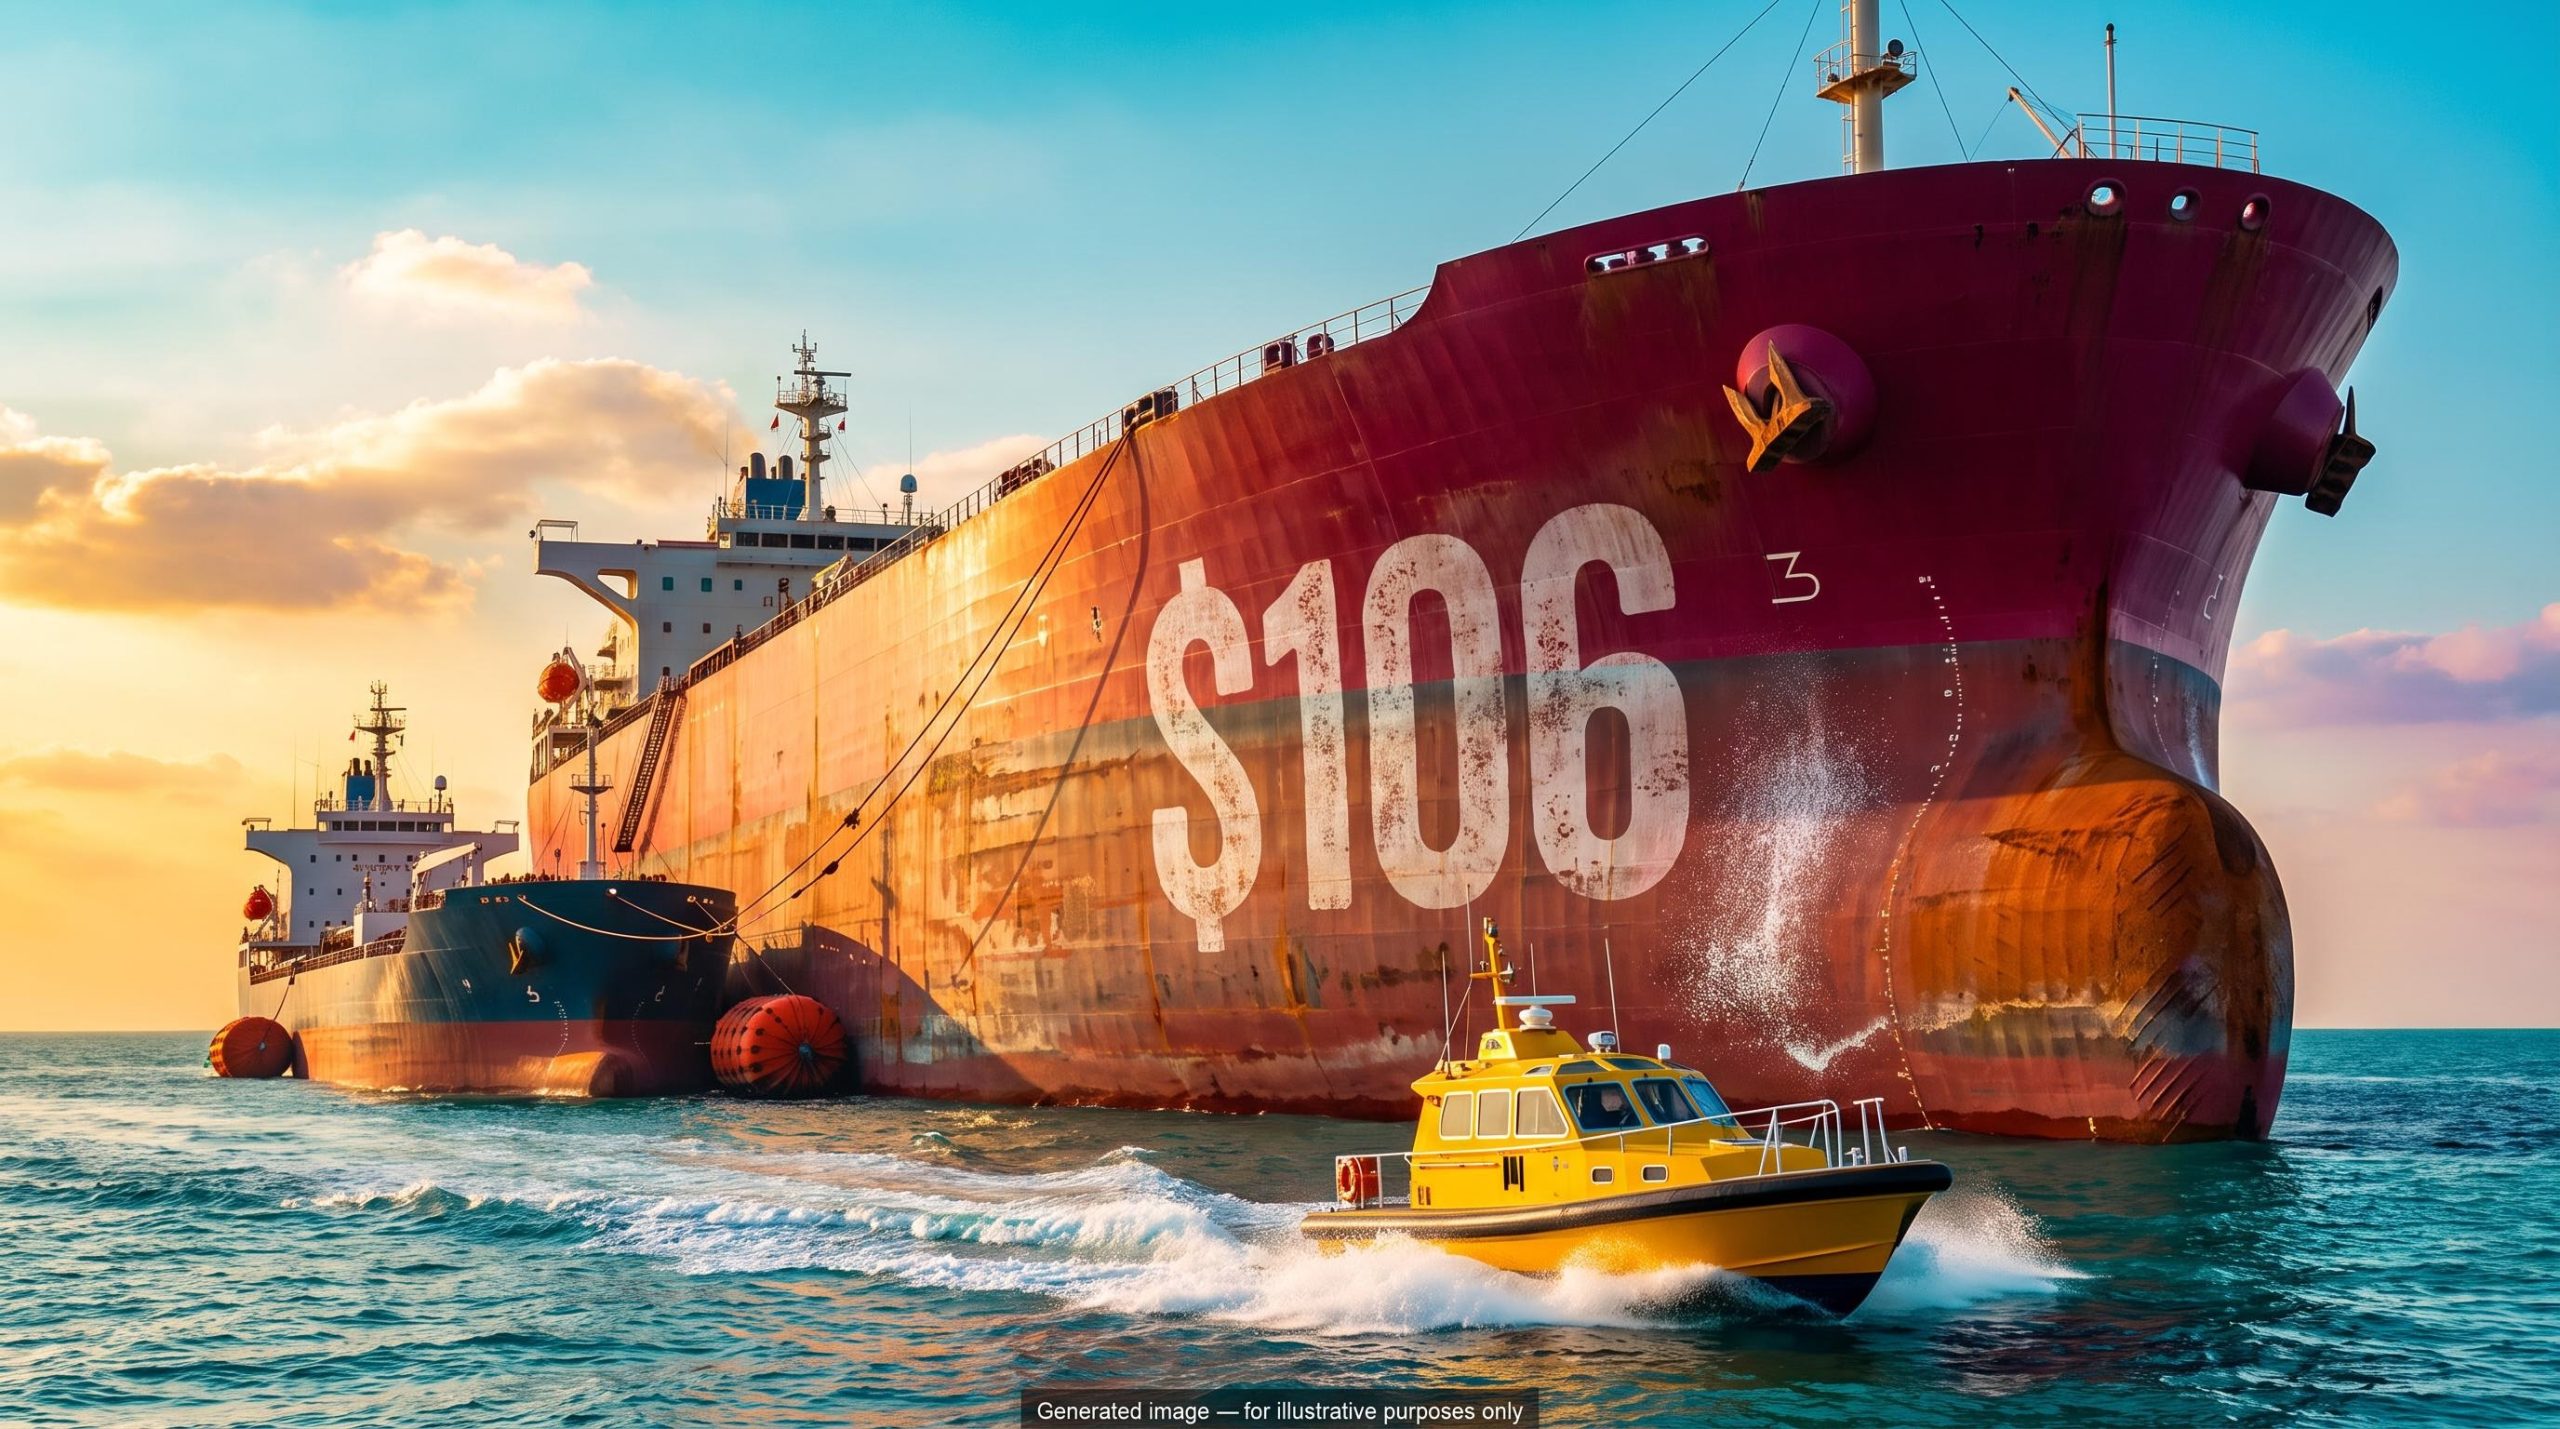
Brent crude settled around $106 a barrel on 14 October 2026, a level that conventional wisdom treats as a recession trigger. Yet services activity is still expanding, and oil prices above $100 have so far squeezed household budgets without breaking the wider economy.
The puzzle runs deeper than the headline price. Tanker traffic through the Strait of Hormuz has largely recovered, but the price has not followed it down.
Consumer sentiment sits near record lows while business surveys stay comfortably above 50, the line that separates expansion from contraction. Exact closing figures vary slightly across data providers, but every source agrees Brent is firmly in triple digits.
Here is what the evidence tells you about three things: why crude stays expensive even with ships moving, why the economy is absorbing the hit, and which specific signals would mark genuine relief or genuine danger.
Why is Brent still above $100 if Hormuz flows have recovered?
Start with the volumes. Before the US-Israel war with Iran began on 28 February 2026, roughly 17-20 million barrels per day (b/d) of crude and products crossed Hormuz.
Recent estimates from Kpler put September and early October flows at roughly 9-14 million b/d, depending on methodology. Reuters, citing Kpler, reported a seven-day average of 14.2 million b/d on 26 September, about 80% of prewar levels.
The strait is not closed. So why hasn’t the price come down?
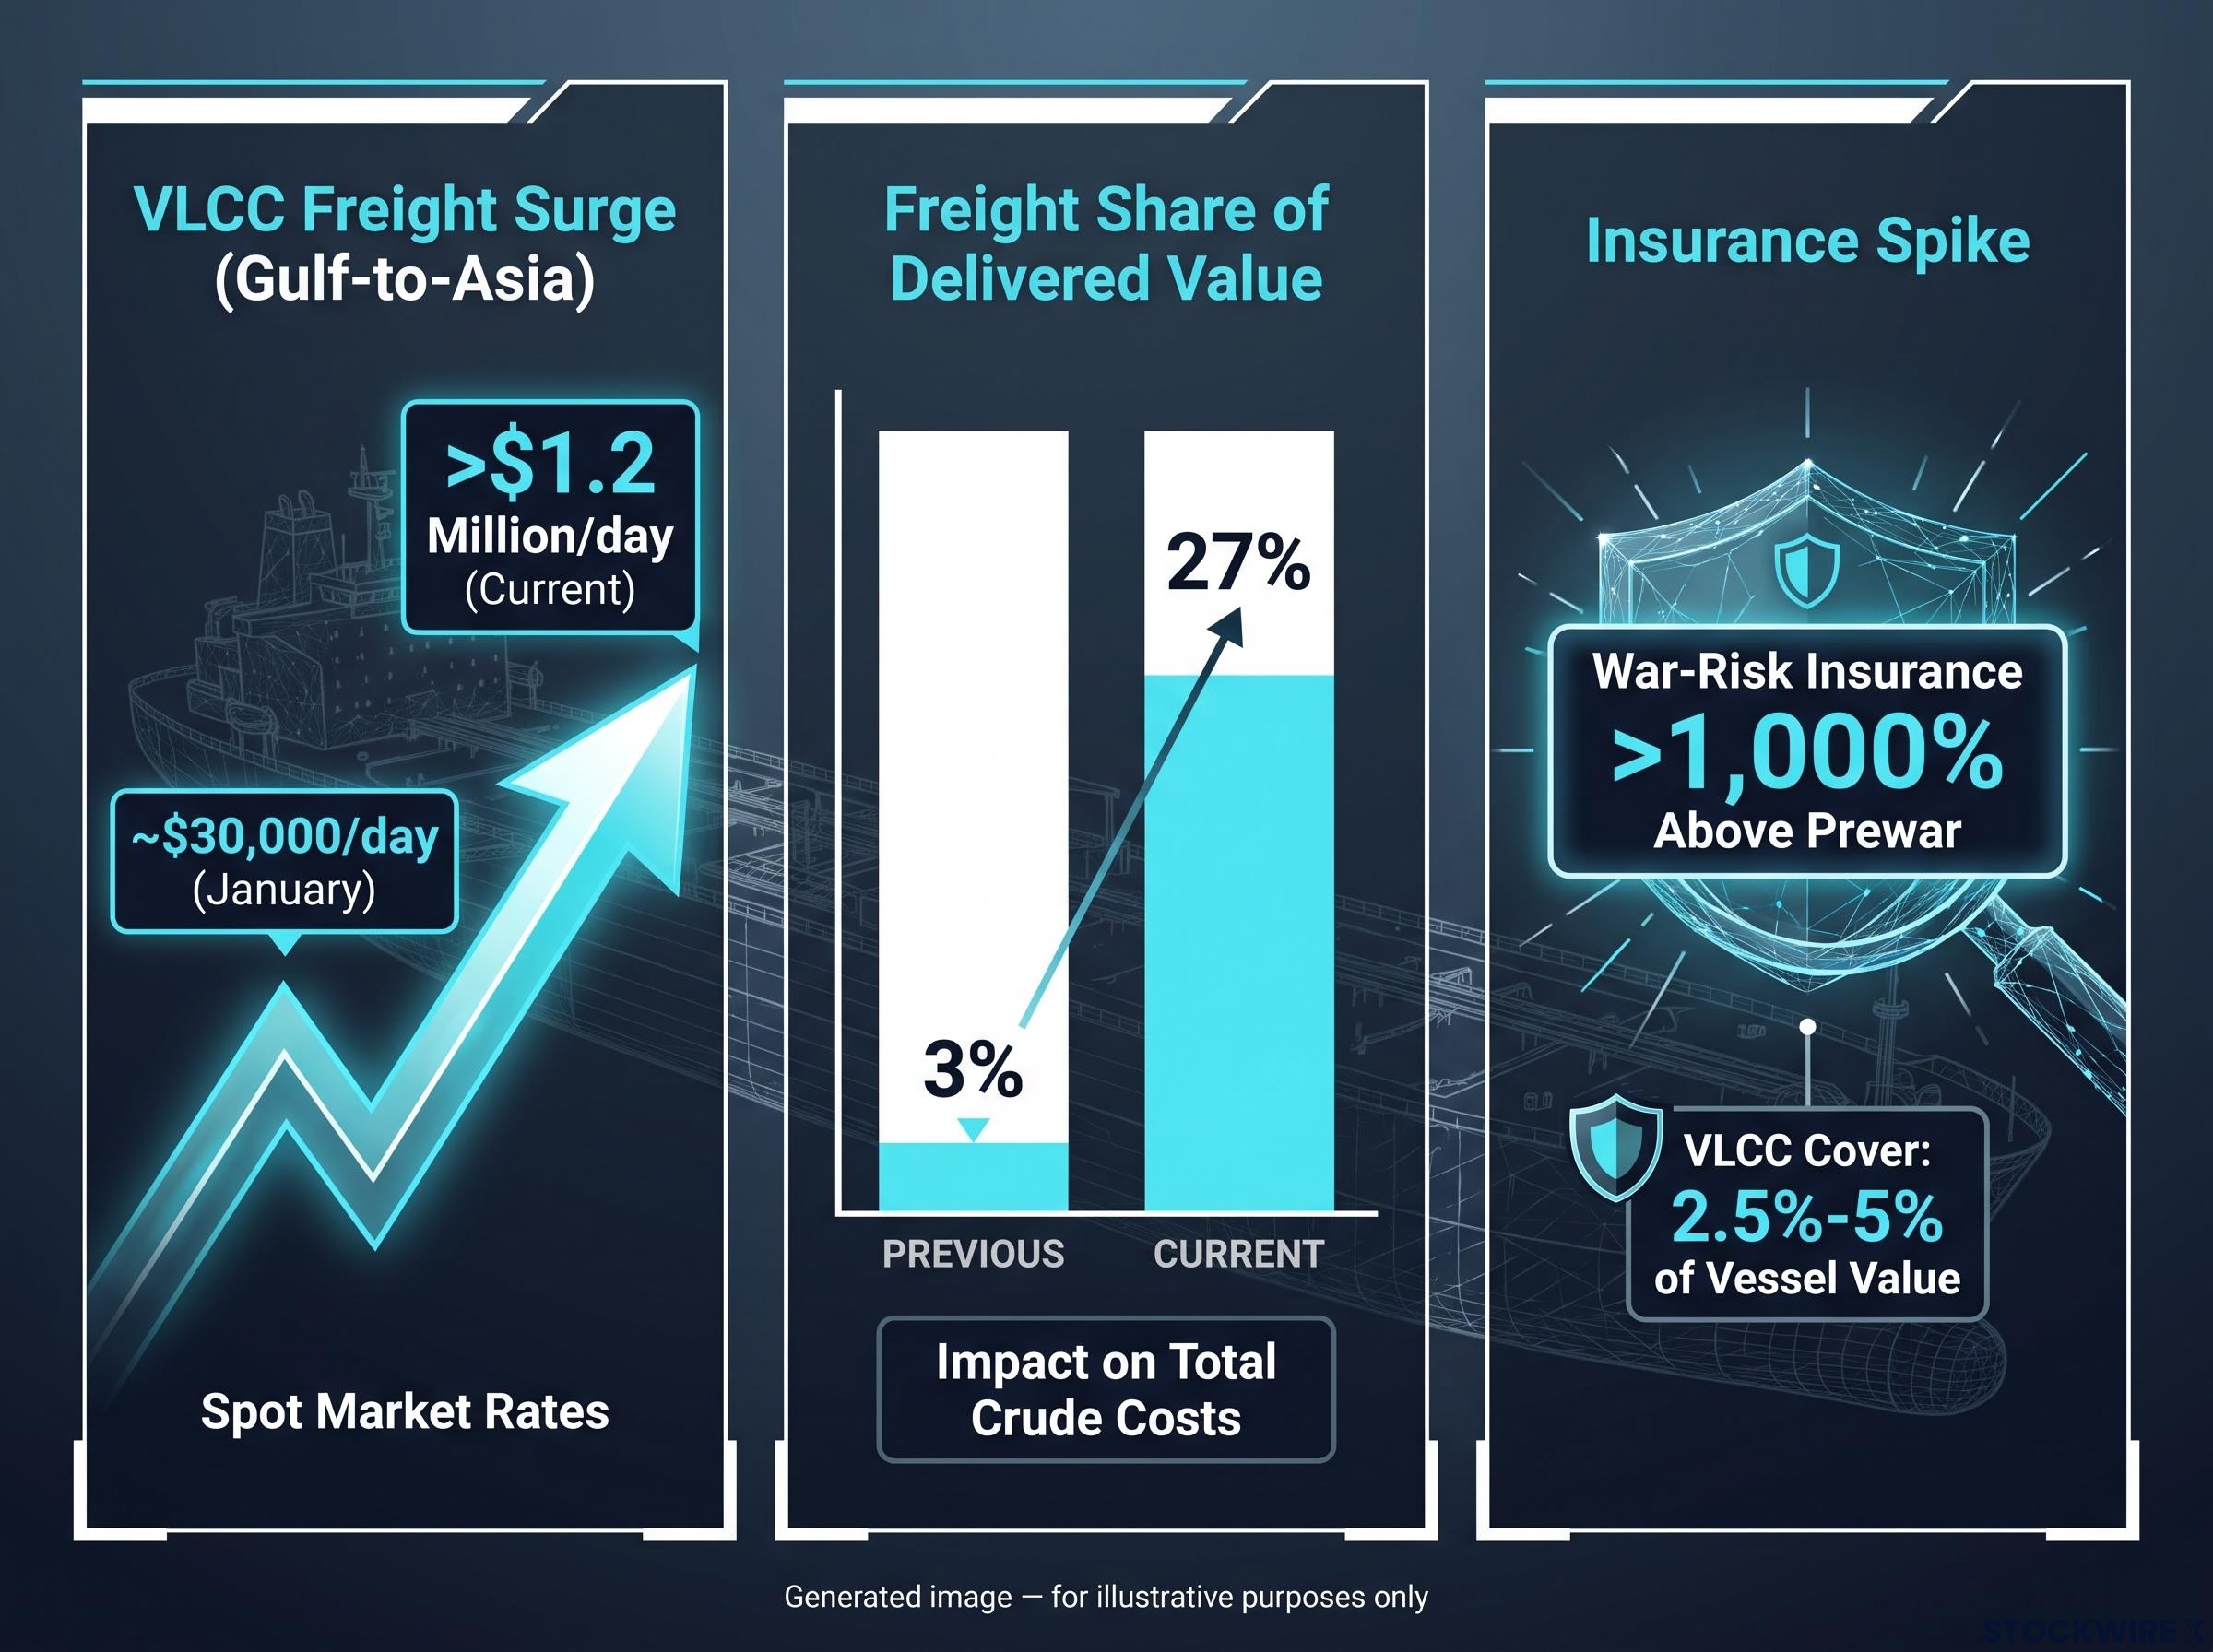
The answer sits in the shipping market. Reuters, citing Poten & Partners, reported that freight for a very large crude carrier (VLCC), the supertankers that haul around two million barrels each, topped $1.2 million per day on Gulf-to-Asia routes, against about $30,000 in January.
The delivery premium Freight has climbed from about 3% of delivered crude value to about 27% on some Gulf-to-Asia trades, according to Reuters citing Poten & Partners.
The extra cost builds up in four layers:
- Freight: scarce tankers and longer routes push daily charter rates to extreme levels.
- Transfers: cargoes often move through ship-to-ship (STS) transfers in the Gulf of Oman, which can require several vessels per shipment.
- Insurance: war-risk premiums are more than 1,000% above prewar levels, with VLCC cover reaching roughly 2.5%-5% of vessel value, according to S&P Global Platts.
- Delays: bypass pipelines and detours tie up ships for longer, shrinking the available fleet.
Flows versus costs
The squeeze reaches well beyond the Gulf. Reuters, citing Signal Maritime, reported that an Americas-to-Asia voyage now costs more than $80 million, or about $40 per barrel.
President Trump has posted that the Hormuz situation is normalising. Peter Berezin of BCA Research argues it is not normal in economic terms, and the freight data backs him. What this tells you is that a “reopening” headline does not lower the price your economy pays, because the cost now lives in the delivery chain rather than at the wellhead.
War-risk insurance premiums running at roughly 30 times normal levels, and maritime unions treating Hormuz as an active war zone, show why a declaration that the strait is open cannot by itself restore normal commercial shipping.
When big ASX news breaks, our subscribers know first
Why diesel, not crude, is the real pinch point
At the pump, the gap is plain. The US Energy Information Administration (EIA) put average gasoline at about $4.33 a gallon for the week to roughly 12 October, while diesel was reported near $6.28, a figure less firmly confirmed than the gasoline reading.
That gap matters more than the Brent number for most households. Diesel moves the trucks, trains and farm machinery that carry food and goods, so its price feeds directly into the cost of nearly everything you buy.
Refined-product shortages explain much of the decoupling: Gulf product flows run at only a quarter to a third of pre-conflict levels even as crude volumes approach prewar norms, which keeps wholesale diesel elevated.
What a crack spread tells you
A crack spread is the difference between the price of crude oil and the price of the refined products made from it. If crude costs $100 a barrel and the diesel produced from it sells for $195, the crack is $95.
A wide crack means refined products are scarce relative to crude. Secondary reporting on the International Energy Agency (IEA) put the diesel refining margin near $95 per barrel in September. BCA’s Berezin argues that cracks this high are already suppressing crude demand, which he reads as a negative growth signal.
Diesel is tighter than gasoline for specific reasons. Disruption at Middle Eastern and Russian refineries removes middle distillates (the diesel, heating oil and jet fuel cut of the barrel) disproportionately, and seasonal maintenance lands just before winter heating demand.
Ukrainian strikes reportedly took about 700,000 b/d of Russian capacity offline at 16 sites between January and May. Russia’s reported diesel export ban and China’s restrained product exports have tightened supply further.
| Metric | Latest reading | Source | What it signals |
|---|---|---|---|
| Global diesel/gasoil supply vs year earlier | -1.5M b/d (Q2), -1.7M b/d (Q3) | IEA, 14 October | Shortfall widening, tightness expected into 2027 |
| Diesel refining margin | Near $95/bbl (September) | Secondary reporting on IEA | Product scarcity, not crude scarcity |
| US distillate stocks | About 9.8% below five-year average | S&P Global Platts | Limited buffer before winter |
| US retail diesel | About $6.28/gal | Reported EIA data (less firmly confirmed) | Cost pressure on freight and food |
EIA and Platts inventory figures cover different weeks and use different methods, so treat them as directional. Either way, US stock draws cannot continue indefinitely, and the diesel crack is the number to watch if you want an early read on your cost of living.
How can consumer sentiment sit at record lows while PMIs stay strong?
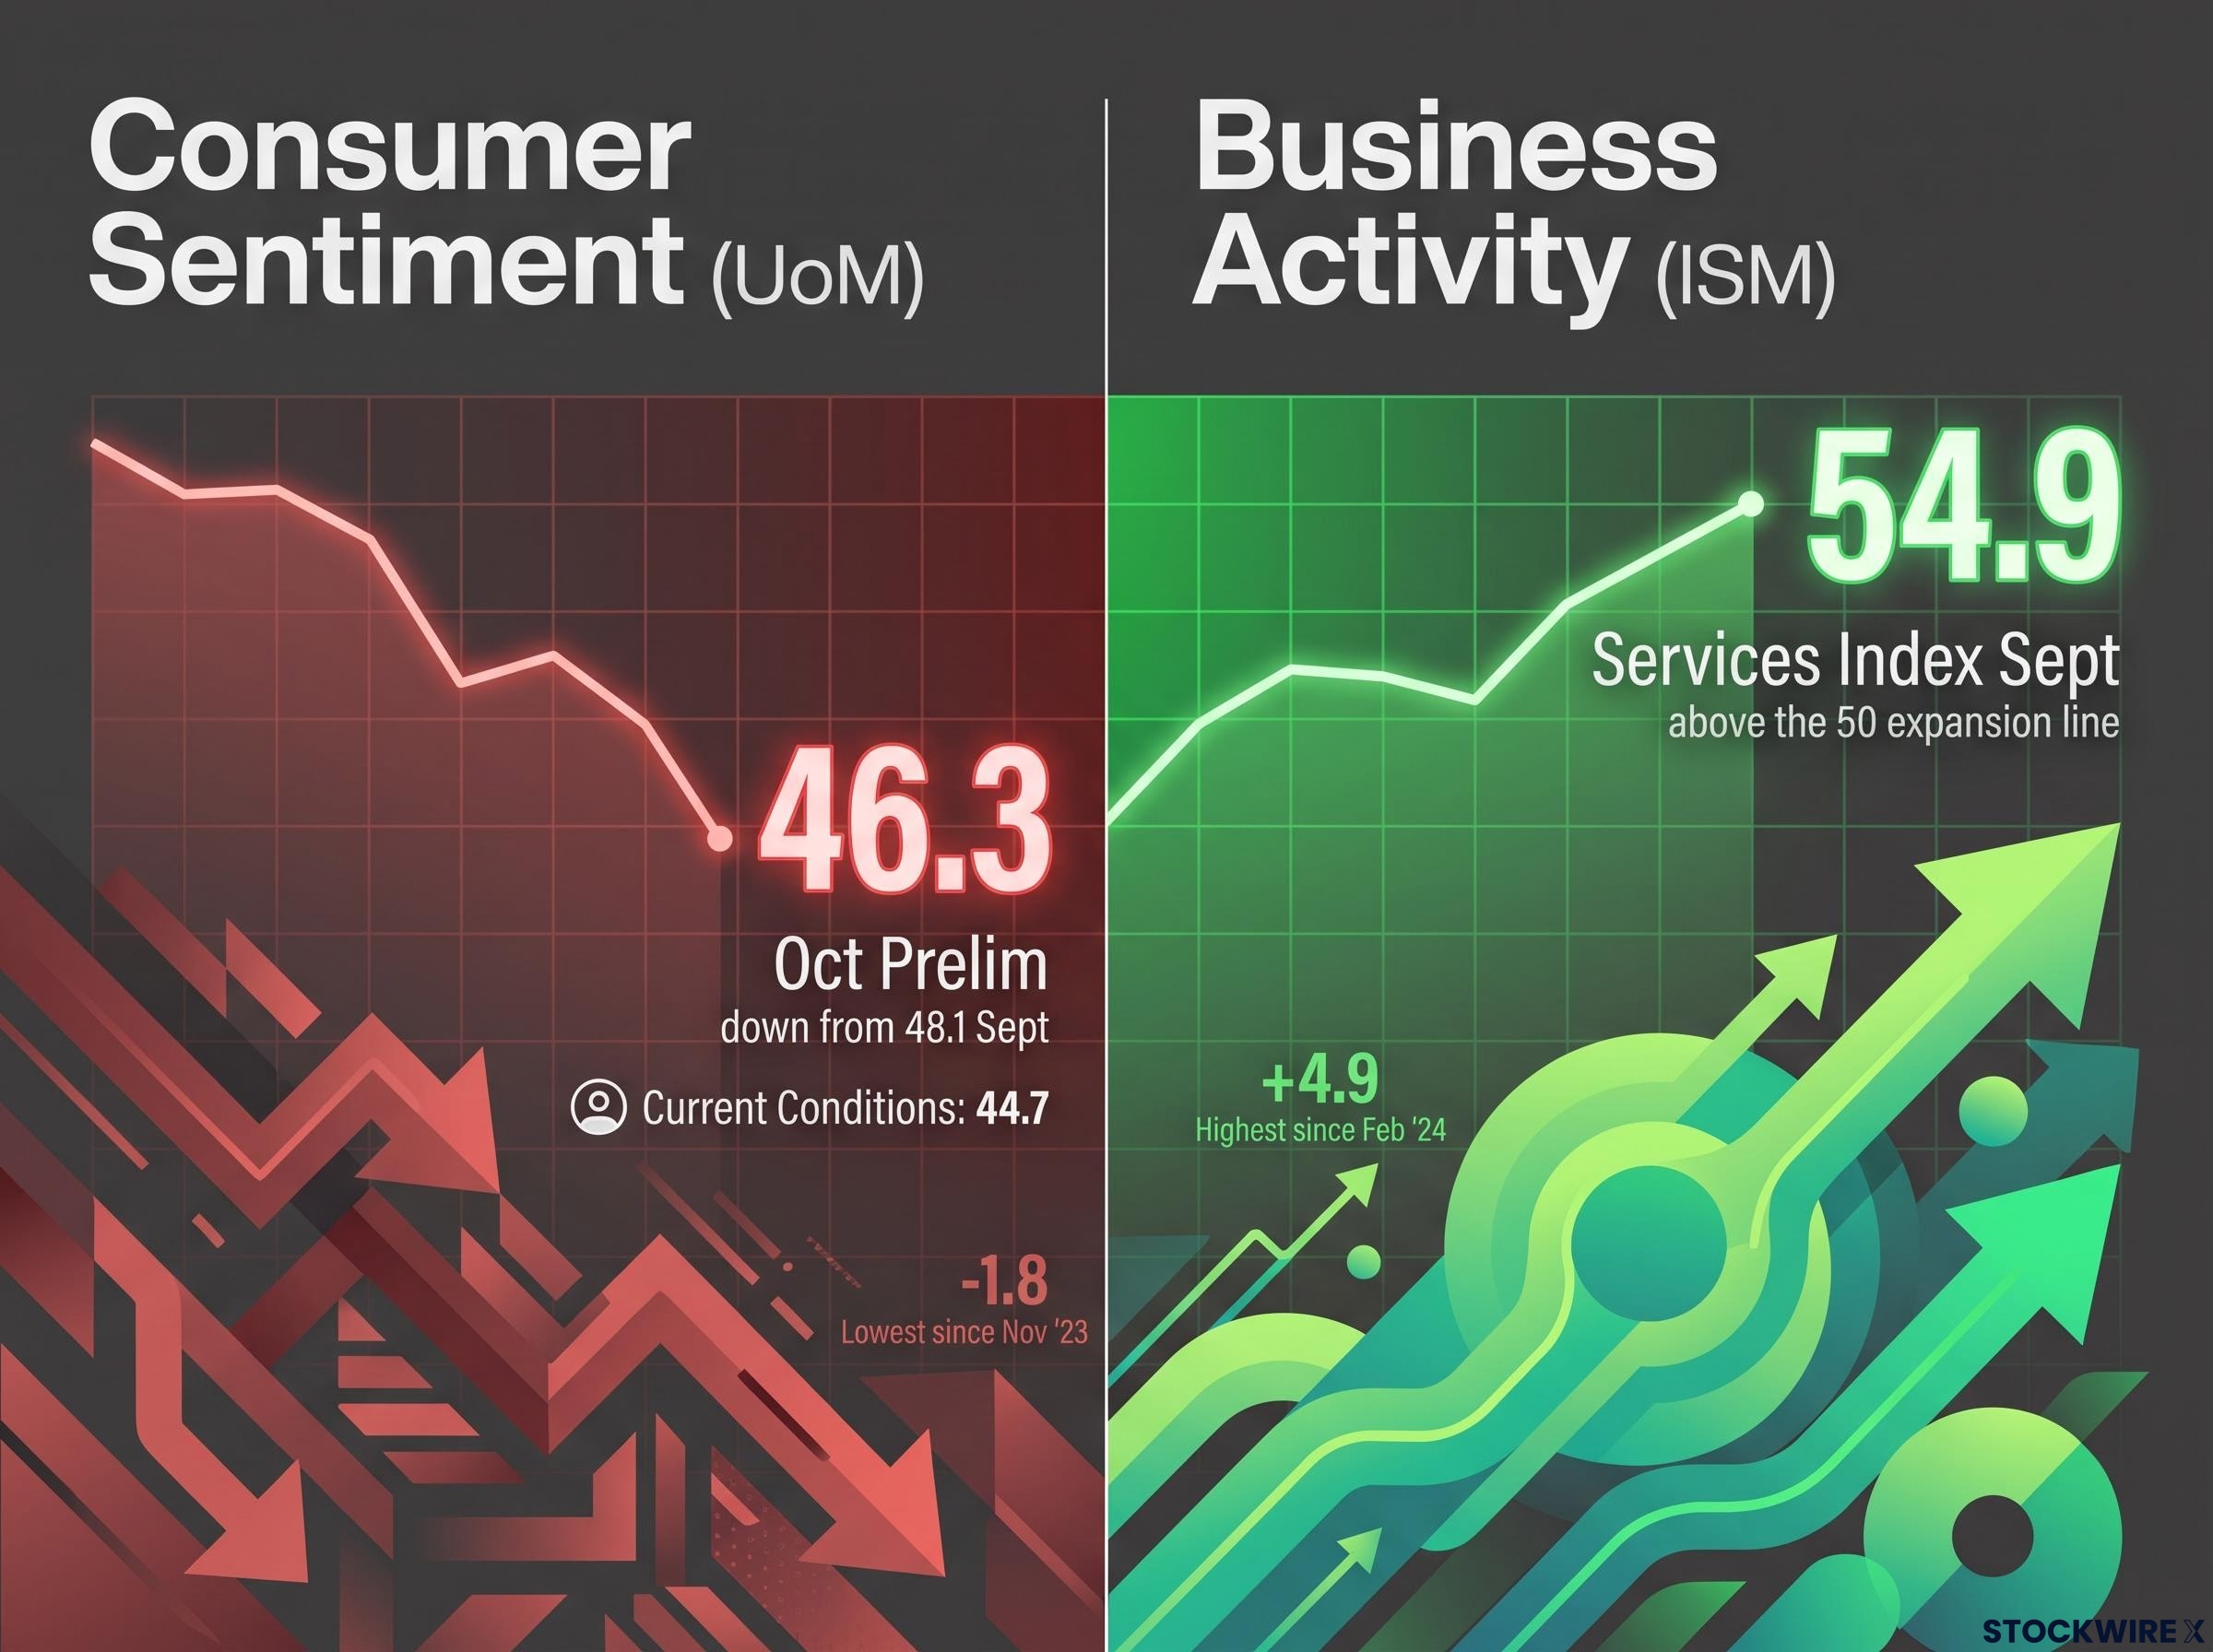
The two datasets look irreconcilable. The University of Michigan’s preliminary October sentiment reading fell to 46.3 from 48.1 in September, with current conditions at 44.7, reported by CNN as at or near an all-time low.
Meanwhile the Institute for Supply Management (ISM) services index printed 54.9 in September, well into expansion. The latest manufacturing purchasing managers’ index (PMI), a monthly survey of business activity, was not available at the time of writing.
BCA’s Berezin goes further on sentiment, suggesting confidence is worse than during COVID, 2008 or 2000. The resolution lies in who owns what.
- Flat real incomes: inflation-adjusted take-home pay has barely moved since the “Liberation Day” tariff announcement.
- Stalled home values: most households hold wealth in housing, and prices have stalled as mortgage rates climb.
- Concentrated equity gains: market strength sits in tech, while over half of stocks trade below their 200-day moving average.
- Uneven fuel exposure: affluent stockholders spend a smaller share of income on fuel, while lower-income households absorb food, transport and diesel-linked costs directly.
- Services are lighter on oil: service businesses use less energy than manufacturers, which helps services PMIs hold up.
| Data type | What it measures | Current reading | Limitation |
|---|---|---|---|
| Soft data (sentiment) | Household mood and expectations | 46.3 (October preliminary) | Can stay weak while spending continues |
| Hard data (PMIs, spending) | Actual business activity | ISM services 54.9 (September) | Weighted towards affluent demand; may lag a downturn |
Neither indicator is broken. Treat sentiment as a warning about lower-income households and spending as a read on wealthier ones, and you avoid both complacency from strong PMIs and panic from grim surveys.
Why $200 is the threshold, and what could bring relief sooner
The reassurance first. Berezin argues that oil matters less to the macro picture unless prices approach about $200.
The $200 line BCA Research ties a move towards $200 to a sustained 10% cut in global oil production. It is a scenario, not a law: the level at which oil would become the dominant drag on growth.
Why the shock is smaller than past ones
The 1973-74 and 1979-80 shocks hit economies far more dependent on oil. In 2022, the energy spike compounded post-pandemic stimulus.
The Federal Reserve Bank of Boston found that a comparable shock now adds about 1.5 percentage points to PCE inflation (the Fed’s preferred consumer price gauge), versus about 2.2 points before the mid-1980s, thanks to domestic US production and lower energy intensity. For a global yardstick, the IMF rule of thumb cited by Pictet Wealth Management holds that a sustained 30% oil rise can cut global GDP by up to 0.5 percentage points and add about 1.2 points to inflation.
Then the qualifications:
- Equity concentration: if narrow mega-cap gains reverse, the wealth cushion behind affluent spending thins quickly.
- Inventory draws: US stocks cannot keep falling indefinitely.
- Emerging-market importers: countries such as Bangladesh and the Philippines face larger real-income shocks through subsidies, currency constraints and transport costs.
- Red Sea risk: Reuters reported Houthi threats to Saudi exports moving through Bab el-Mandeb, more than 3 million b/d, though this remains unverified.
The read you should take: the economy’s buffer is affluent spending supported by equities, so a sharp market correction is a more immediate threat than another leg up in oil.
Relief catalysts and timing
Ranked from most to least likely to move prices near term:
- A durable Iran security deal that cuts insurance premiums.
- A return to ordinary Hormuz traffic, ending repeated STS transfers.
- Restarts at Middle Eastern and Russian refineries, especially diesel units.
- An easing of Russia’s diesel export restrictions or an end to strikes on its energy sites.
- Higher Chinese product exports.
- Demand destruction.
- Strategic stock releases.
BCA describes the conflict as an unstable “kinetic equilibrium” likely to simmer for months, and expects no major relief this year, with possible improvement next year. These statements are speculative and subject to change based on market developments.
The Hormuz risk premium is expected to decompress slowly even under a best-case resolution, with the IEA projecting a two-year supply chain recovery, which supports BCA’s view that major relief is unlikely this year.
What this split economy needs to stay intact
The resilience has clear sources: partial rather than total flow disruption, wealthy households still spending, and services that run on less oil. The price has clear sources too: freight, insurance and diesel bottlenecks that inflate every delivered barrel.
Three variables will tell you which side wins:
- Diesel cracks and refinery restarts, the fastest route to lower living costs.
- Equity breadth, because a correction would strip away the spending cushion.
- Iran-related insurance premiums, the cleanest signal that delivery costs are easing.
Treat oil as a slow-building pressure on lower-income households and energy-heavy businesses rather than an imminent trigger. The decision point arrives if breadth weakens while cracks stay wide.
This article is for informational purposes only and should not be considered financial advice. Investors should conduct their own research and consult with financial professionals before making investment decisions. Past performance does not guarantee future results. Financial projections are subject to market conditions and various risk factors.






