BOQ Share Price Discount: What NIM, ROE and CET1 Actually Show
2 hrs ago

Nvidia trades at roughly 39% below its average analyst price target. Broadcom trades at roughly 11% below its own. Both carry Strong Buy consensus ratings from Wall Street, and both are identified by Zacks as top earnings growers for 2026. Yet the two companies represent fundamentally different bets on how AI infrastructure spending will flow over the next two years.
As of early May 2026, Broadcom has posted 106% year-over-year AI chip revenue growth in Q1 FY2026, while Nvidia CEO Jensen Huang has projected at least $1 trillion in combined Blackwell and Rubin revenue by end-2027. The comparison is live, consequential, and requires more than a headline-level reading. What follows walks through the architecture divide, the current financials, the valuation spread, what analysts are actually saying, the risks that could break each thesis, and a framework for matching each stock to a specific investor profile.
The investment case for each company starts with a structural question: how should AI compute be delivered at scale? Nvidia and Broadcom have arrived at opposite answers, and the divergence shapes everything from margin profiles to customer concentration.
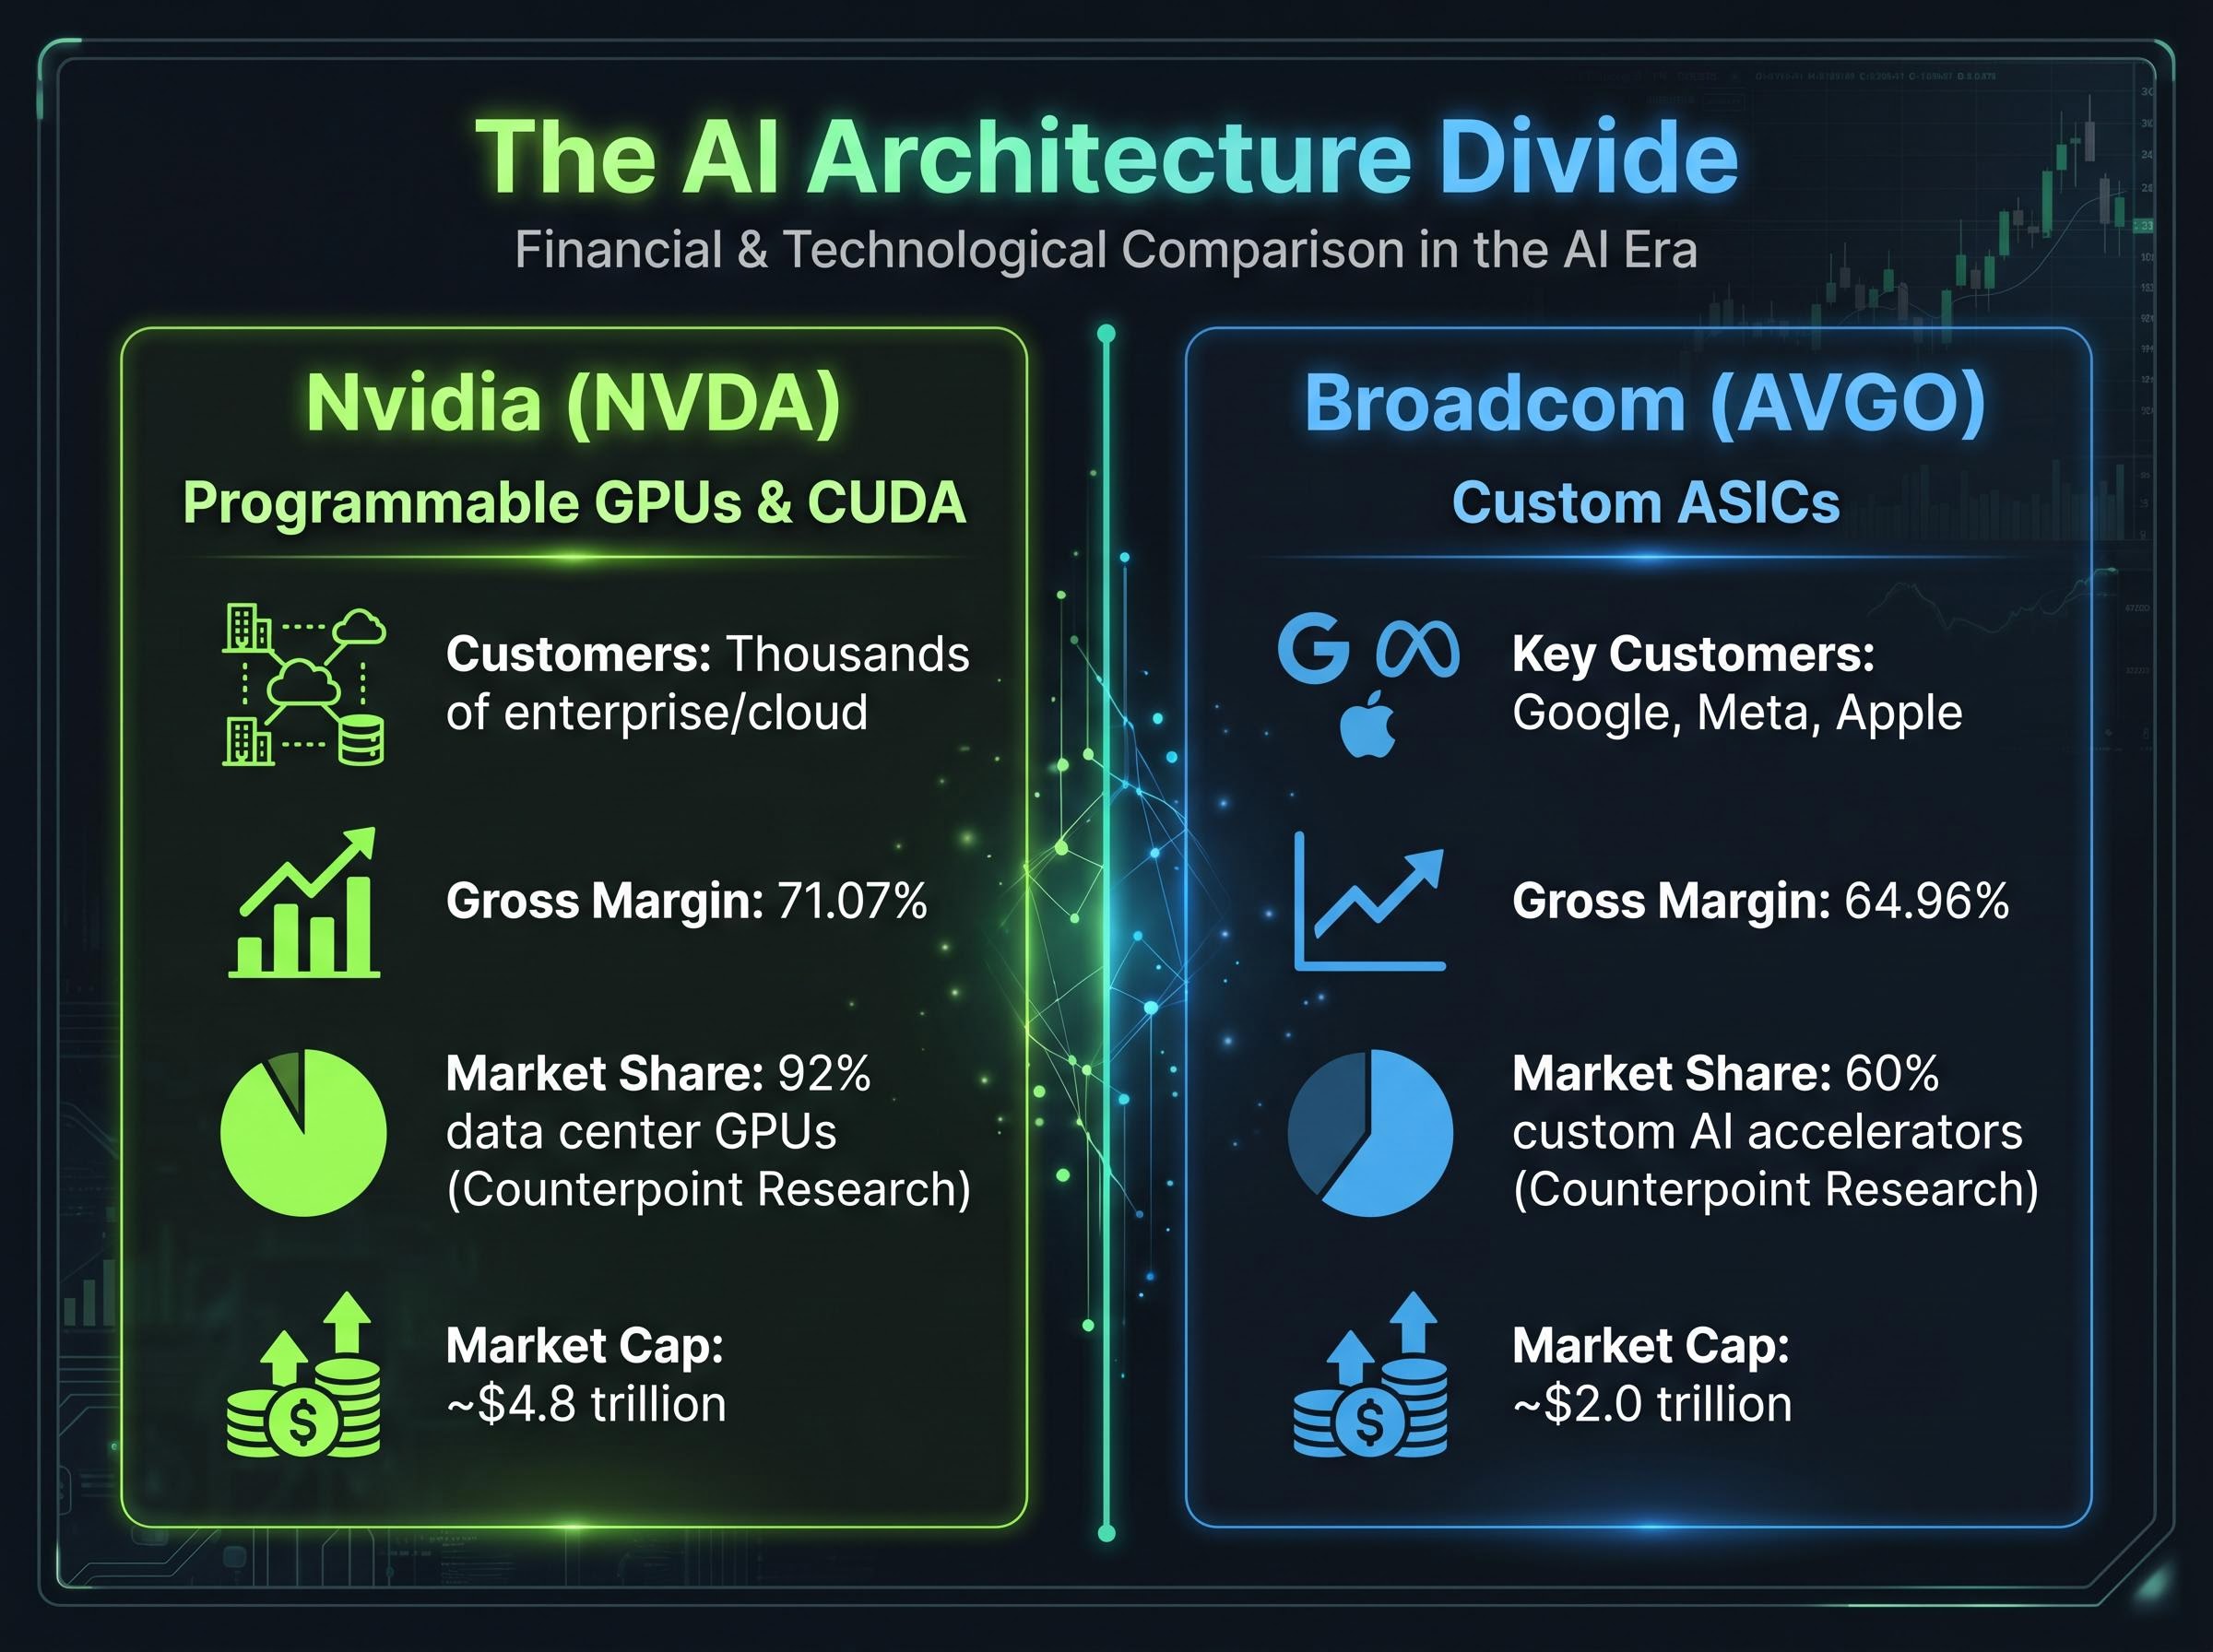
Nvidia builds programmable GPU accelerators optimised for flexibility across both training and inference workloads, unified by the CUDA software ecosystem. CUDA functions as the established AI infrastructure standard, cited by Raymond James and New Street analysts as a structural reason consensus estimates may be conservative. Application developers, AI frameworks, and enterprise tooling are all standardised around it, creating switching costs that extend well beyond the chip itself. Nvidia commands a market capitalisation of approximately $4.8 trillion.
Broadcom takes the opposite approach. The company designs custom application-specific integrated circuits (ASICs), chips engineered for individual hyperscaler clients such as Google, Meta, and Apple, trading flexibility for efficiency and lower total cost at scale. Broadcom holds approximately 60% market share in custom AI accelerators, according to Counterpoint Research, and commands a market capitalisation of approximately $2.0 trillion. CEO Hock Tan has cited growing agentic and generative AI adoption as sustaining demand for this model.
The investor implication breaks down across four dimensions:
GPU exposure is a bet on the breadth of AI infrastructure demand. ASIC exposure is a bet on the depth of hyperscaler customisation. Every data point that follows lands differently depending on which side of that divide an investor sits.
Both companies reported strong recent quarters, and the numbers reveal two distinct growth profiles rather than a single AI narrative.
Nvidia’s Q4 FY2026 results (ended 25 January 2026) showed GAAP earnings per share of $1.76, up 35% year over year, with adjusted EPS of $1.62. The headline forward signal came from Jensen Huang’s projection of at least $1 trillion in combined Blackwell and Rubin revenue by end-2027, a figure that Raymond James and New Street both cite as grounded in inference demand running ahead of schedule.
Forward-looking signal: Jensen Huang has projected at least $1 trillion in combined Blackwell and Rubin architecture revenue by end-2027. Analysts at Raymond James view current consensus estimates as potentially conservative, with inference demand catalysts arriving ahead of schedule.
Broadcom’s Q1 FY2026 delivered total revenue up 29% year over year, with AI chip revenue surging 106% year over year. Non-GAAP diluted EPS came in at approximately $2.10, up roughly 30% year over year.
Both companies were identified by Zacks as top earnings growers for 2026 driven by AI demand. This is not a one-winner comparison.
| Metric | Nvidia (NVDA) | Broadcom (AVGO) |
|---|---|---|
| Latest EPS growth (YoY) | 35% (GAAP) | ~30% (non-GAAP) |
| AI revenue growth (YoY) | Not separately disclosed | 106% |
| Gross margin | 71.07% | 64.96% |
| Market cap | ~$4.8 trillion | ~$2.0 trillion |
Forward price-to-earnings multiples are often read as a simple cheap-versus-expensive verdict. In this case, the spread between the two stocks reveals something more specific: what each price already assumes about growth, and how much room remains if those assumptions prove correct.
Nvidia trades at a forward P/E of approximately 24.45-31.55. Broadcom trades at approximately 33.00-37.88. The instinct is to read the lower multiple as cheaper, but the context matters. Nvidia’s larger revenue base dilutes its per-unit growth rate, compressing the multiple even as absolute dollar growth remains enormous. Broadcom’s premium reflects concentrated growth expectations from a narrower custom-chip market, where a single hyperscaler contract can move the revenue trajectory materially.
The price-to-target spread sharpens the picture. Nvidia trades at approximately $198.48 against an average analyst target of $274.38, implying roughly 39% upside. Broadcom trades at approximately $416.50 against an average target of $465.55, implying roughly 11-12% upside. The dispersion in Broadcom’s analyst targets is itself a signal: the high target sits at $630, the low at $314, a range wide enough to reflect genuine disagreement about ASIC trajectory.
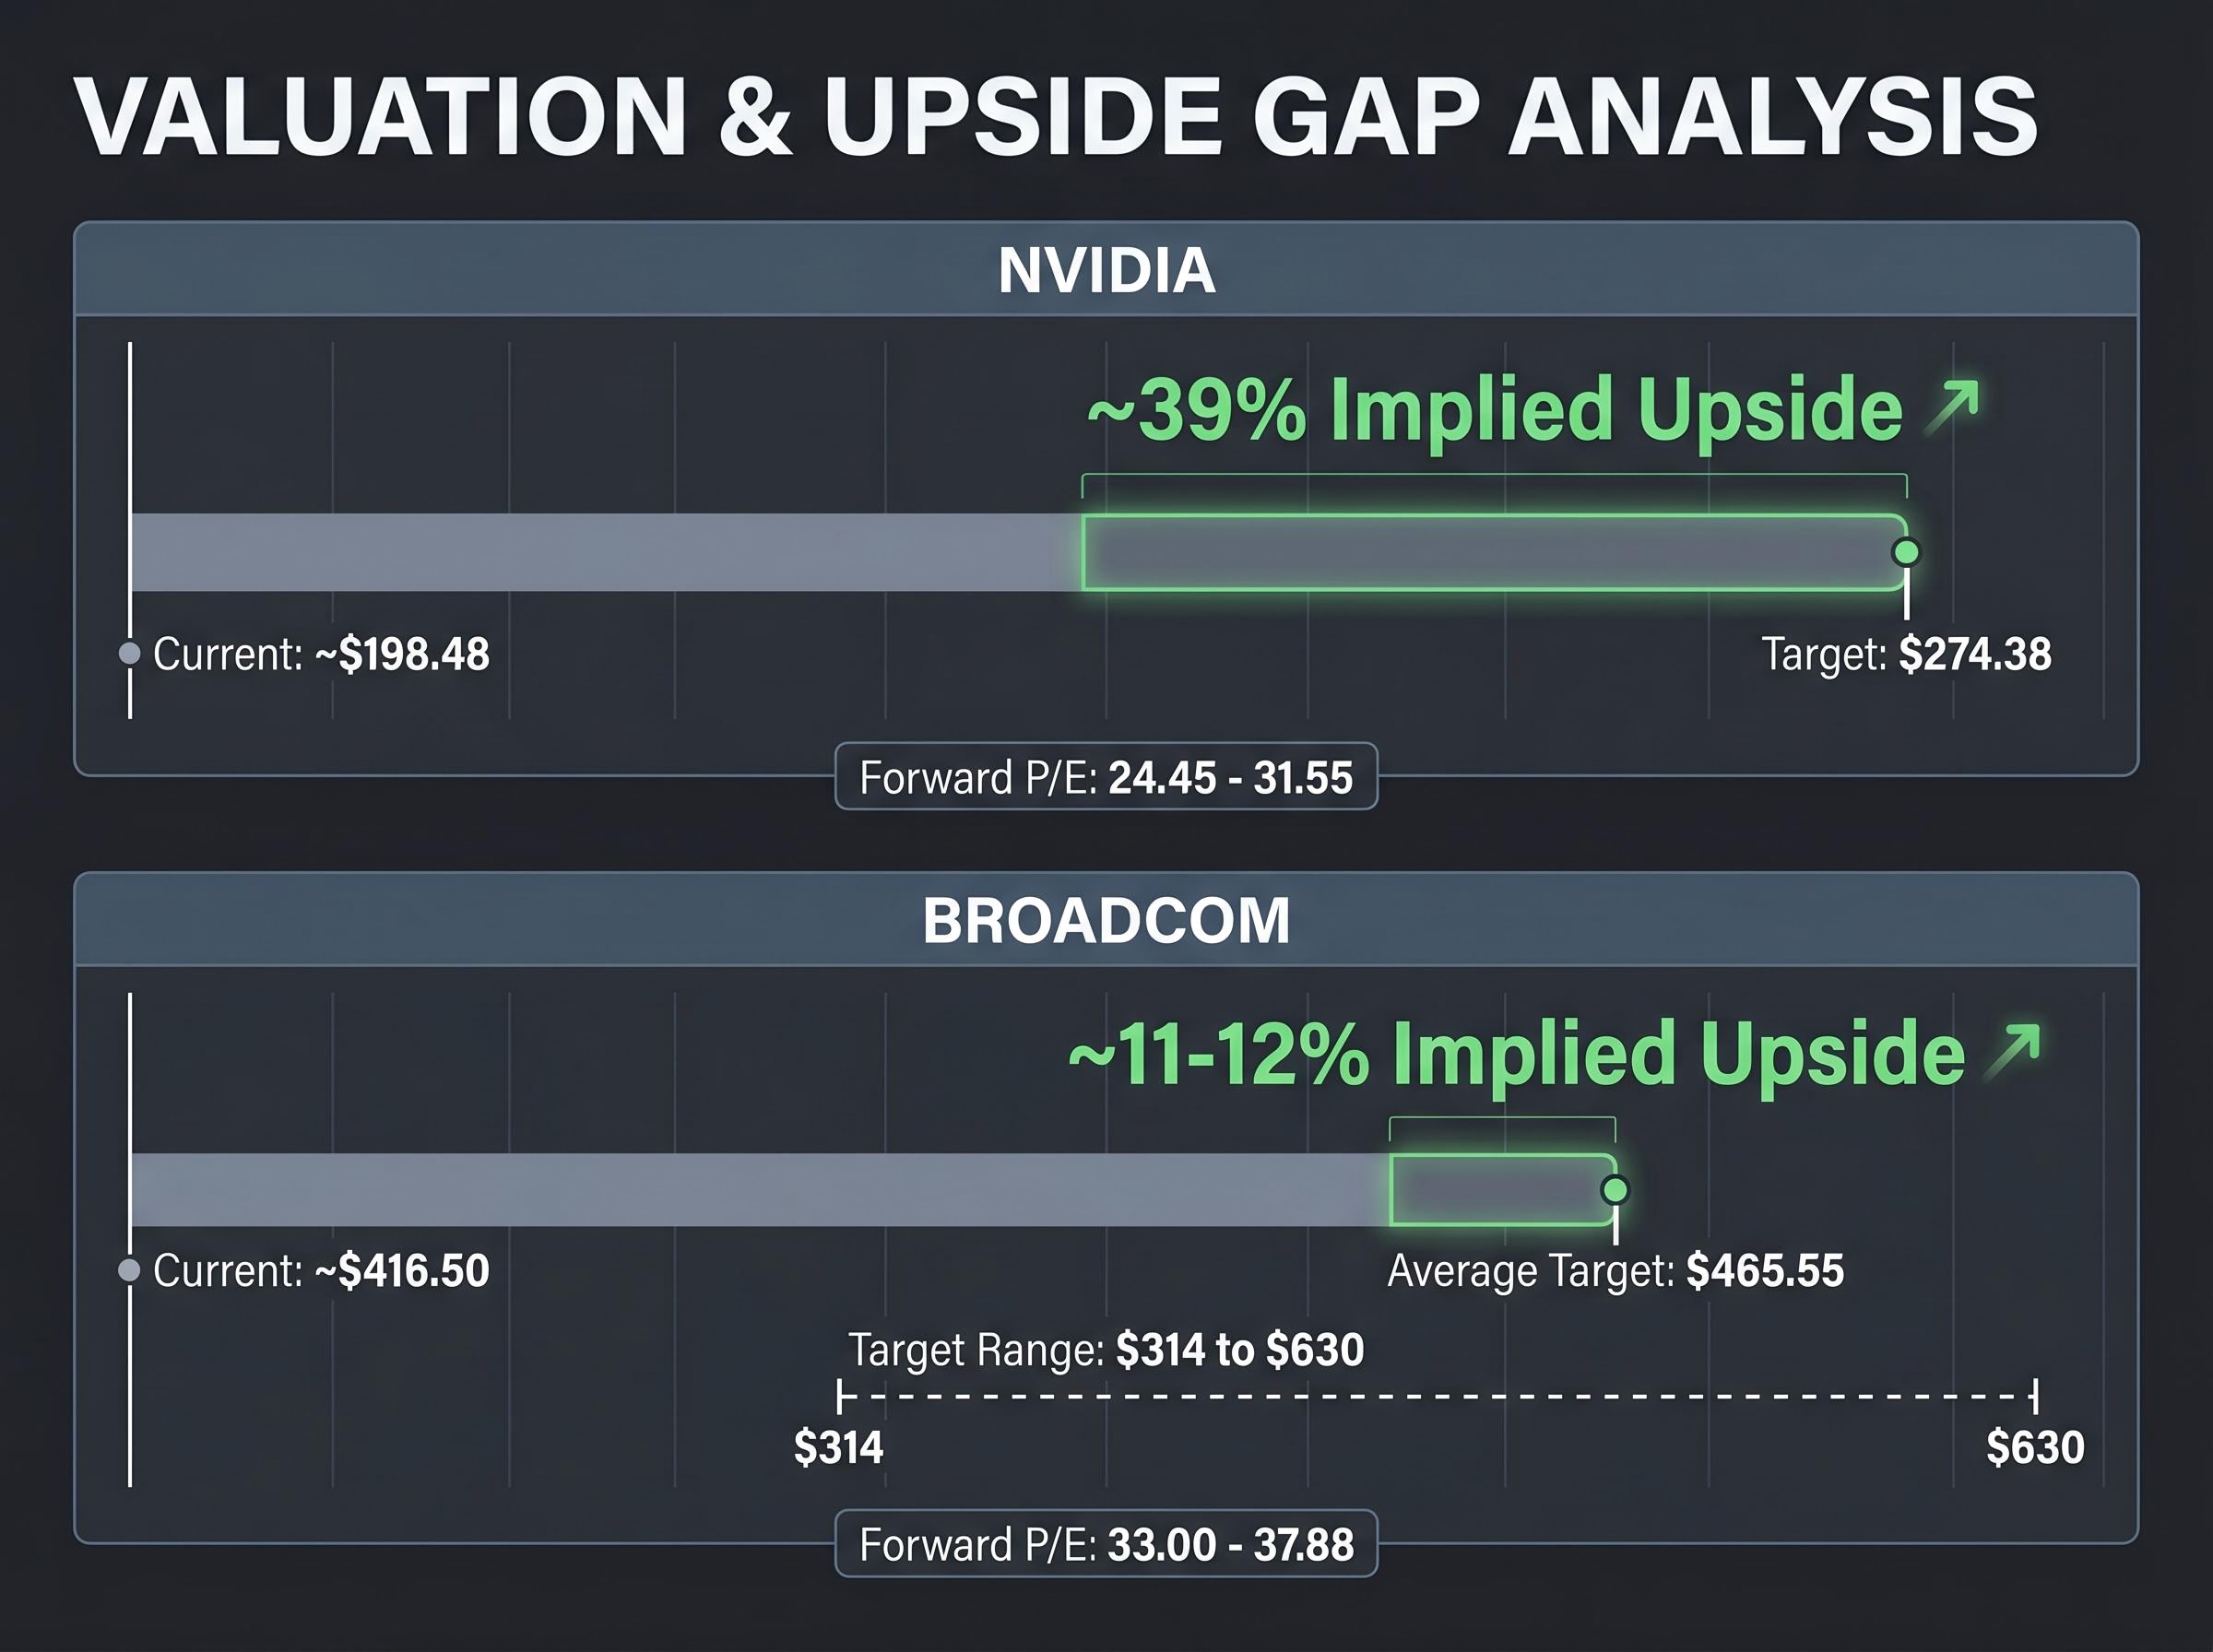
| Metric | Nvidia (NVDA) | Broadcom (AVGO) |
|---|---|---|
| Current price | ~$198.48 | ~$416.50 |
| Average analyst target | $274.38 | $465.55 |
| Implied upside | ~39% | ~11-12% |
| Forward P/E range | 24.45-31.55 | 33.00-37.88 |
| Analyst consensus | Strong Buy (39 ratings) | Strong Buy (29 Buys, 2 Holds) |
Three inferences stand out from this valuation gap:
The consensus view on both stocks is bullish, but the distribution of conviction, and the identity of the dissenters, tells a more nuanced story.
S&P Global survey data from April 2026 shows 56 out of 59 analysts assigning Nvidia a Buy or Strong Buy rating. For Broadcom, 44 out of 47 analysts rated the stock Buy or Strong Buy. The three most consequential recent analyst actions shape the current positioning:
New Street’s Pierre Ferragu has described retail sentiment around Nvidia’s guidance as reflecting a “misplaced lack of enthusiasm,” suggesting the growth trajectory may be materially underappreciated by non-institutional investors.
The dissenting view deserves specific attention. Seaport Research analyst Jay Goldberg maintains a Sell rating on Nvidia with a $140 price target, citing competitive pressures from custom silicon. His firm’s simultaneous downgrade of Broadcom to Neutral creates a structurally consistent position: that AI industry growth may be approaching limits that constrain both architectures, even if ASICs increasingly pressure GPU economics. It remains a minority view, but one with internal coherence worth monitoring.
Both stocks carry Strong Buy consensus ratings, but the specific failure modes for each thesis differ in character and timing.
The analyst target dispersion on Broadcom ($314 to $630) is the widest in this comparison set, reflecting genuine disagreement about whether ASIC demand is a secular shift or a cyclical surge within the current AI buildout phase.
Five sections of data, valuation, and analyst positioning converge on a framework rather than a single answer.
Nvidia is the higher-upside, lower-current-multiple option. It suits investors seeking broad AI infrastructure exposure with meaningful price-to-target room (approximately 39% to consensus), who accept the risk that GPU competition from ASICs and in-house hyperscaler silicon could accelerate. A Strong Buy consensus from 39 analysts and the $1 trillion Blackwell and Rubin revenue projection underpin the bull case.
Broadcom is the lower-upside, higher-multiple option. It suits investors who want exposure to the efficiency-driven ASIC trend and are comfortable paying a premium for demonstrated 106% AI revenue growth, accepting that narrower upside to target (approximately 11-12%) leaves less margin for error. Broadcom also offers a dividend yield of 0.60%, a modest but relevant differentiator for income-oriented portfolios.
| Investor Profile | Preferred Fit | Key Upside Driver | Key Risk to Monitor |
|---|---|---|---|
| Growth-focused | NVDA | 39% upside to target; $1T revenue projection | ASIC and in-house silicon share erosion |
| Value-conscious | NVDA | Lower forward P/E (24-31x) vs. AVGO | Seaport’s $140 bear case |
| Income-supplementing | AVGO | 0.60% dividend yield; stable hyperscaler contracts | Customer concentration risk |
| Broad AI diversification | Both | GPU + ASIC capture breadth of AI spend | AI industry growth ceiling (Seaport thesis) |
The case for holding both is straightforward:
Nvidia and Broadcom are not competing for the same investor dollar in the same way. They represent structurally different exposures to AI infrastructure spending, and the right allocation depends on what an investor is trying to achieve.
Three findings from this analysis carry the most weight. First, Nvidia’s wider price-to-target gap (39% versus 11-12%) and $1 trillion forward revenue narrative offer more re-rating room, but that room exists partly because the market has not yet fully priced in the inference demand acceleration that Raymond James and New Street see arriving. Second, Broadcom’s 106% AI chip revenue growth and 60% custom accelerator market share demonstrate that the ASIC model is capturing real hyperscaler spend at scale, even as its premium valuation leaves less cushion. Third, the consensus Wall Street view holds that both can win in an AI infrastructure supercycle, with Seaport Research the primary dissenting voice arguing for structural limits.
The two near-term data points most likely to shift this comparison are the Vera Rubin architecture launch timeline and Broadcom’s next earnings report. Both bear watching through the second half of 2026.
This article is for informational purposes only and should not be considered financial advice. Investors should conduct their own research and consult with financial professionals before making investment decisions. Past performance does not guarantee future results. Financial projections are subject to market conditions and various risk factors.
Nvidia builds programmable GPU accelerators unified by the CUDA software ecosystem, serving a broad range of AI workloads across thousands of customers, while Broadcom designs custom ASICs engineered for specific hyperscaler clients like Google, Meta, and Apple, trading flexibility for efficiency at scale.
As of early May 2026, Nvidia trades approximately 39% below its average analyst price target of $274.38, while Broadcom trades roughly 11-12% below its average target of $465.55, giving Nvidia a significantly wider margin of safety relative to consensus estimates.
Broadcom reported 106% year-over-year AI chip revenue growth in Q1 FY2026, alongside total revenue growth of 29% year over year and non-GAAP diluted EPS of approximately $2.10, up roughly 30% year over year.
Growth-focused and value-conscious investors may prefer Nvidia given its wider upside to target and lower forward P/E of 24-31x, while income-supplementing investors may favour Broadcom for its 0.60% dividend yield and stable hyperscaler contract base, though holding both captures exposure across GPU and ASIC architectures.
Broadcom's primary risks include customer concentration among a handful of hyperscalers such as Google, Meta, and Apple, a premium forward P/E of 33-38x that leaves little room for a growth slowdown, and a Seaport Research downgrade to Neutral citing potential limits to AI industry growth.