Two of Wall Street’s best-known strategists agree that artificial intelligence ends in a bubble. They disagree by about three years on where the clock is now. Jim Bianco says the AI boom looks like 1997-98. David Rosenberg says it looks like early 2000, months before the Nasdaq broke.
So the question of whether AI is a bubble is less useful than a sharper one: which year of the cycle are you living in?
That distinction has gained urgency in recent weeks. As of November 2026, capital spending plans, bond issuance and revenue forecasts have all escalated together. Get the era wrong, and you could mistake an early, volatile buildout for a late-stage peak, or the reverse.
This explainer gives you a way to test the current boom against the dot-com era yourself, using four measures: spending, revenue, financing and economy-wide growth. Each one points somewhere slightly different, and seeing how they diverge is the point.
Is the AI boom 1997 or 2000? Two views from the same data
Bianco and Rosenberg look at the same spending and the same share prices and land three years apart. Both accept the technology is real. They split over whether money and valuations have run ahead of what the technology can earn.
| Jim Bianco: 1997-98 | David Rosenberg: early 2000 |
|---|---|
| The technology is real and adoption is still expanding | Valuations are stretched and leverage is rising |
| A bubble can coexist with genuine productivity gains | The boom depends on ever-increasing spending |
| Corporate IT caution has throttled adoption and should ease | ChatGPT is about four years old; the internet was about two in 1997 |
Rosenberg also points to stress already visible in markets. In a recent week he cited, the median AI stock sat about 35% below its peak, and Google fell 12% in a single day.
The catch with any bubble call Rosenberg reminds investors that bubbles are recognised only after they pop.
The big institutions sit between the two camps. They focus less on the label and more on whether valuations and financing have outrun returns.
| Institution | Position |
|---|---|
| International Monetary Fund (IMF) | Investment and valuations could become comparable to the dot-com episode, but the rise in investment is smaller relative to GDP than in 1995-2000 |
| Bank for International Settlements (BIS) | Flags the shift from internal cash to bonds, leasing and loans; debt must match actual cash flows |
| Bank of England | Compares equity valuations with dot-com-era levels without calling AI definitively a bubble |
The split is clear. Bianco sees an earlier, still-developing infrastructure cycle; Rosenberg and the financial-stability bodies see valuations and financing ahead of returns. If you lean towards 1997-98, you are preparing for a long runway with volatility along the way. If you lean towards early 2000, the risk of a deep drawdown is much closer.
The Nasdaq 1997-2000 parallel holds up on the charts, but the size of the advance and the forward multiples are very different, which is why a correction today would likely work through different mechanics than the original collapse.
When big ASX news breaks, our subscribers know first
What is a capex bubble, and what did the dot-com bust actually destroy?
Capital expenditure, or capex, is money a company spends on long-lived physical assets such as buildings, servers and networks. A capex bubble forms when that spending races ahead of the revenue that can pay for it.
That definition matters because it separates two questions you might otherwise blur together. A technology can change the economy and still be a poor investment at the price you paid or the debt the builders took on.
The 2000-2002 bust shows how that gap closes:
- The Nasdaq was more than 60% below its March 2000 high by early 2002, according to the Federal Reserve. The commonly cited peak-to-trough fall is 78%; the difference comes from the endpoint used.
- WorldCom defaulted on $26 billion in July 2002, pushing corporate-bond defaults to a record.
- The high-yield default rate reached 30%, according to Rosenberg.
- About 30% of internet capex had been written down by the end of 2002.
The Cisco lesson Cisco was a real, profitable leader. It still suffered a severe repricing after 2000, because investors had paid a valuation its earnings could not justify.
Railways offer an older version of the same pattern. They changed how economies worked while destroying capital for many early investors.
Why overbuilt infrastructure can still be valuable later
About 95% of long-haul fibre sat “dark”, or unused, in 2001. That same fibre later carried broadband, cloud computing and mobile data. The original owners often could not survive their debt long enough to benefit.
For you, the lesson is blunt. Being right about the technology did not protect investors who overpaid or lent against it. The test is cash flow, not usefulness.
Cisco investors illustrate how a correct view on the technology can still produce a deep loss of capital, and your own index fund may carry the same concentrated exposure without you having sized it deliberately.
How big is the spending, and does the revenue exist to justify it?
Start with scale. McKinsey estimates $6.7 trillion of global data-centre investment through 2030, including $5.2 trillion for AI-capable facilities. Gartner, as reported by Fortune on 21 October 2026, puts cumulative AI capital spending at about $7.5 trillion across 2025-2030.
The four largest US hyperscalers (giant cloud operators) have guided to roughly $720-745 billion of combined capex in 2026, according to a TMT Finance compilation:
- Alphabet: $195-205 billion
- Amazon: about $220 billion
- Microsoft: about $175 billion (lease-accounting basis)
- Meta: $130-145 billion
Rosenberg adds that data-centre construction spending is up about 90% this year, while real AI capex is up 16%. Concrete and power are moving faster than the economy around them.
Now the revenue side, which is where the boom’s case gets tested.
| Gartner measure | Figure |
|---|---|
| Cumulative revenue needed to justify planned investment | $8.5 trillion |
| Forecast enterprise and consumer AI revenue | About $3.6 trillion |
| Shortfall | About $4.9 trillion |
| 12% return on invested capital reached | Not before end-2032 |
| Infrastructure potentially exposed to impairment by end-2030 | More than $3.5 trillion |
Gartner is not saying demand is absent. It is saying the buildout needs far more cumulative monetisation than current forecasts support. Rosenberg cites about $4 trillion of revenue and a write-down of about 40% of capex, slightly different from Gartner’s reported figures.
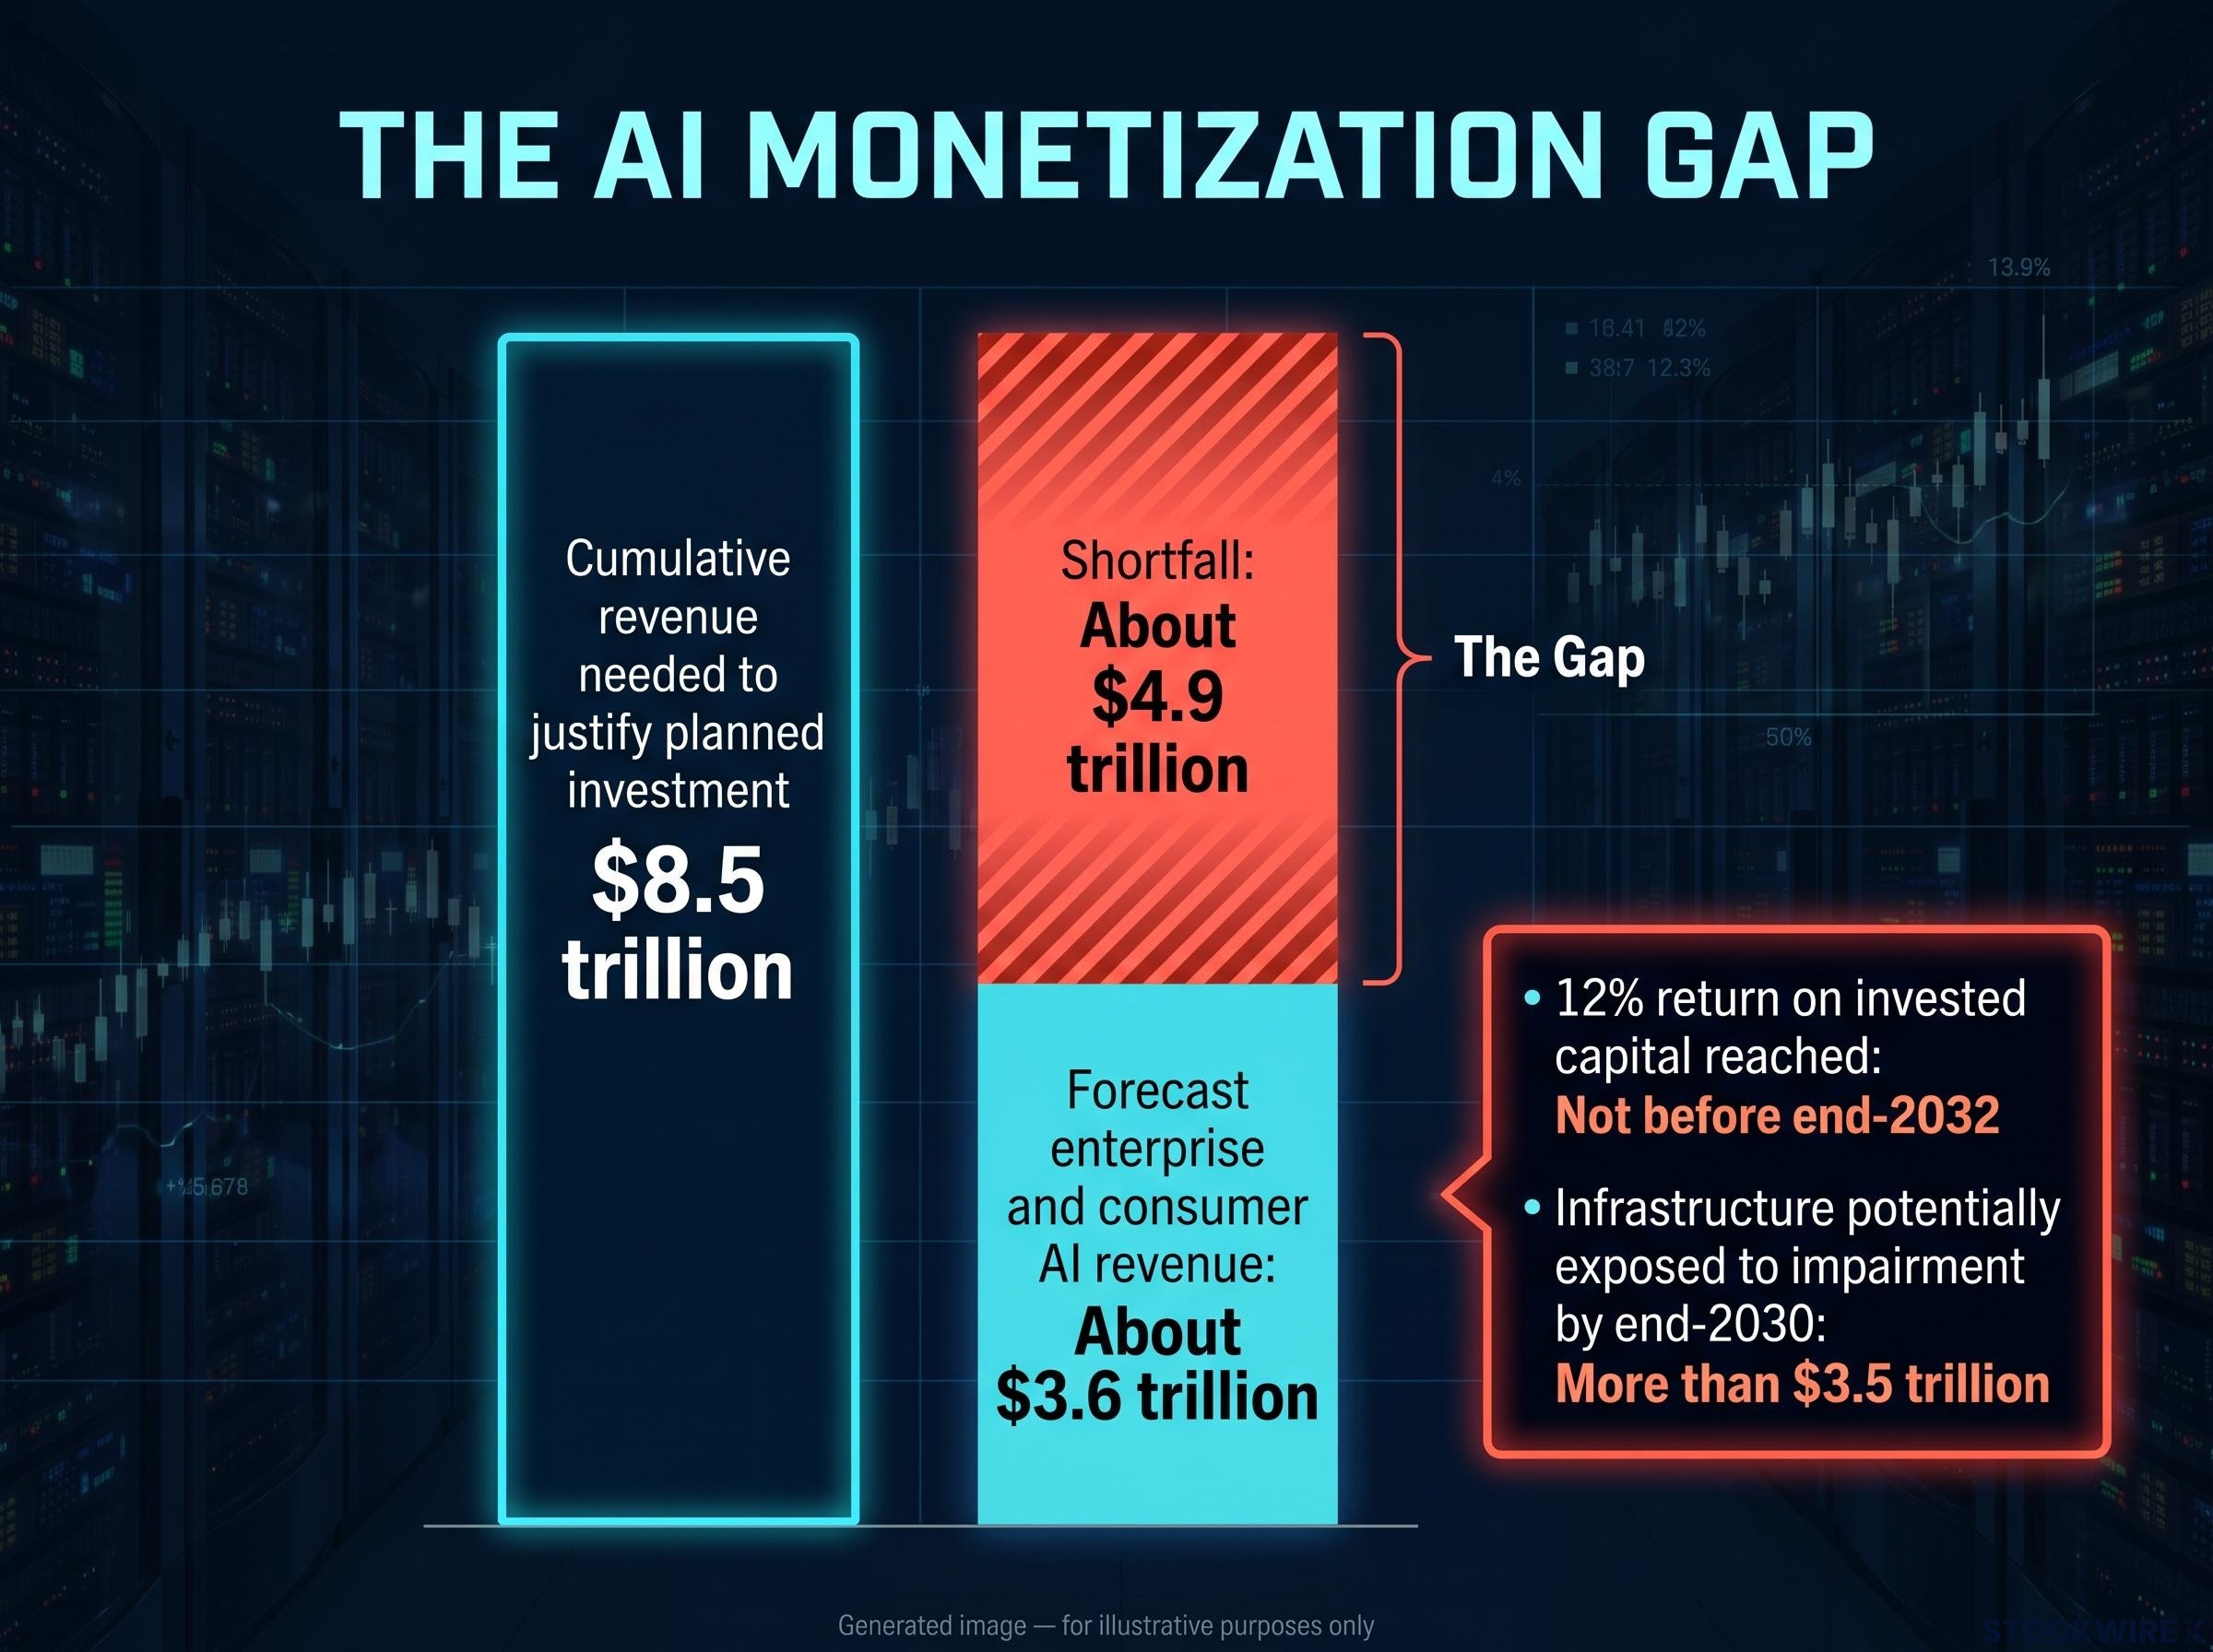
Gartner notes AI investments need $8.5 trillion in revenue, but with only about $3.6 trillion forecast, it leaves a shortfall of about $4.9 trillion.
Past performance does not guarantee future results. Financial projections are subject to market conditions and various risk factors.
The $10 trillion figure and why scope matters
Rosenberg refers to roughly $10 trillion of capex projected for 2026-2032. That number is widely repeated, but it could not be traced to a primary public source. The closest primary estimates are lower, and they measure different things: Gartner covers AI infrastructure, while McKinsey covers all data centres, AI and non-AI.
What this means for you: the boom’s justification rests on revenue that has not yet shown up in forecasts. Spending headlines tell you little; monetisation is the number to watch.
Who is paying for it? Debt, circular deals and the CoreWeave warning
The obvious question is whether the giants can afford this. The better question is how it is being paid for.
From cash flow to credit
The buildout began on the cash flows of Microsoft, Alphabet, Amazon and Meta. Its scale is now pushing into bonds, leases, private credit and special purpose vehicles (SPVs), which are separate legal entities set up to hold specific assets and debt. UBS describes an SPV buying about one million Google custom AI chips and leasing them to Anthropic, with the rent servicing the debt.
Goldman Sachs counts five AI bond deals totalling $67 billion since 29 October 2026, and $296 billion of hyperscaler debt issued in 2026. It forecasts $440 billion of hyperscaler debt plus $300 billion of project-level debt in 2027, and reported negative aggregate hyperscaler free cash flow in Q3 as capex exceeded operating cash flow. UBS estimates that counting off-balance-sheet commitments could lift hyperscaler obligations from about $800 billion to about $3.5 trillion.
Some of the money also moves in a loop:
- Chip companies invest in or finance AI labs.
- The labs sign long-term compute contracts.
- Clouds and neoclouds (specialised GPU-rental providers) borrow to buy chips and capacity.
- That spending becomes revenue for chip vendors and infrastructure owners.
- Those revenues support more investment and higher valuations.
The loop is not automatically uneconomic. It becomes dangerous only if capital keeps circulating without enough independent revenue from end users.
Parts of the AI ecosystem, from junk-rated bonds to special purpose vehicles, have been framed as moving into Minsky’s speculative financing stage, where debt service depends on future revenue rather than current cash flow.
What CoreWeave’s numbers show
CoreWeave combines everything Gartner warns about in neoclouds: heavy capex, expensive debt and reliance on a few customers. Its 2032 bond yielded above 16% against a 9.625% coupon, a gap that signals lenders now demand much more compensation.
| CoreWeave Q3 2026 (quarterly) | Figure |
|---|---|
| Revenue | $3.661B |
| GAAP operating income | $207M |
| Net interest expense | $846M (about four times operating income) |
| FY2026 capex guidance (annual) | $37-39B, about three times revenue |
These are quarterly figures, and CoreWeave also reports adjusted metrics. Claims that AI credit-default swaps have “tripled” could not be confirmed in aggregate; the visible stress sits in individual bonds like this one. Financing trouble surfaces first in the weakest borrowers, so a rising yield on a single neocloud bond is an early signal worth watching.
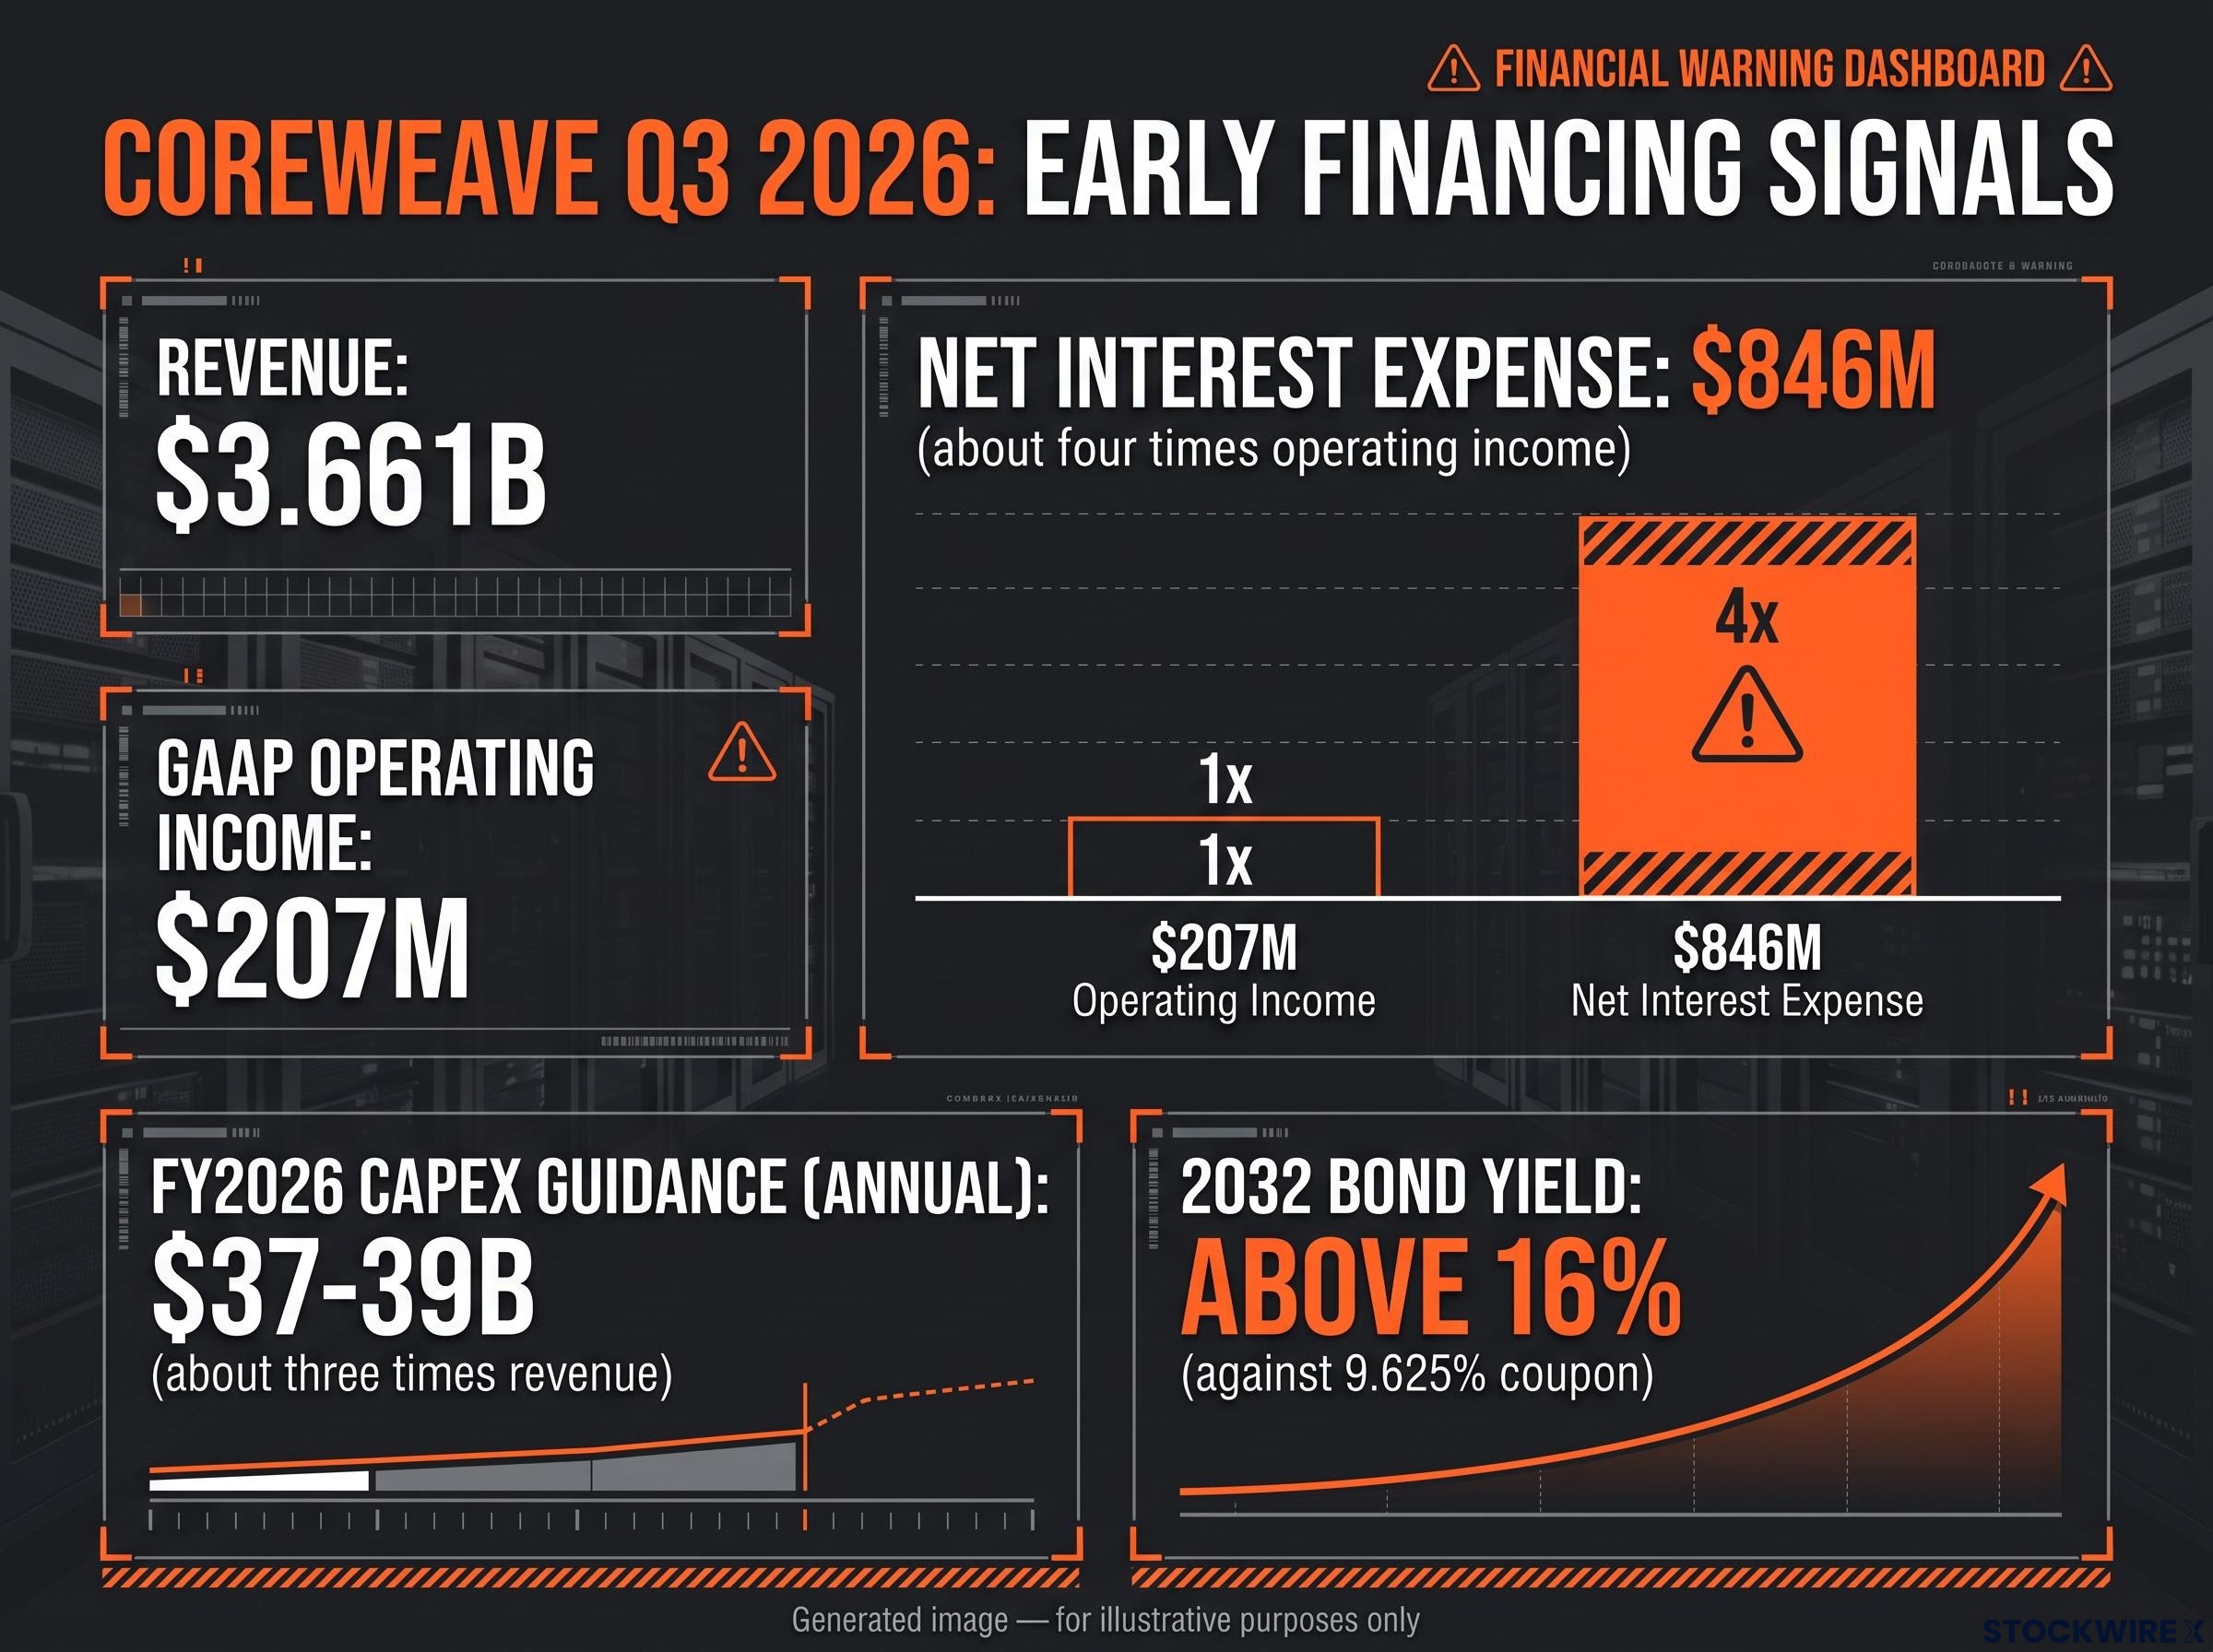
CoreWeave’s Q3 2026 net interest expense of $846M is about four times its GAAP operating income of $207M, highlighting early financing warning signals.
Why this boom differs from 2000: stronger buyers, concentrated and weaker growth
Where the AI cycle is genuinely stronger
The best defence of the boom is the buyers. Alphabet, Microsoft, Amazon, Meta and Nvidia have substantial revenues and cash flows from cloud, advertising and software. Dot-com start-ups had neither.
Other counter-arguments deserve a hearing too:
- Charles Schwab says power, permitting, equipment and labour shortages may limit supply before demand fades.
- Gartner’s revenue gap may be undercounted, because productivity gains and indirect revenue do not appear as data-centre revenue.
- Defensive spending to protect cloud share or secure scarce chips can be rational for each firm, even if industry returns fall.
- Against that, chips can lose value fast, and running them beyond their useful lives can flatter profits.
Where it is not
Concentration cuts the other way. A handful of firms drive most capex, chip demand and index performance, so a slowdown at a few buyers could hit suppliers, lenders and markets together.
| Measure | Dot-com era | AI era |
|---|---|---|
| Rise in investment share of US GDP | About 1.2 pp (1995-2000); ICT about 4.5% of GDP in 2000 | Less than 0.4 pp since 2022 (IMF) |
| GDP growth run rate | About 5% | 2.1% four-quarter rate (Rosenberg) |
| Buyer profitability | Many unprofitable start-ups | Highly profitable hyperscalers |
| Financing | Equity markets and telecom balance sheets | Cash flow shifting to bonds, leases and SPVs |
The growth evidence looks mixed until you separate two measures. The IMF looks at the level of investment relative to GDP, which is smaller than in the 1990s. The BIS looks at contribution to growth, finding AI investment added about 1 pp to US GDP growth in 2025.
Strong balance sheets lower the odds of a 2000-style collapse. Concentration, though, means your portfolio may carry more exposure to a few names than it appears.
For readers wanting the supplier view, our detailed coverage of Nvidia’s customer concentration explains how four hyperscalers fund most of its revenue and what backstop exposure it carries.
This article is for informational purposes only and should not be considered financial advice. Investors should conduct their own research and consult with financial professionals before making investment decisions.
The test that decides the answer, and the signals worth tracking
Put the evidence together and the boom looks less like a replay of 2000 and more like a genuine infrastructure super-cycle carrying bubble-like financing and valuation features.
The deciding test is whether AI-generated cash flows can carry the depreciation, interest and refinancing load of the buildout. Four signals will tell you which way it is breaking:
- Neocloud bond yields, starting with CoreWeave’s 2032 bond
- Hyperscaler free cash flow, after a negative Q3
- Debt issuance against Goldman’s 2027 forecasts
- AI revenue against Gartner’s required path, with no 12% return expected before end-2032
Bianco expects adoption to keep expanding; Rosenberg warns bubbles are only confirmed after they pop. All figures are in US$ as of November 2026, mixing quarterly and cumulative measures, so read each signal on its own timeframe.