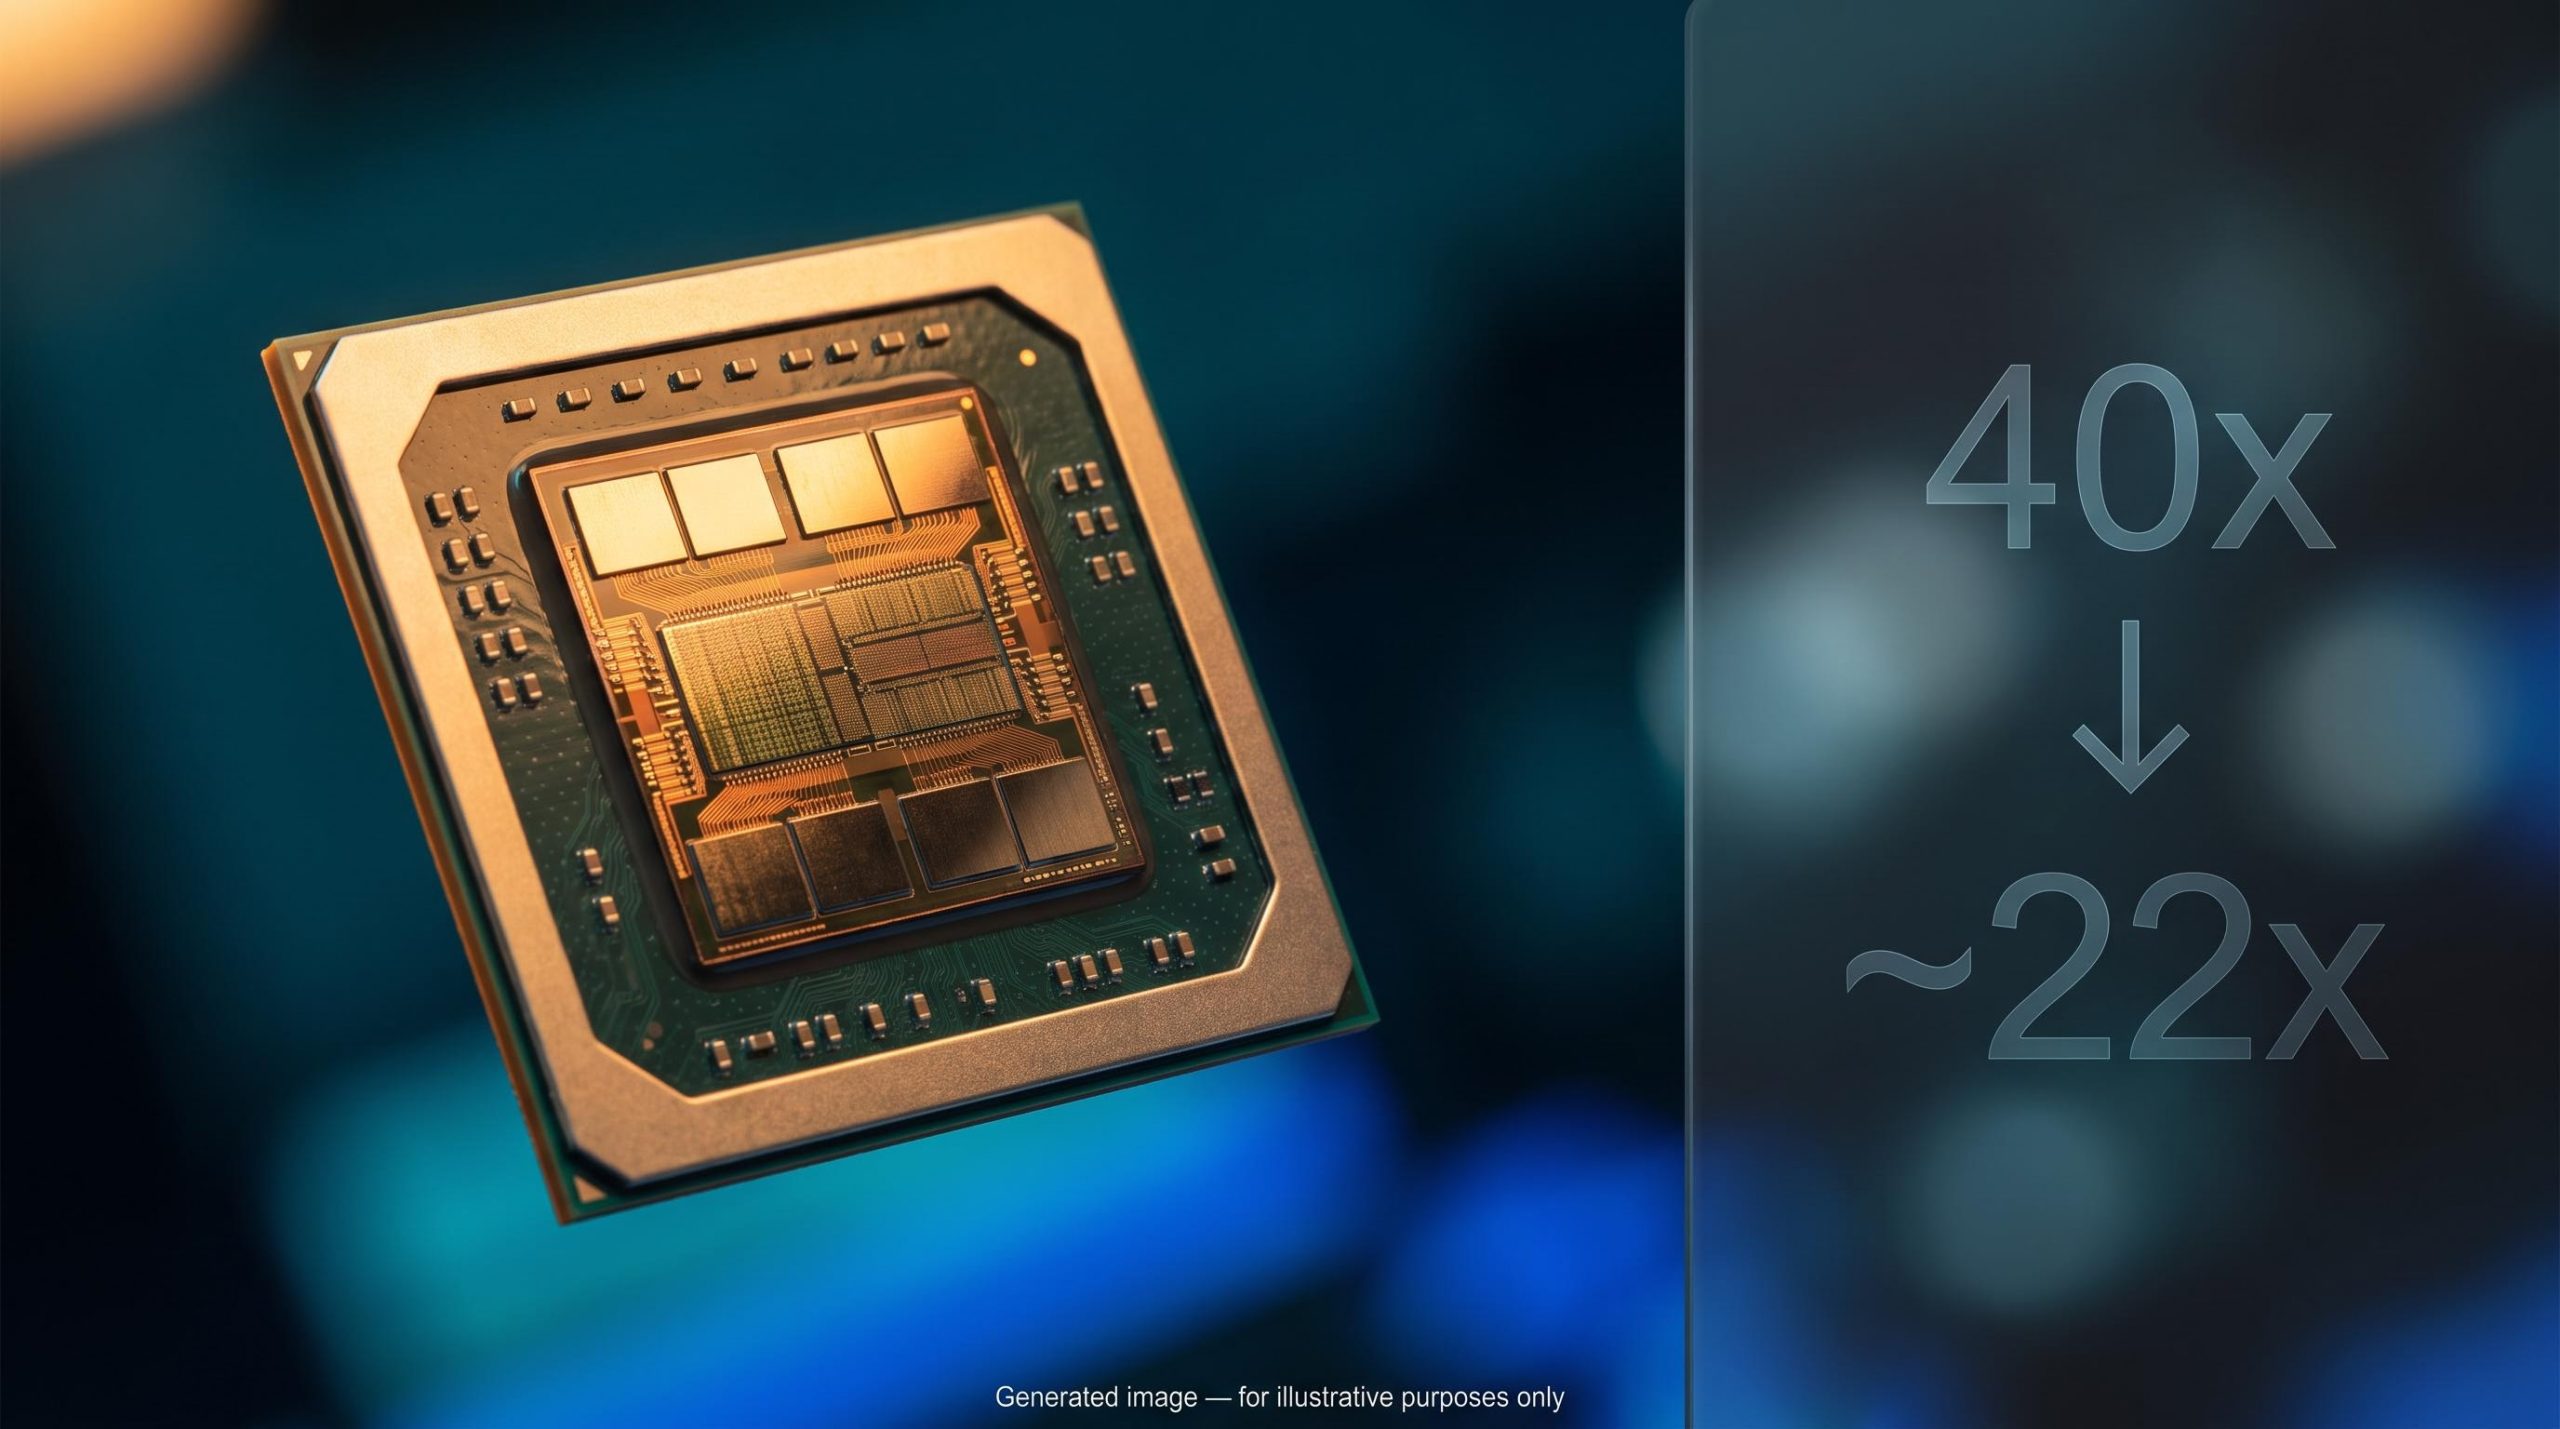
Nvidia is the stock that looked most expensive at the peak of AI enthusiasm. Its forward price-to-earnings multiple touched roughly 40x as investors priced in a future that had not yet arrived. That multiple has since compressed by nearly half. Yet in the same period, earnings power has not just held; it has expanded materially. The tension between a cheaper-looking multiple and a business that still commands a premium sits at the centre of every position decision on this stock right now.
The company occupies the intersection of two forces most investors are already tracking: an AI infrastructure spending cycle now measured in the trillions, and a rate environment where the Federal Reserve’s next move carries consequences for a specific, under-discussed portion of Nvidia’s customer base. This analysis draws on Futurum Group research, J.P. Morgan estimates, and Nvidia’s own CFO commentary to build a multi-source view rather than a single-analyst narrative.
What follows here is a framework for evaluating whether Nvidia’s current forward multiple is a premium worth paying, what the capex cycle actually implies for revenue share across a range of credible scenarios, and where the genuine risk in the thesis sits. The data supports a clear read on each layer. The investor’s job is to weigh them.
What Nvidia’s valuation actually looks like after the compression
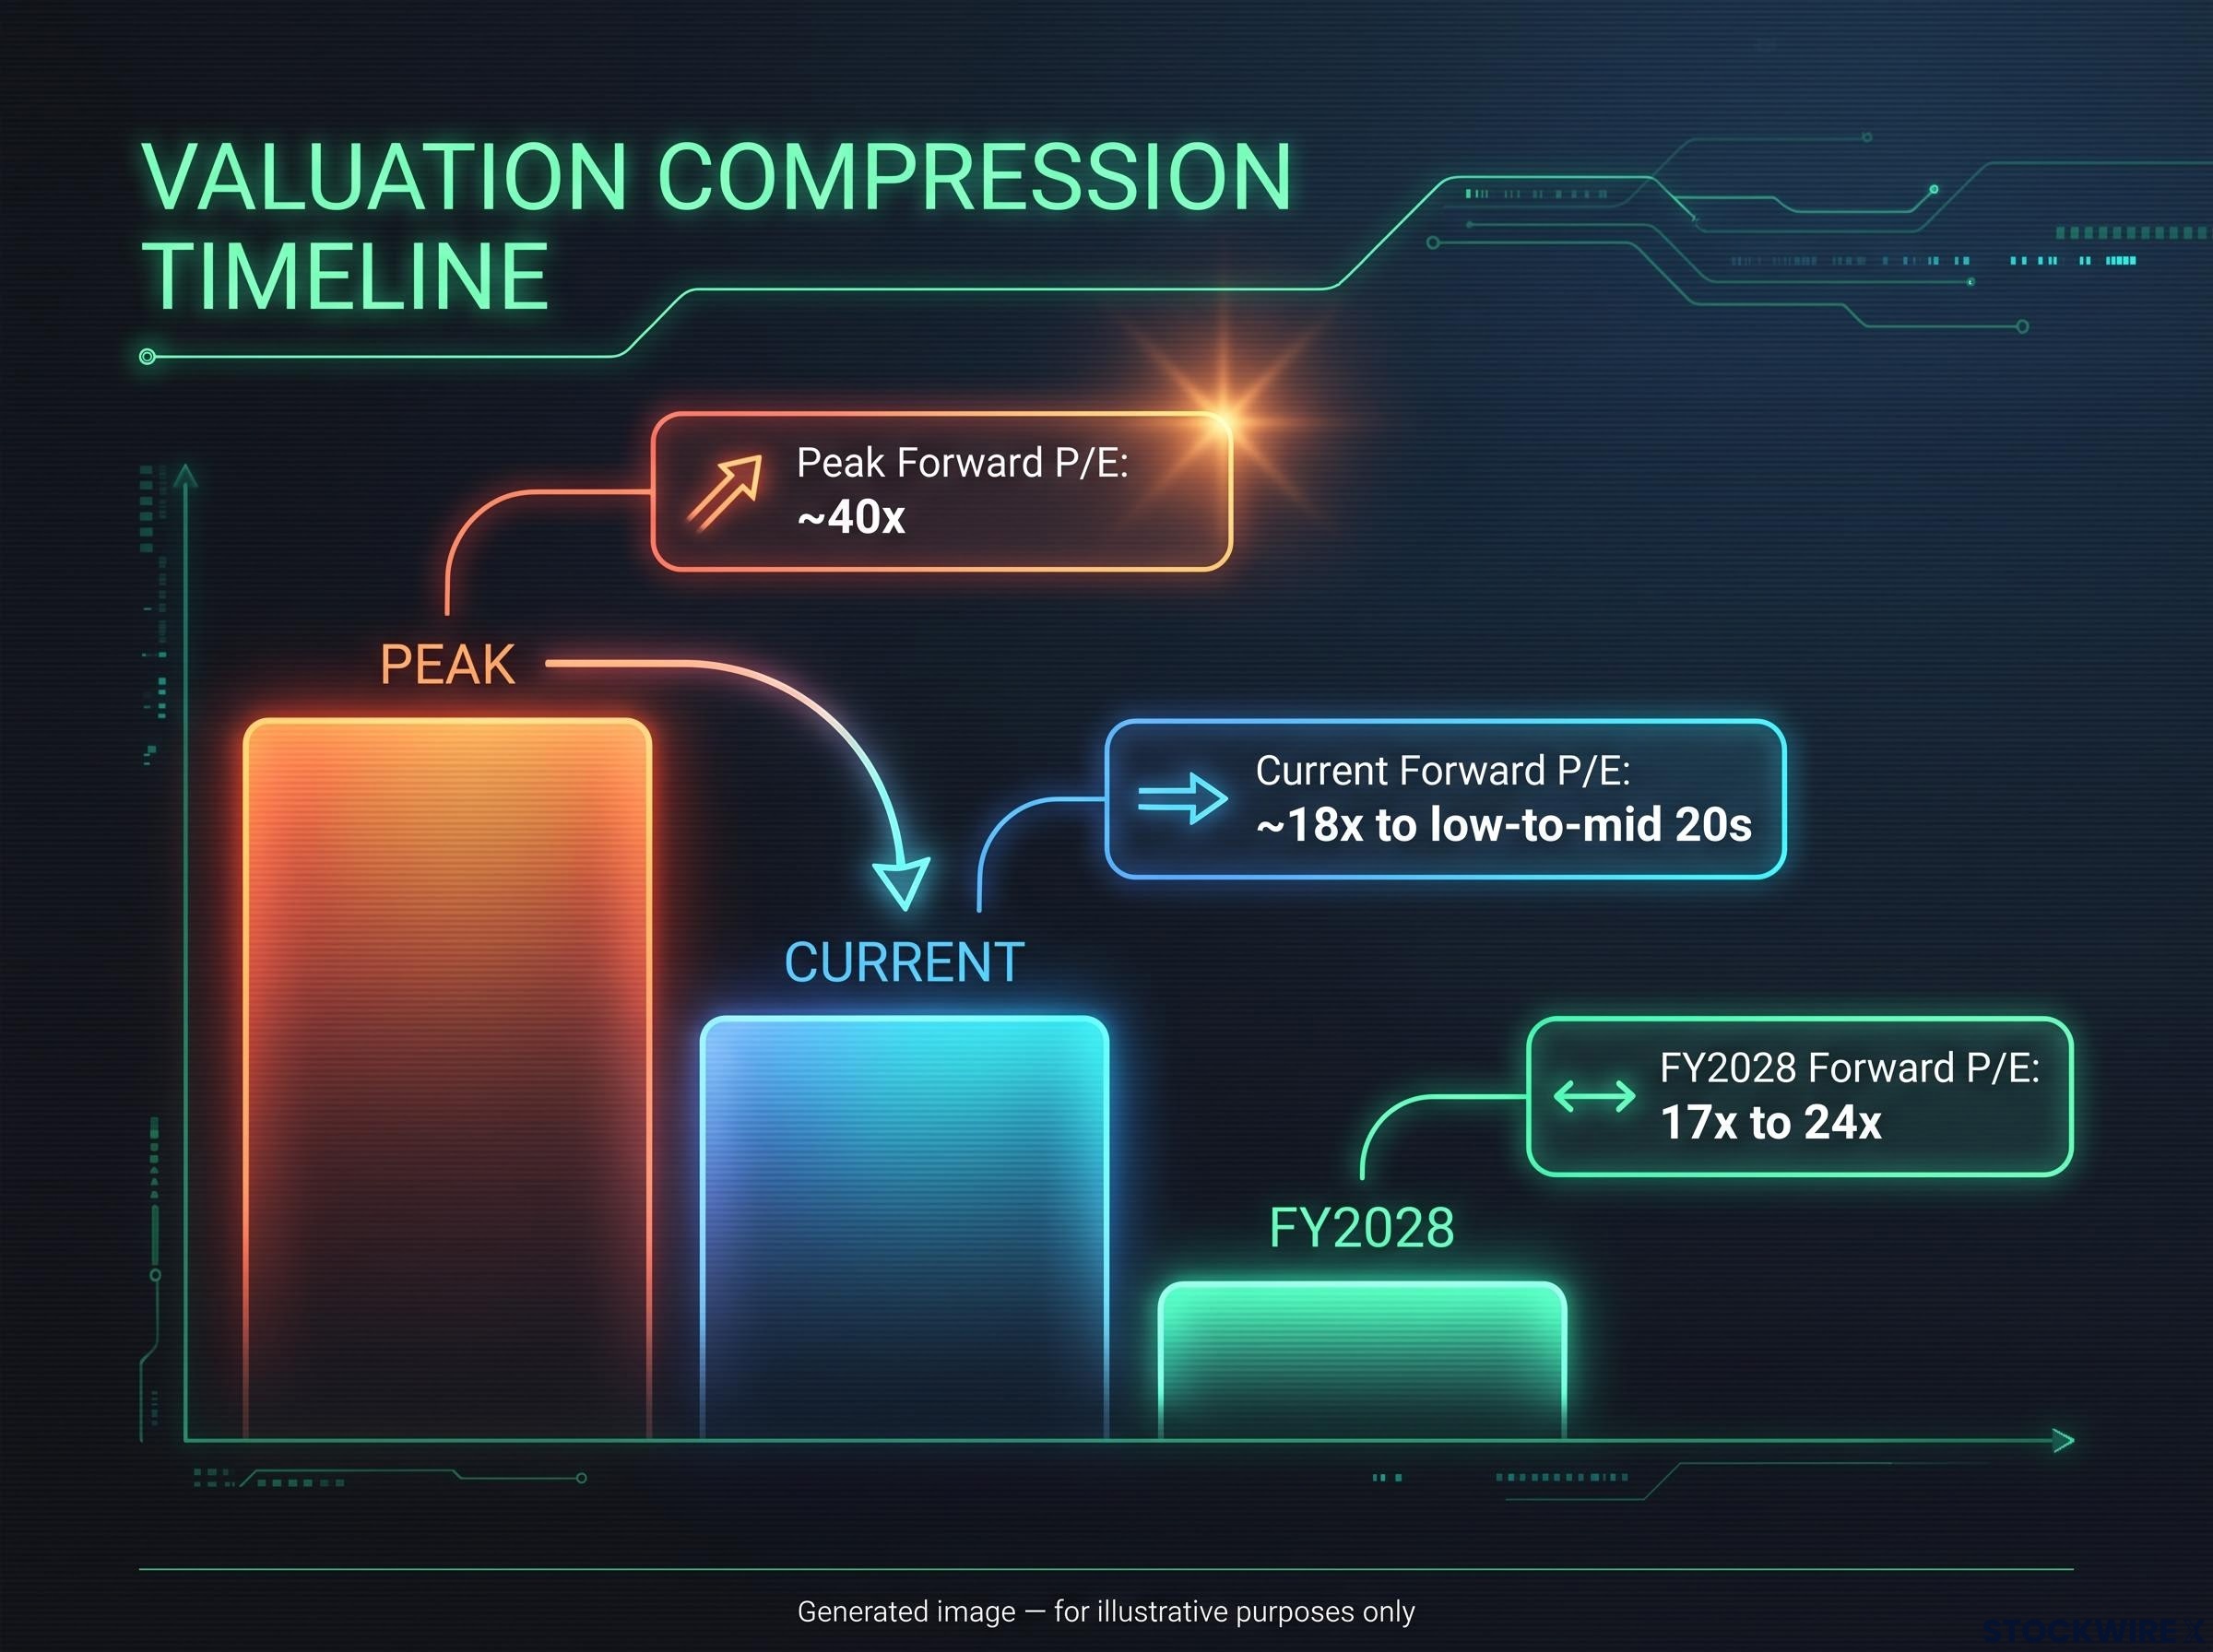
Start with where the multiple has been. At the height of AI enthusiasm, Nvidia’s forward P/E reached approximately 40x, a number that asked investors to believe in a decade of compounding growth before the stock could justify itself on fundamentals alone. That number has compressed to a range of roughly 18x to the low-to-mid 20s, depending on the earnings horizon and methodology used.
The compression is real, and it changes the character of the investment decision. Nvidia can continue to look progressively cheaper on forward metrics even as the share price rises, provided earnings grow faster than the multiple expands. For FY2028, certain analyst estimates place the forward multiple around 17x to 24x, a range that would have been difficult to imagine during the speculative peak.
A note on one figure that circulates in analyst commentary: a forward P/E of approximately 14.3x was derived from a trailing twelve-month EPS of roughly $7.91 alongside a next-year EPS estimate of approximately $15.24, calculated at the pre-earnings share price. Following results, the stock gained approximately +9% before Treasury yield movements pulled that advance back in subsequent trading. The 14.3x figure belongs to that specific moment in time. It does not reflect current market conditions and carries no weight as a live valuation reference.
| Metric | Period-Specific Value | Current Value (August 2026) | Context |
|---|---|---|---|
| Trailing P/E | ~27.5x | ~27.5-34x | Reflects expanded earnings base |
| Forward P/E | ~14.3x (pre-earnings price) | ~18x to low-to-mid 20s | Varies by earnings horizon and methodology |
| Forward EPS Estimate | ~$15.24 (next fiscal year) | Revised upward, consistent with supply-constrained demand | Estimate direction matters more than static number |
In public commentary confirmed directly with Nvidia’s CFO, FY2028 revenue growth was described as gated by the availability of supply rather than by the strength of demand. That framing underpins the earnings growth assumption the current multiple is pricing in: a supply bottleneck means demand itself is not the variable under pressure.
What this tells you as an investor: the market has already done meaningful valuation work. The compression from 40x to the low-to-mid 20s means the stock no longer requires you to accept a speculative premium. But the remaining multiple still demands a conviction call. A forward P/E in the low-to-mid 20s embeds optimistic growth assumptions, and multiple compression can limit price appreciation relative to earnings trajectory even when the business performs well. The starting baseline is more reasonable than it was. It is not cheap.
DCF valuation scenarios applied to Nvidia produce intrinsic value estimates spanning from roughly $73 to $738 depending on the growth rate and hurdle rate used, a range that makes the bull-or-bear verdict almost entirely a function of which assumptions an investor is prepared to underwrite rather than a consensus conclusion.
When big ASX news breaks, our subscribers know first
How forward valuation works when earnings are moving fast
Forward P/E divides today’s share price by expected earnings over the next twelve months. When earnings estimates are rising quickly, the denominator grows, and the ratio falls, even if the price is also rising. This creates the appearance of a stock becoming cheaper without any actual price decline.
That mechanical effect is precisely what has driven the compression narrative around Nvidia. Earnings estimates have been revised upward consistently over the past fiscal year, supported by the supply-constrained demand picture the CFO described. Each upward revision makes the forward multiple look more attractive, which in turn supports the argument that the stock is progressively de-risking.
Three conditions need to hold for a high multiple to be considered genuinely cheap on a forward basis:
- Earnings estimates are rising faster than the share price
- The multiple is compressing from a meaningfully higher base
- Supply-constrained demand is visible in management guidance, limiting the risk of estimate downgrades
All three currently apply to Nvidia. But the third condition is the one the rest of this analysis will pressure-test.
When the earnings story and the returns story diverge
Strong business performance does not automatically translate into strong investment returns. If the entry multiple is high enough, compression can offset earnings growth, meaning the company delivers on every operational metric and the stock goes sideways. What to watch: the direction of estimate revisions (if they stall, the forward multiple stops compressing), sentiment shift signals among institutional holders, and rate moves that affect near-term demand from leveraged customers.
Nvidia’s share of the AI infrastructure spending boom: scenarios and reality
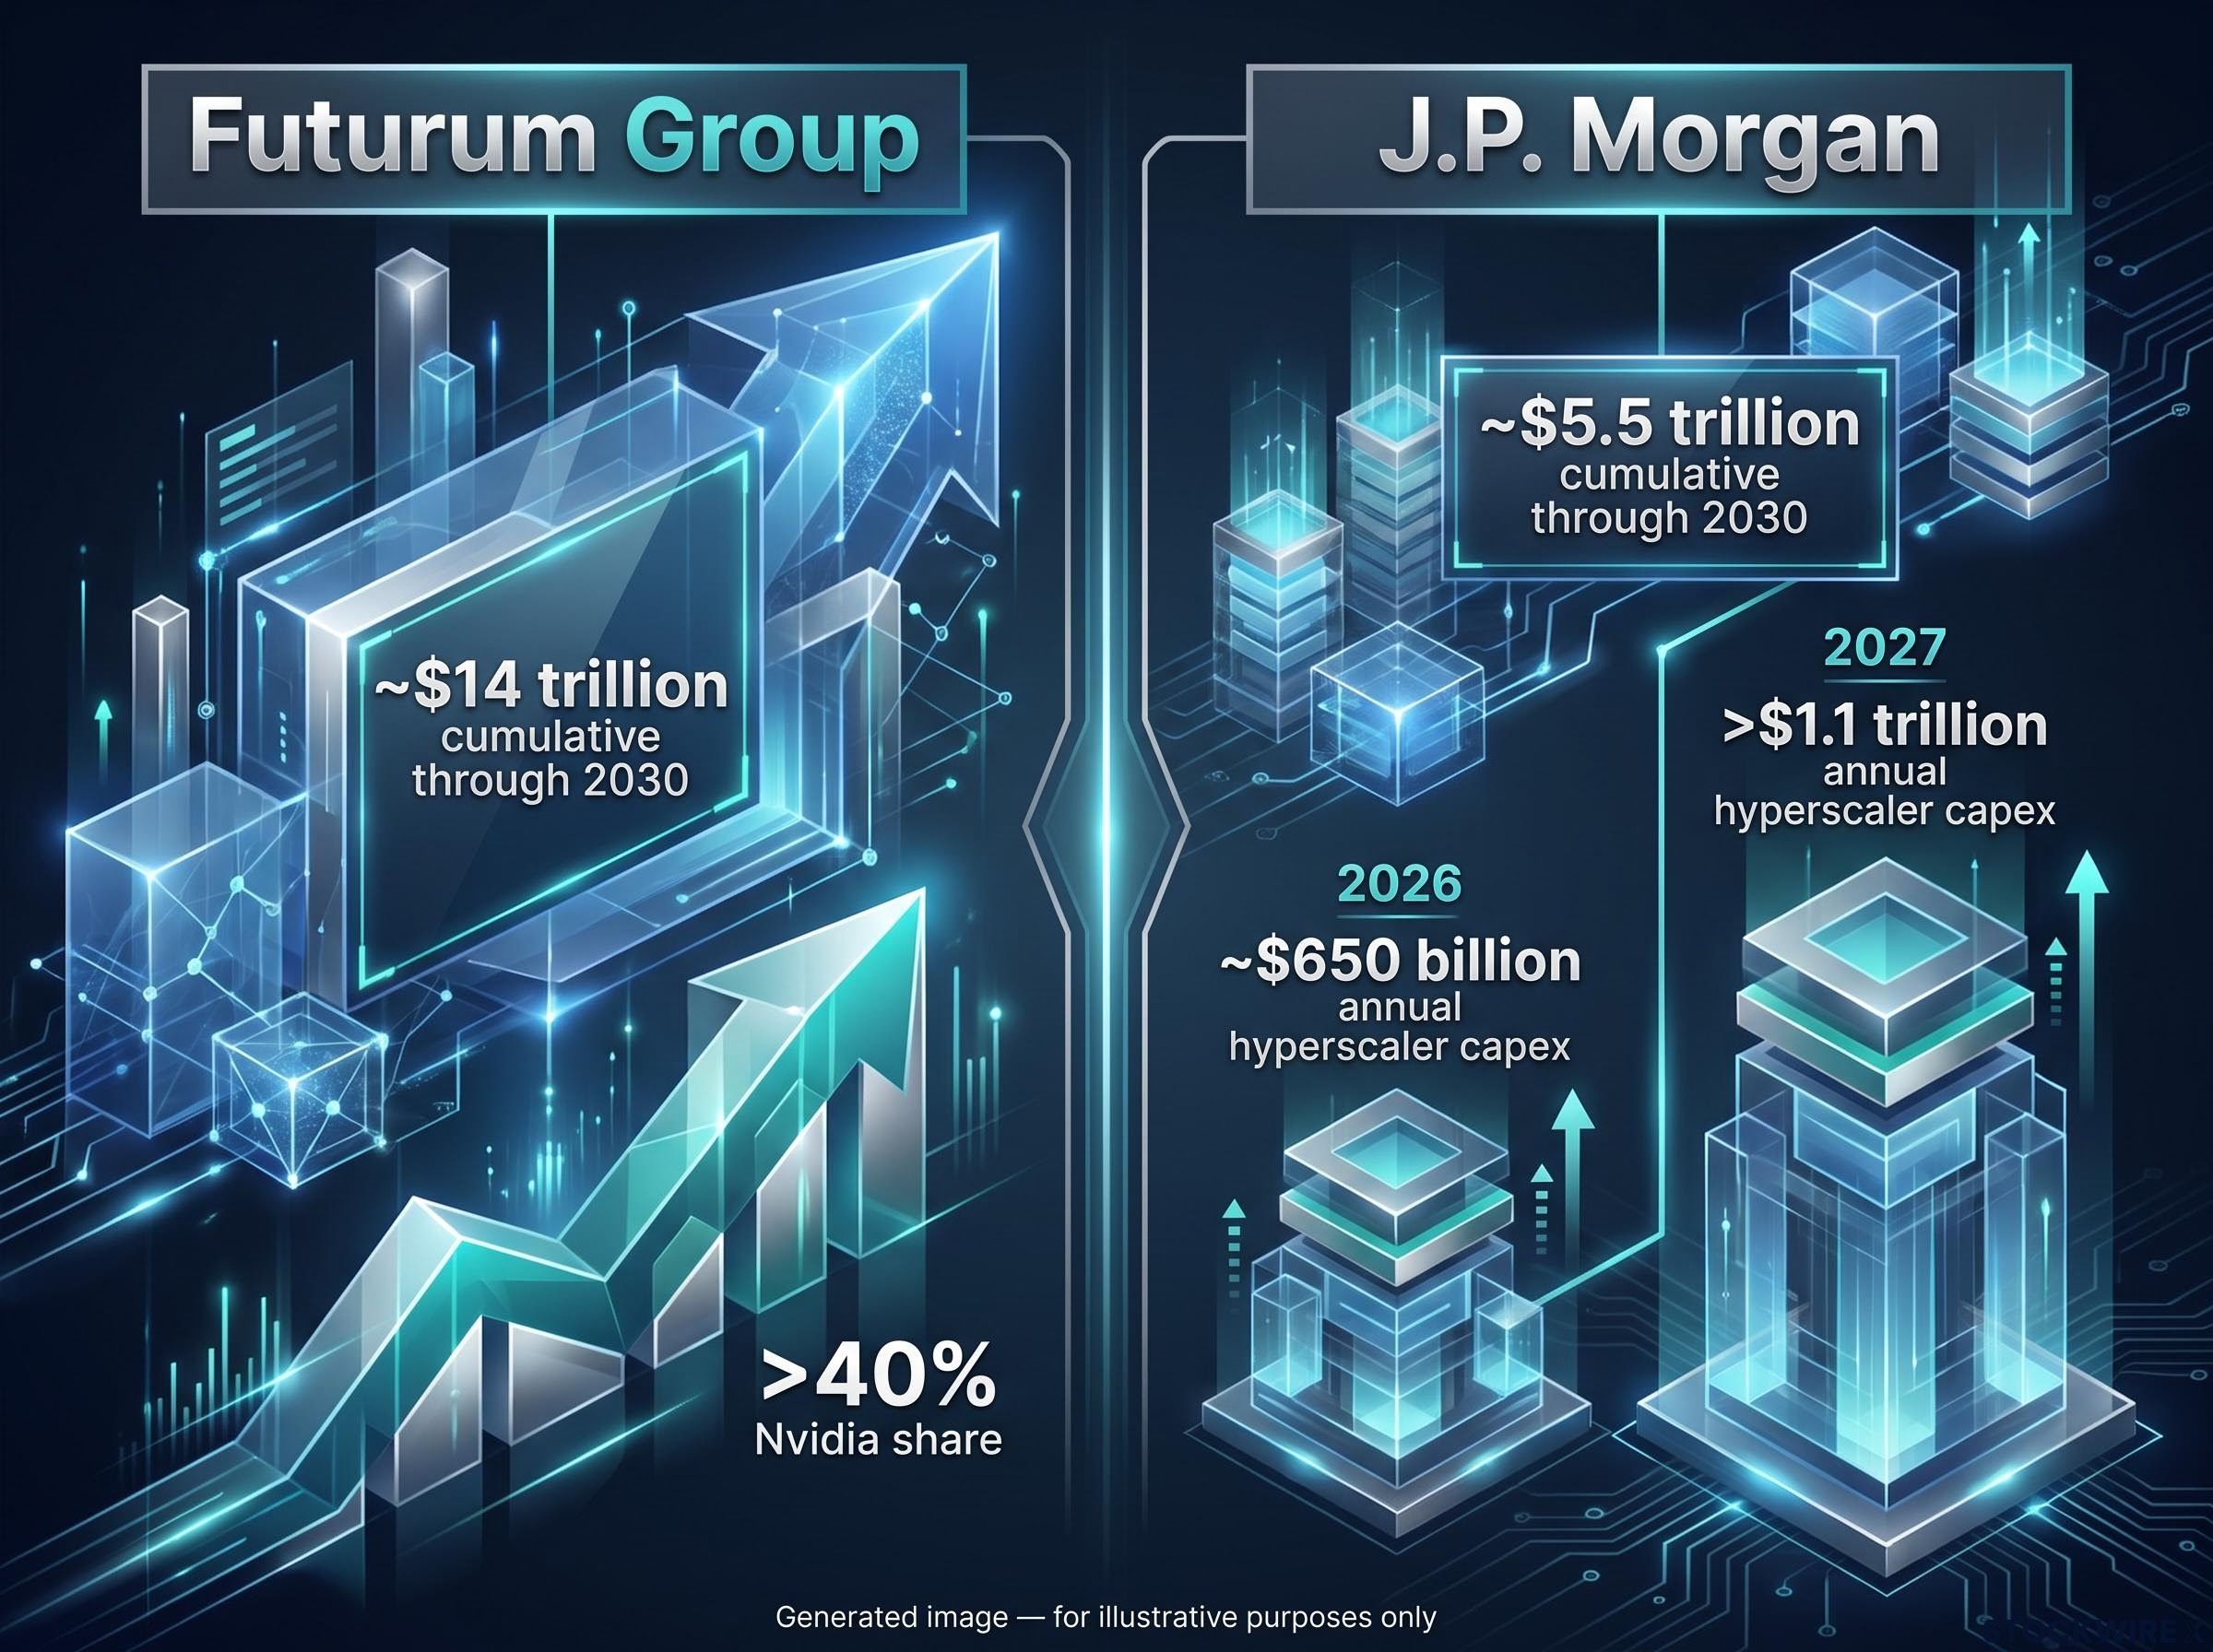
Dan Newman, CEO of Futurum Group, projects approximately $14 trillion in cumulative global AI capital expenditure through 2030, with Nvidia capturing over 40% of that spending. That is a specific bullish analyst scenario from a named source, not a consensus figure.
J.P. Morgan’s research places the number substantially lower: approximately $5.5 trillion cumulative through 2030, with hyperscaler annual capex at roughly $650 billion in 2026 rising above $1.1 trillion in 2027. Other industry commentary anchors annual AI infrastructure spend at approximately $1.2-$1.4 trillion per year by late in the decade.
The gap between these two estimates is more than $8 trillion. Knowing the range, and understanding what drives the difference, matters before treating the headline figure as a foundation for any position.
| Source | Cumulative Capex Estimate | Annual Spend (Late Decade) | Implied Nvidia Positioning |
|---|---|---|---|
| Futurum Group (Dan Newman) | ~$14 trillion through 2030 | Not specified at annual level | >40% share; ~$1 trillion cumulative Nvidia cash over 3 years |
| J.P. Morgan | ~$5.5 trillion through 2030 | ~$650B (2026) rising above $1.1T (2027) | Supports multi-trillion secular cycle; lower implied Nvidia share |
Dan Newman of Futurum Group describes Nvidia’s pricing power as exceptional among hardware suppliers, arguing the company can move prices materially higher with negligible customer attrition. This is a bullish framing from a named analyst and should be understood in that context rather than as a consensus view.
Even the more conservative J.P. Morgan estimate supports the characterisation of a secular, multi-trillion-dollar infrastructure cycle. Nvidia does not need the $14 trillion figure to be correct for the earnings thesis to hold. But the 40% share assumption requires honest scrutiny.
Total AI capex is not equivalent to Nvidia’s addressable revenue. Substantial portions flow to power infrastructure, real estate, networking, and non-GPU hardware. The 40% figure represents a share of the GPU and accelerator portion, not total infrastructure spend.
And the competitive response is already underway. Four hyperscaler custom silicon programmes are in various stages of deployment:
- Amazon: Trainium and Inferentia
- Google: TPU
- Microsoft: Maia
- Meta: MTIA
These in-house efforts reduce reliance on Nvidia at the margin, particularly for inference workloads and specialised applications. Even under bullish scenarios where Nvidia retains dominant share of model training, a growing fraction of inference and deployment may migrate to alternative silicon. What this means for the investor evaluating the capex opportunity: the absolute scale of the cycle is large enough that Nvidia does not need to win every sub-category. But the 40% share figure is a bullish scenario, not a baseline expectation, and it requires Nvidia to successfully defend its CUDA ecosystem against well-resourced alternatives.
Custom silicon competition from Alphabet, Amazon, and Microsoft is most acute in inference workloads, where purpose-built chips can undercut Nvidia on cost per token, and the structural irony is that the same $700 billion capex wave funding Nvidia’s near-term order book is also financing the programmes designed to reduce dependence on it.
The rate sensitivity risk that most Nvidia coverage misses
Most rate-sensitivity analysis for technology stocks stops at the company balance sheet. For Nvidia, that framing misses the more important mechanism entirely.
Roughly $40 billion of data centre revenue, accounting for close to 50% of the segment, is generated by smaller cloud providers and enterprise customers. Unlike the hyperscalers, these buyers fund their AI buildouts heavily through borrowing and equity issuance, making their capital expenditure decisions sensitive to movements in financing costs. When Treasury yields shift, the capex timing of this cohort moves with them, even if the largest cloud operators remain unaffected.
The post-earnings episode from the specific earnings release makes the mechanism visible: an initial gain of approximately +9% was walked back in the following session once Treasury yields pushed higher. A strong earnings print was not enough to sustain the move when the rate environment shifted against the more financing-dependent parts of the customer base.
Equity duration mechanics explain why the rate sensitivity in the current article is concentrated in a specific customer cohort rather than Nvidia’s own balance sheet: long-duration assets see the largest present-value impact from yield moves, and leveraged smaller cloud buyers carry a different effective duration profile than a cash-generative company with $22 billion on its balance sheet.
Nvidia’s financial position and customer funding exposure
At the corporate level, Nvidia is a net beneficiary of higher rates. At the customer level, leveraged smaller cloud and enterprise buyers face real financing constraints.
Corporate-level rate position:
- Cash and equivalents of approximately $22 billion
- Long-term debt of approximately $33 billion
- Net cash-positive when marketable securities are included
- Higher short-term rates increase interest income rather than raise financing costs
Customer-level rate position:
- Approximately $40 billion in data centre revenue from rate-sensitive buyers
- Capex decisions at these customers are tied to financing availability
- Treasury yield moves can delay infrastructure deployment even when demand intent is strong
An investor who holds Nvidia through a period of rising Treasury yields needs to distinguish between these two dynamics. Conflating them leads to either excessive fear (the company’s balance sheet is strong) or false comfort (the customer base includes a meaningfully rate-sensitive segment). The thesis assumes that rates do not remain elevated for long enough, or rise high enough, to materially delay enterprise AI adoption across this segment. That assumption is worth forming your own view on rather than accepting implicitly.
Export controls on advanced GPUs to certain countries, primarily China, represent a separate structural risk layer. These restrictions affect both shipment volumes and product mix, with the highest-margin products subject to the most significant limitations. This risk is ongoing rather than resolved, and it compounds with rate sensitivity by limiting the addressable market for Nvidia’s most profitable products.
Holding Nvidia through the next phase of the AI cycle
The four layers of this analysis converge on a specific question: what is the long-term holder actually betting on at current multiples?
The valuation has compressed from speculative levels to a forward multiple that still embeds a growth premium, but one that no longer requires faith alone. The capex cycle, even on the more conservative J.P. Morgan estimate, represents a secular infrastructure buildout large enough to sustain Nvidia’s earnings trajectory. The supply-constrained moat protects near-term positioning, though management’s own forward visibility extends to roughly 18 months, after which capacity expansion is expected to ease the bottleneck effect. And the rate risk is narrower than broad coverage suggests, concentrated in a specific customer segment rather than the company itself.
Three variables deserve ongoing monitoring:
- Direction of earnings estimate revisions. This is the signal that the forward multiple is either working in your favour (estimates rising, multiple compressing) or against you (estimates flattening, multiple re-expanding relative to price). Stalling revisions change the character of the hold.
- Fed policy trajectory and its read-through to enterprise capex. The segment to monitor is smaller cloud providers and enterprise buyers, whose financing costs move with Treasury yields. Hyperscaler capex is insulated from that pressure. The roughly $40 billion in revenue tied to more rate-sensitive customers is where meaningful disruption would first appear.
- Ecosystem defence indicators. CUDA adoption metrics, developer platform engagement, and any evidence of accelerating hyperscaler in-house silicon deployment. The CUDA ecosystem and its switching costs are the durable moat once supply constraints normalise. If that moat erodes, the competitive dynamics shift materially.
Futurum Group has noted a structural parallel between Nvidia and Apple: both represent large, cash-generative businesses positioned at the centre of a defining technology wave, capable of drawing investor interest even during periods of broader market stress. The parallel is offered as a qualitative framing of Nvidia’s market positioning rather than a precise financial analogy.
The investor’s decision ultimately comes down to whether Nvidia’s software ecosystem and pricing power will remain durable enough over a three-to-five year holding period to justify the earnings growth assumptions embedded in the current multiple. The data supports a positive reading on near-term fundamentals. The structural vulnerabilities, the time-bound nature of the supply moat, the competitive response from well-resourced hyperscalers, and the persistent export control overhang, require the investor to accept specific risks rather than dismiss them.
Investors wanting to extend this framework to the broader sector will find our dedicated guide to semiconductor cycle positioning covers the five-indicator framework for managing the transition from peak-cycle earnings to the 2027-2029 supply wave, including the graduated de-risking sequence that distinguishes ecosystem-anchored logic plays from thin-moat AI names.
This article is for informational purposes only and should not be considered financial advice. Investors should conduct their own research and consult with financial professionals before making investment decisions. Past performance does not guarantee future results. Financial projections are subject to market conditions and various risk factors.
—