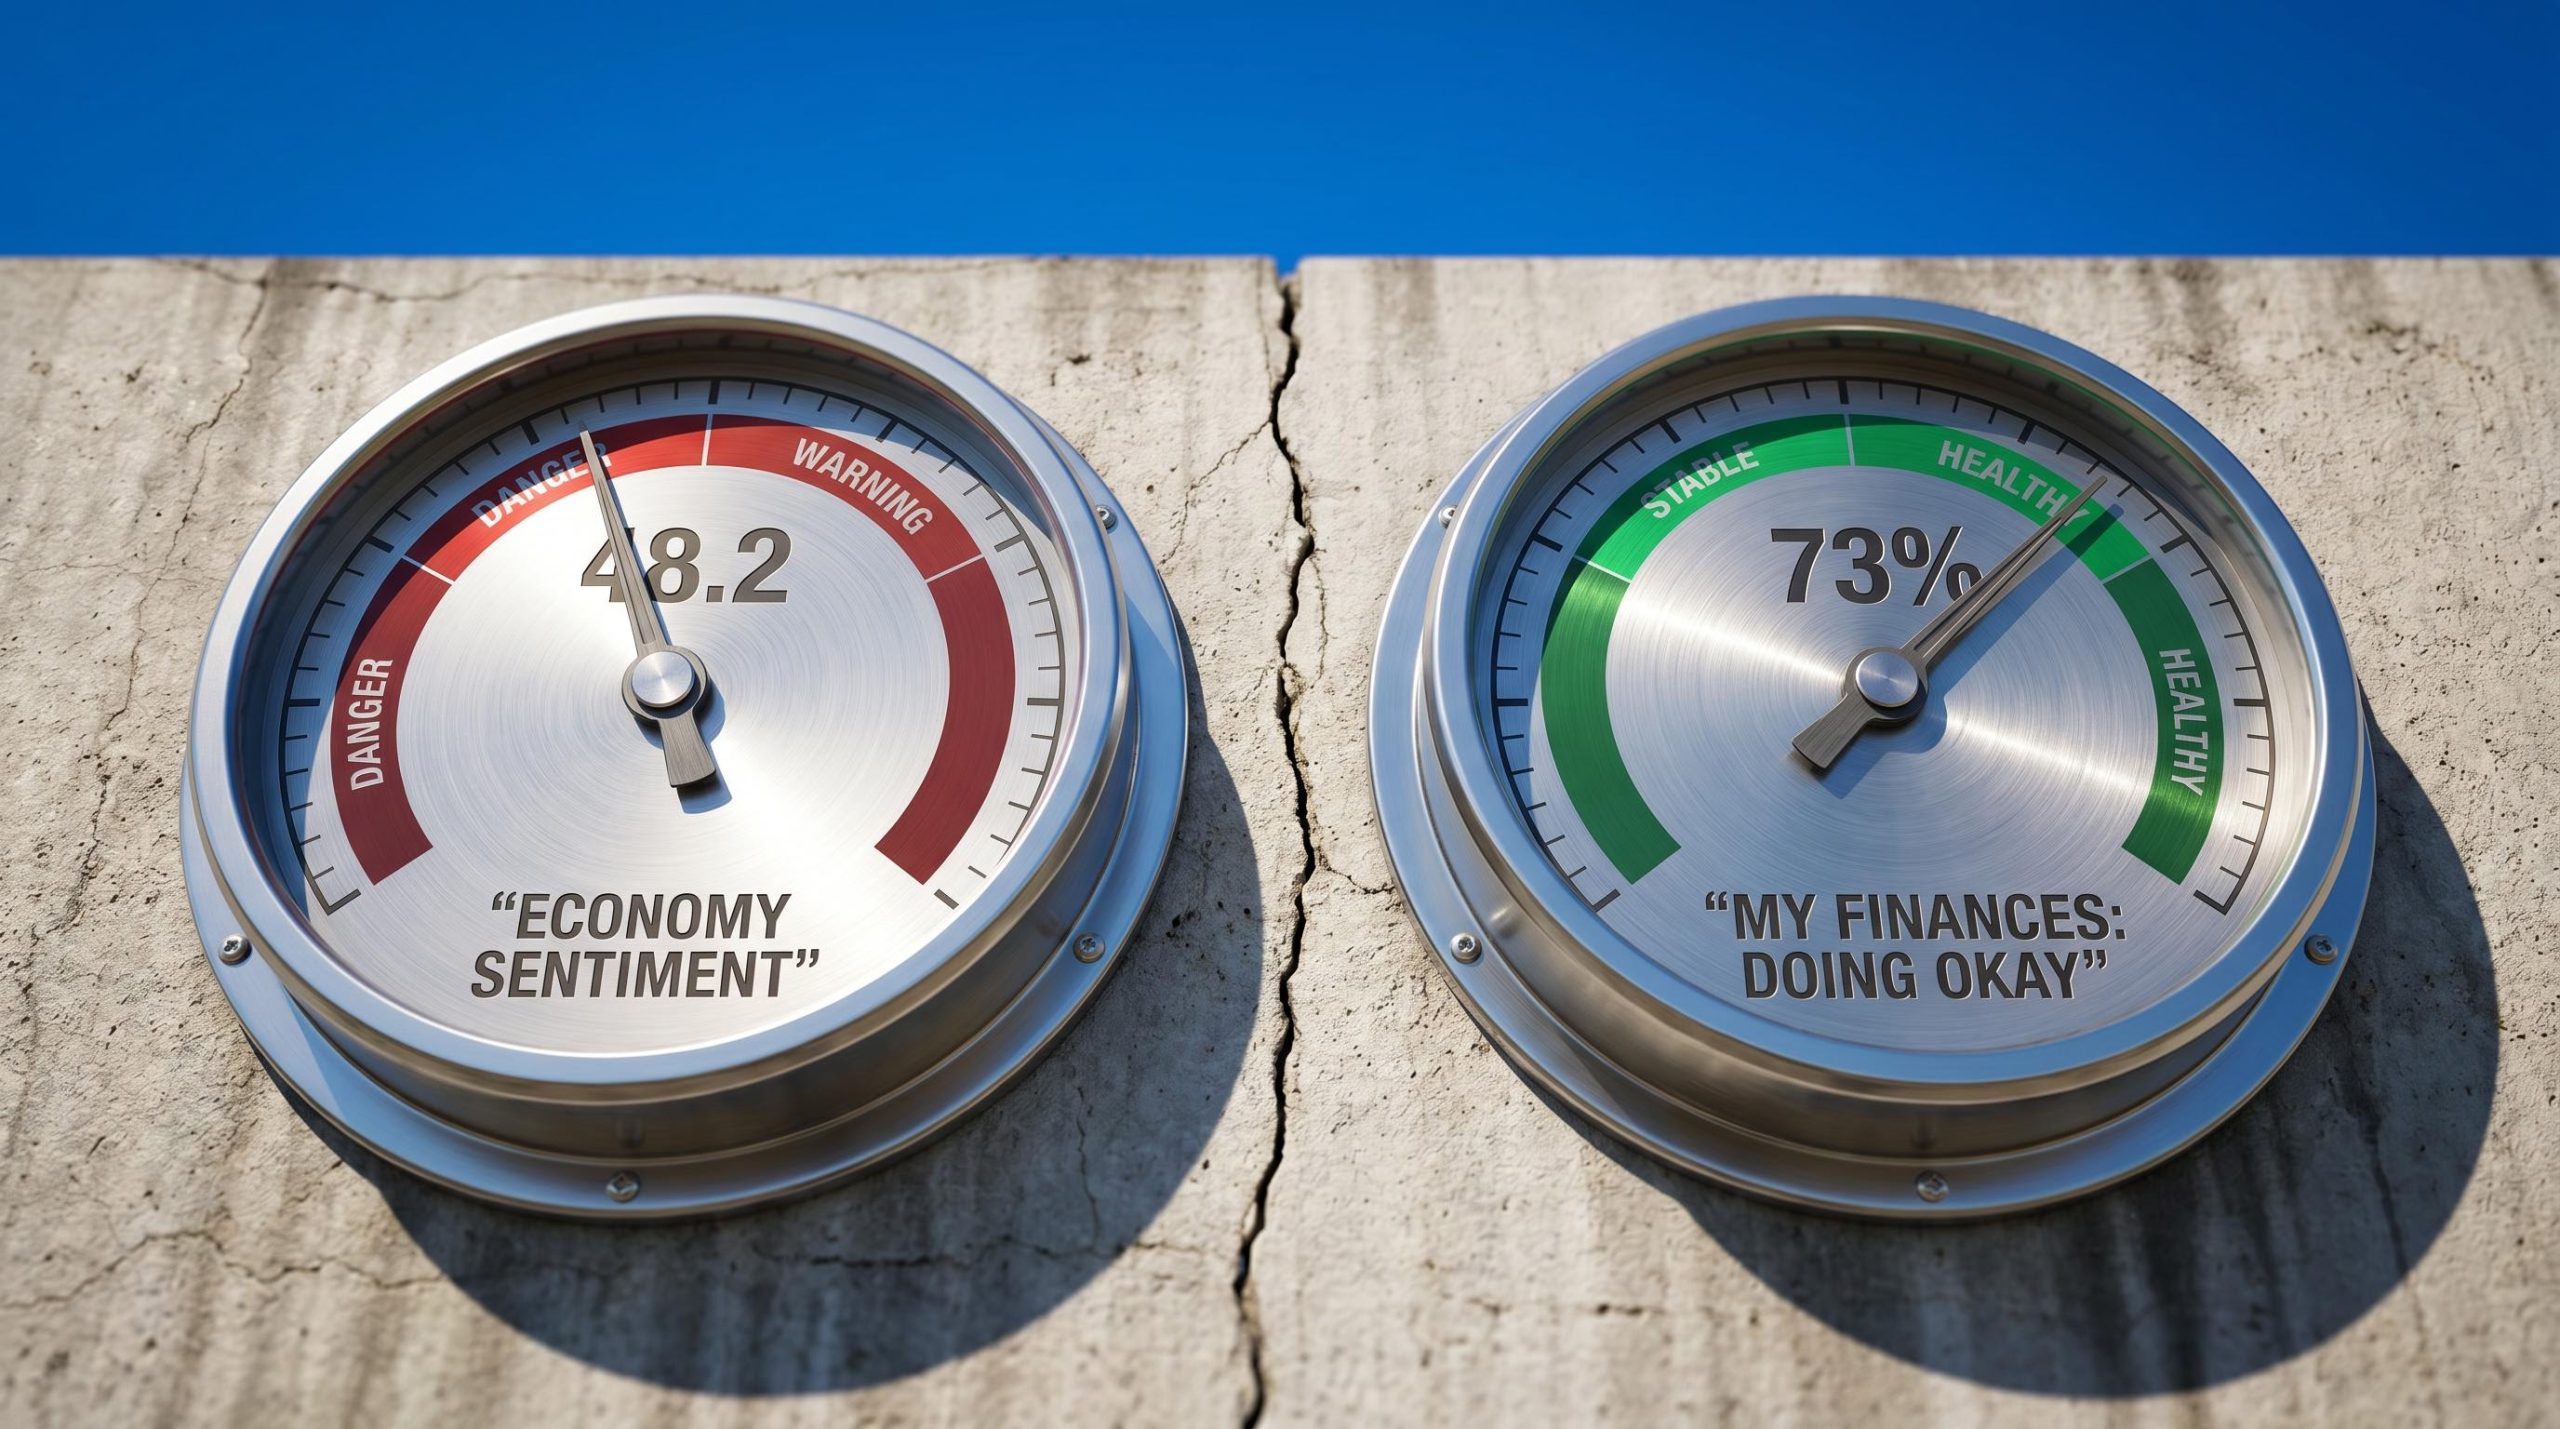
Why the Record-Low Consumer Sentiment Reading May Not Mean Recession
33 mins ago
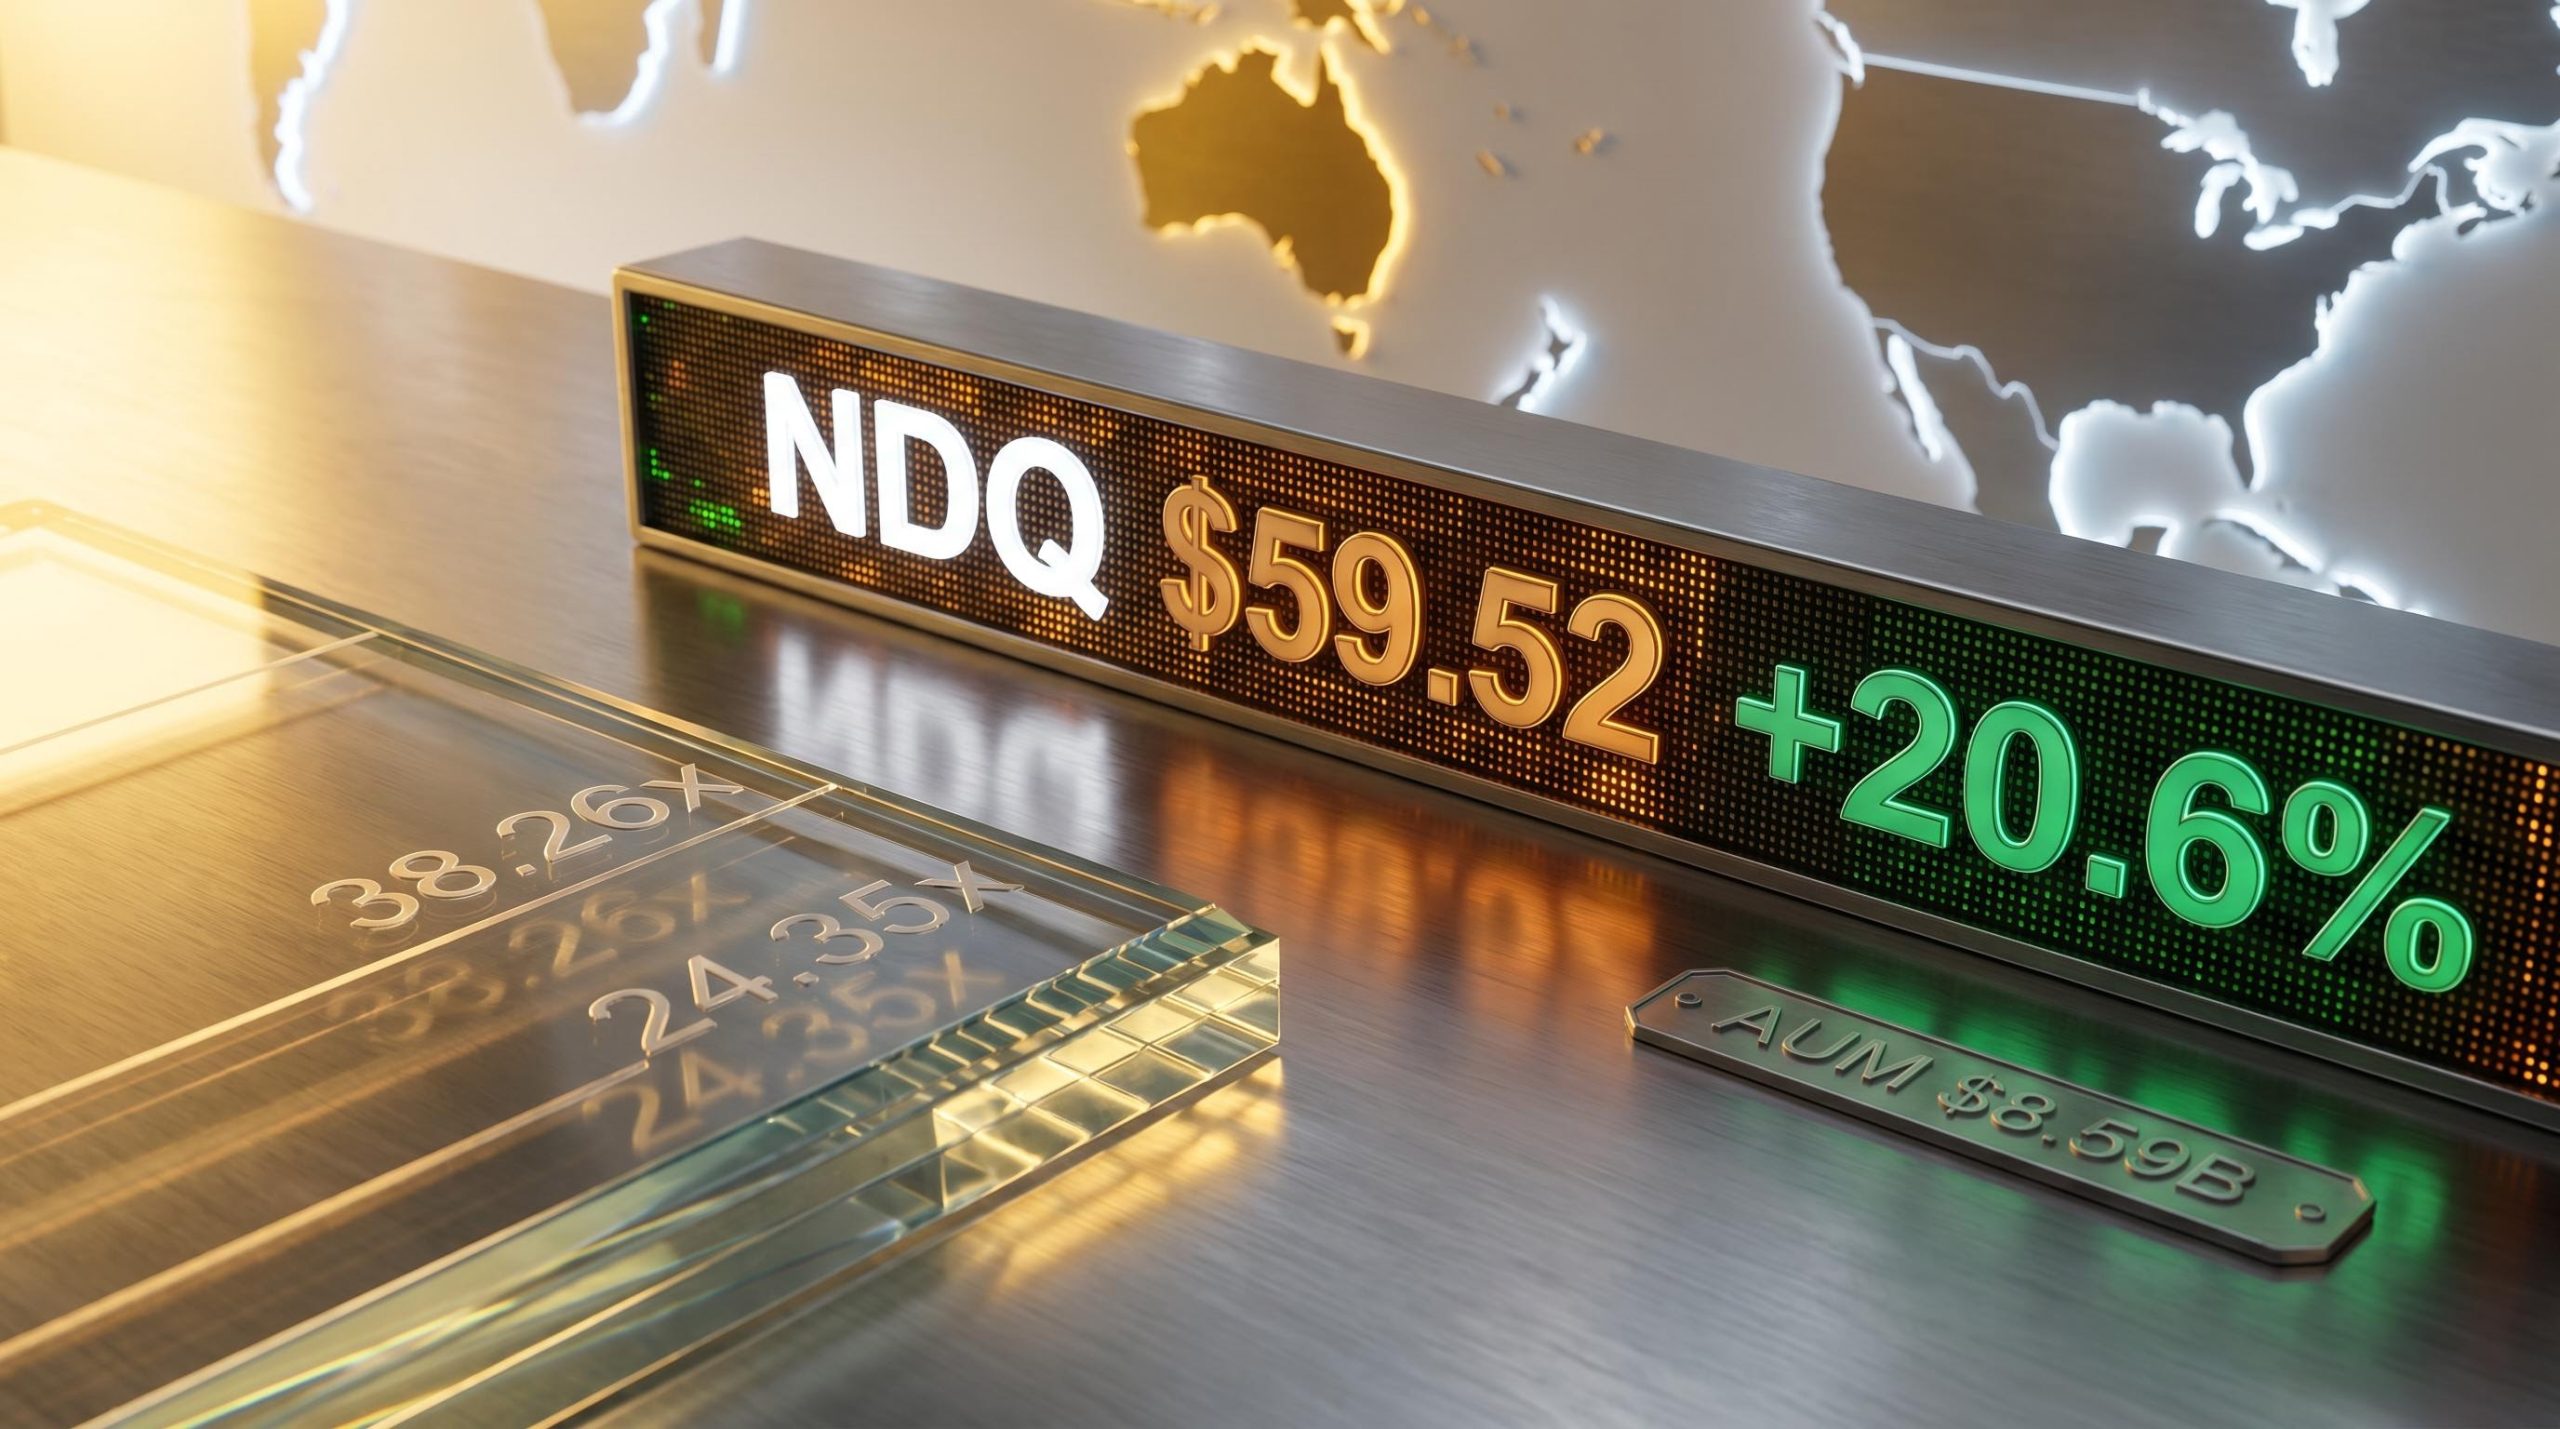
The BetaShares Nasdaq 100 ETF (ASX: NDQ) closed at $59.52 on 11 May 2026, its highest level on record, after surging approximately 20.6% from $49.32 at the end of March. For Australian investors watching from the sideline, or sitting on an existing position and weighing whether to add, the timing question has become urgent. The underlying Nasdaq-100 now trades at a trailing price-to-earnings (P/E) ratio of 38.26x and a forward P/E of 24.35x, implying the market has already priced in substantial earnings growth. Whether that growth materialises, and on what timeline, is the central question. What follows is an assessment of what sits inside NDQ, the valuation reality at current prices, the role of AI as both the bull case and the biggest unknown, three structural risks specific to Australian holders, and a practical framework for sizing a position when conviction is high but the entry point is uncomfortable.
NDQ tracks the Nasdaq-100 Index, a basket of the 100 largest non-financial companies listed on the US Nasdaq exchange. The portfolio is not a speculative grab bag. It holds businesses with demonstrated earnings growth, pricing power, and diversified revenue streams spanning devices, cloud infrastructure, digital advertising, and enterprise software.
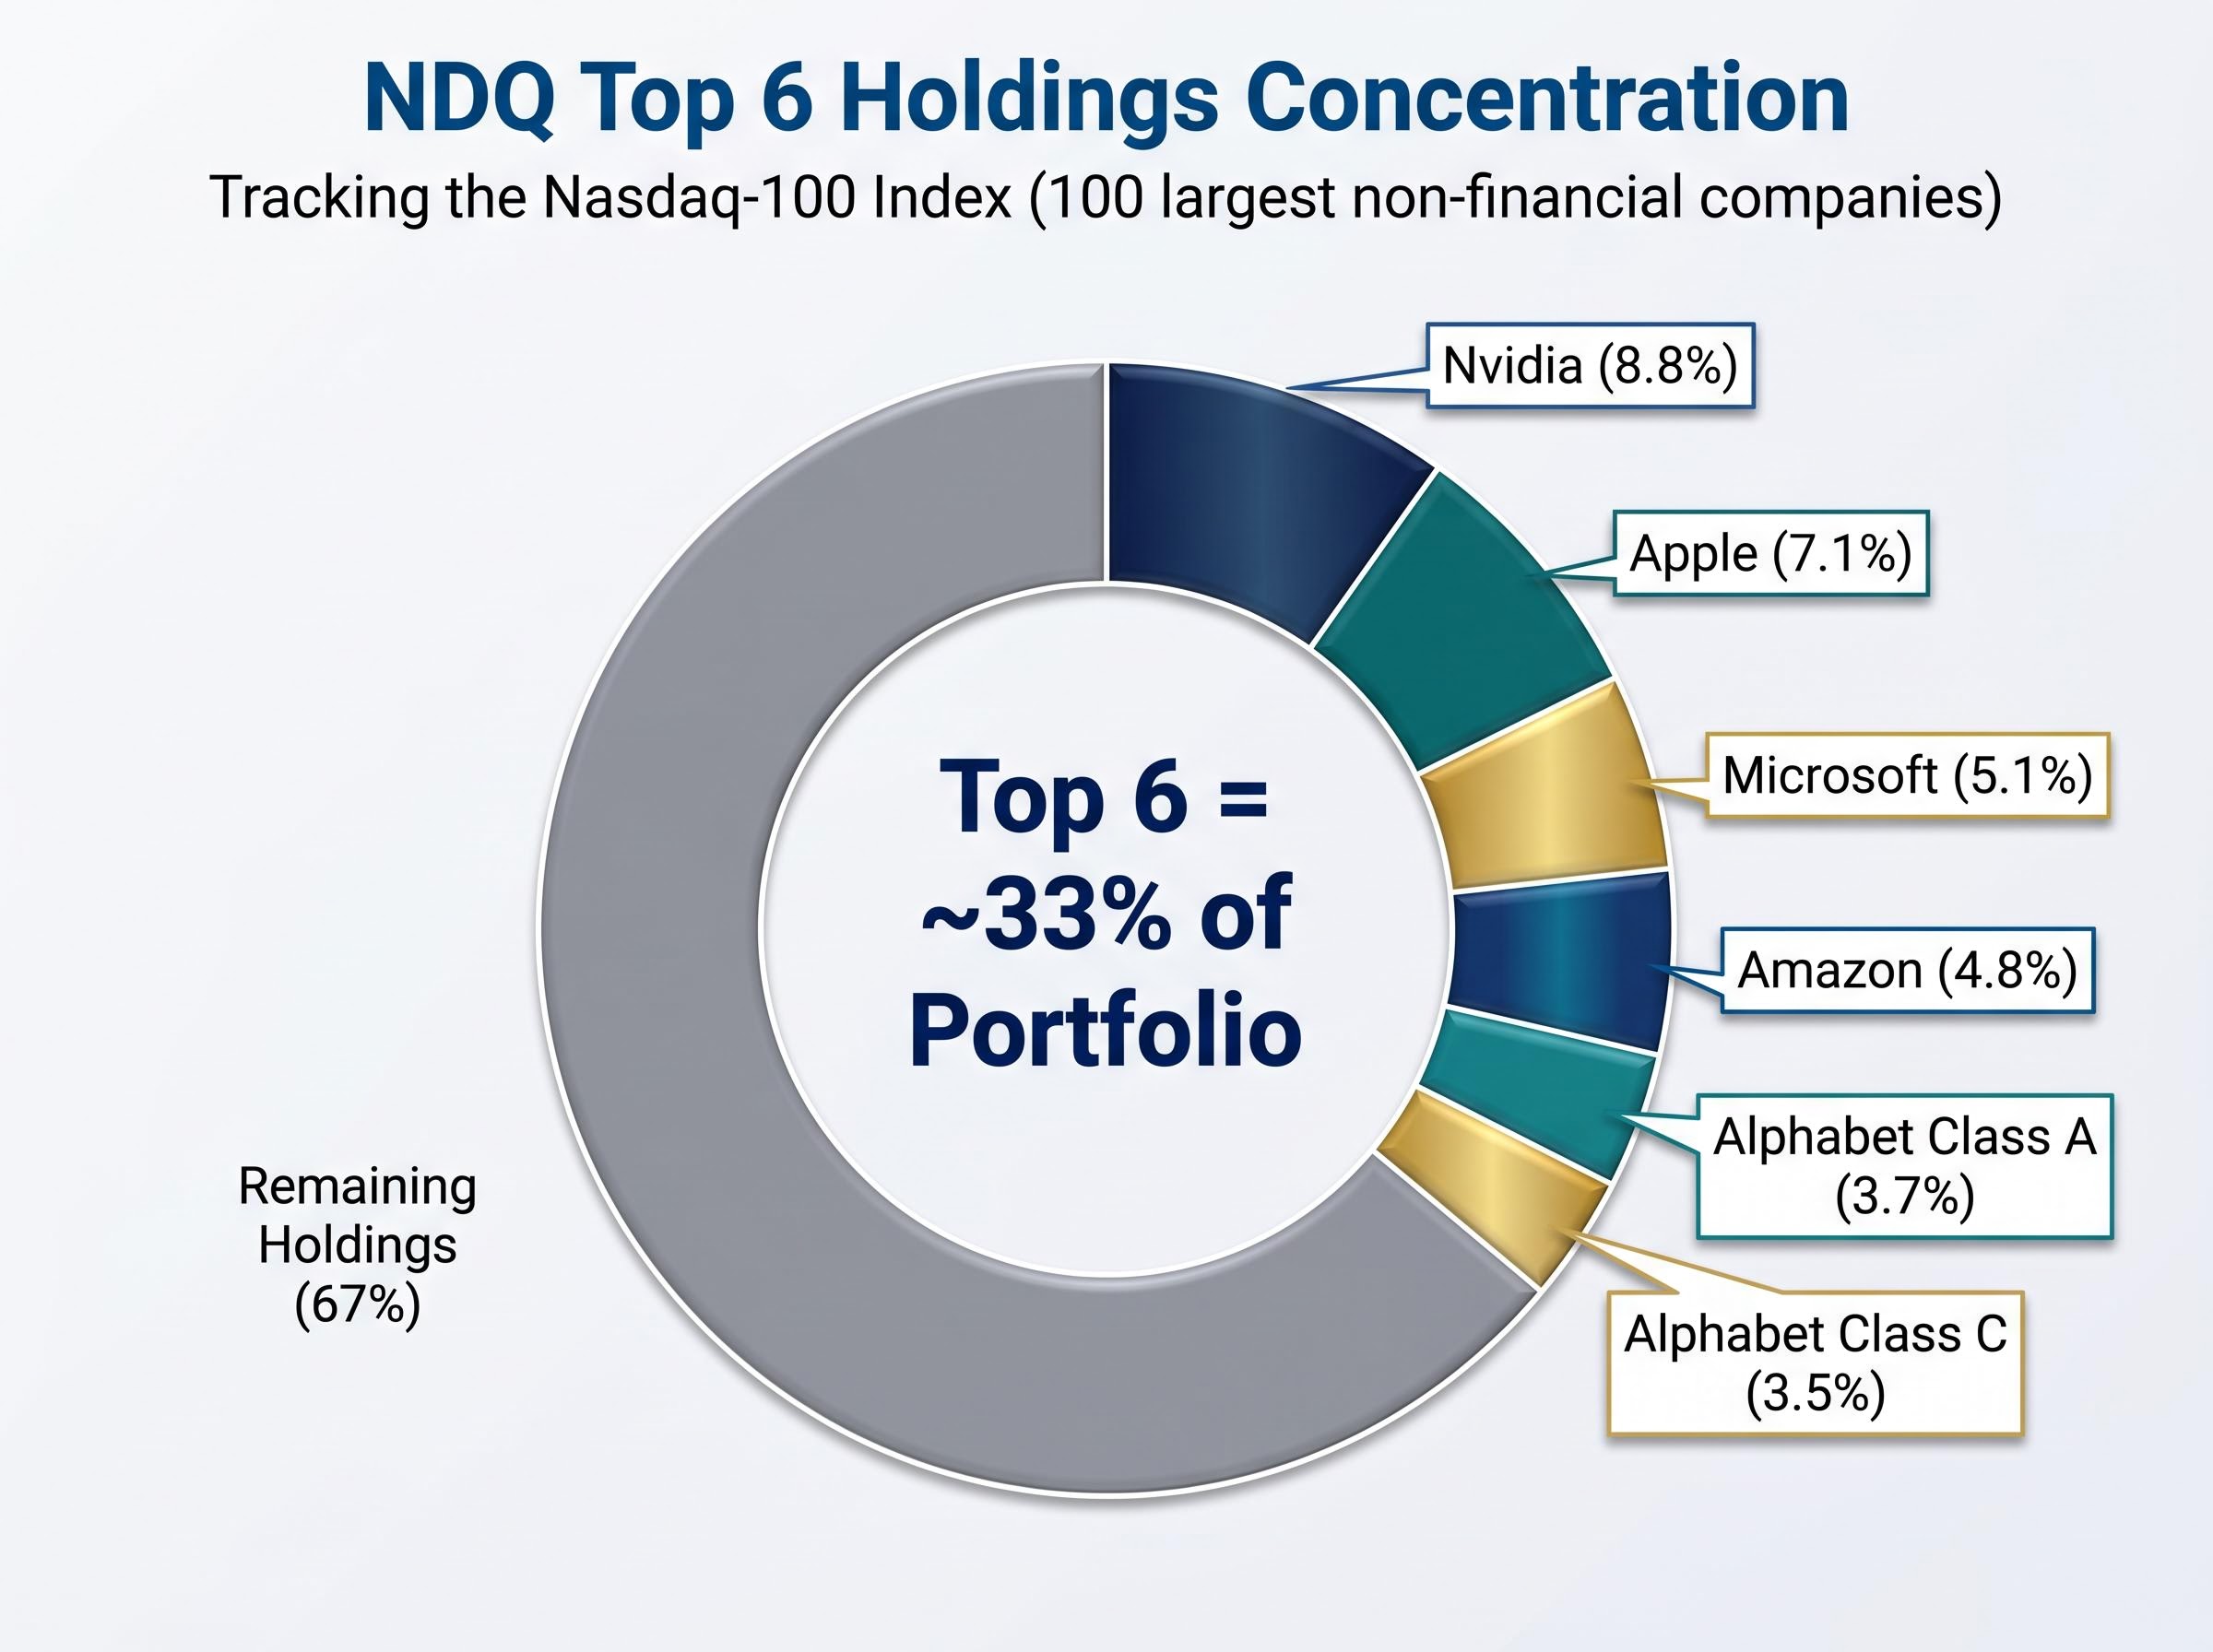
That said, the portfolio is concentrated. The top six holdings account for roughly a third of the fund’s total weight.
| Company | Portfolio weight |
|---|---|
| Nvidia | 8.8% |
| Apple | 7.1% |
| Microsoft | 5.1% |
| Amazon | 4.8% |
| Alphabet (Class A) | 3.7% |
| Alphabet (Class C) | 3.5% |
Approximately 33% of the portfolio sits in six companies. That concentration is both the source of NDQ’s historical outperformance and a structural risk factor worth acknowledging before sizing a position.
Key structural characteristics of the fund:
The BetaShares NDQ fund factsheet confirms the core structural details of the product, including the 0.48% p.a. management expense ratio, the Nasdaq-100 Index as the tracked benchmark, and the fund’s unhedged currency treatment, all of which are material inputs for Australian investors assessing total cost and return profile.
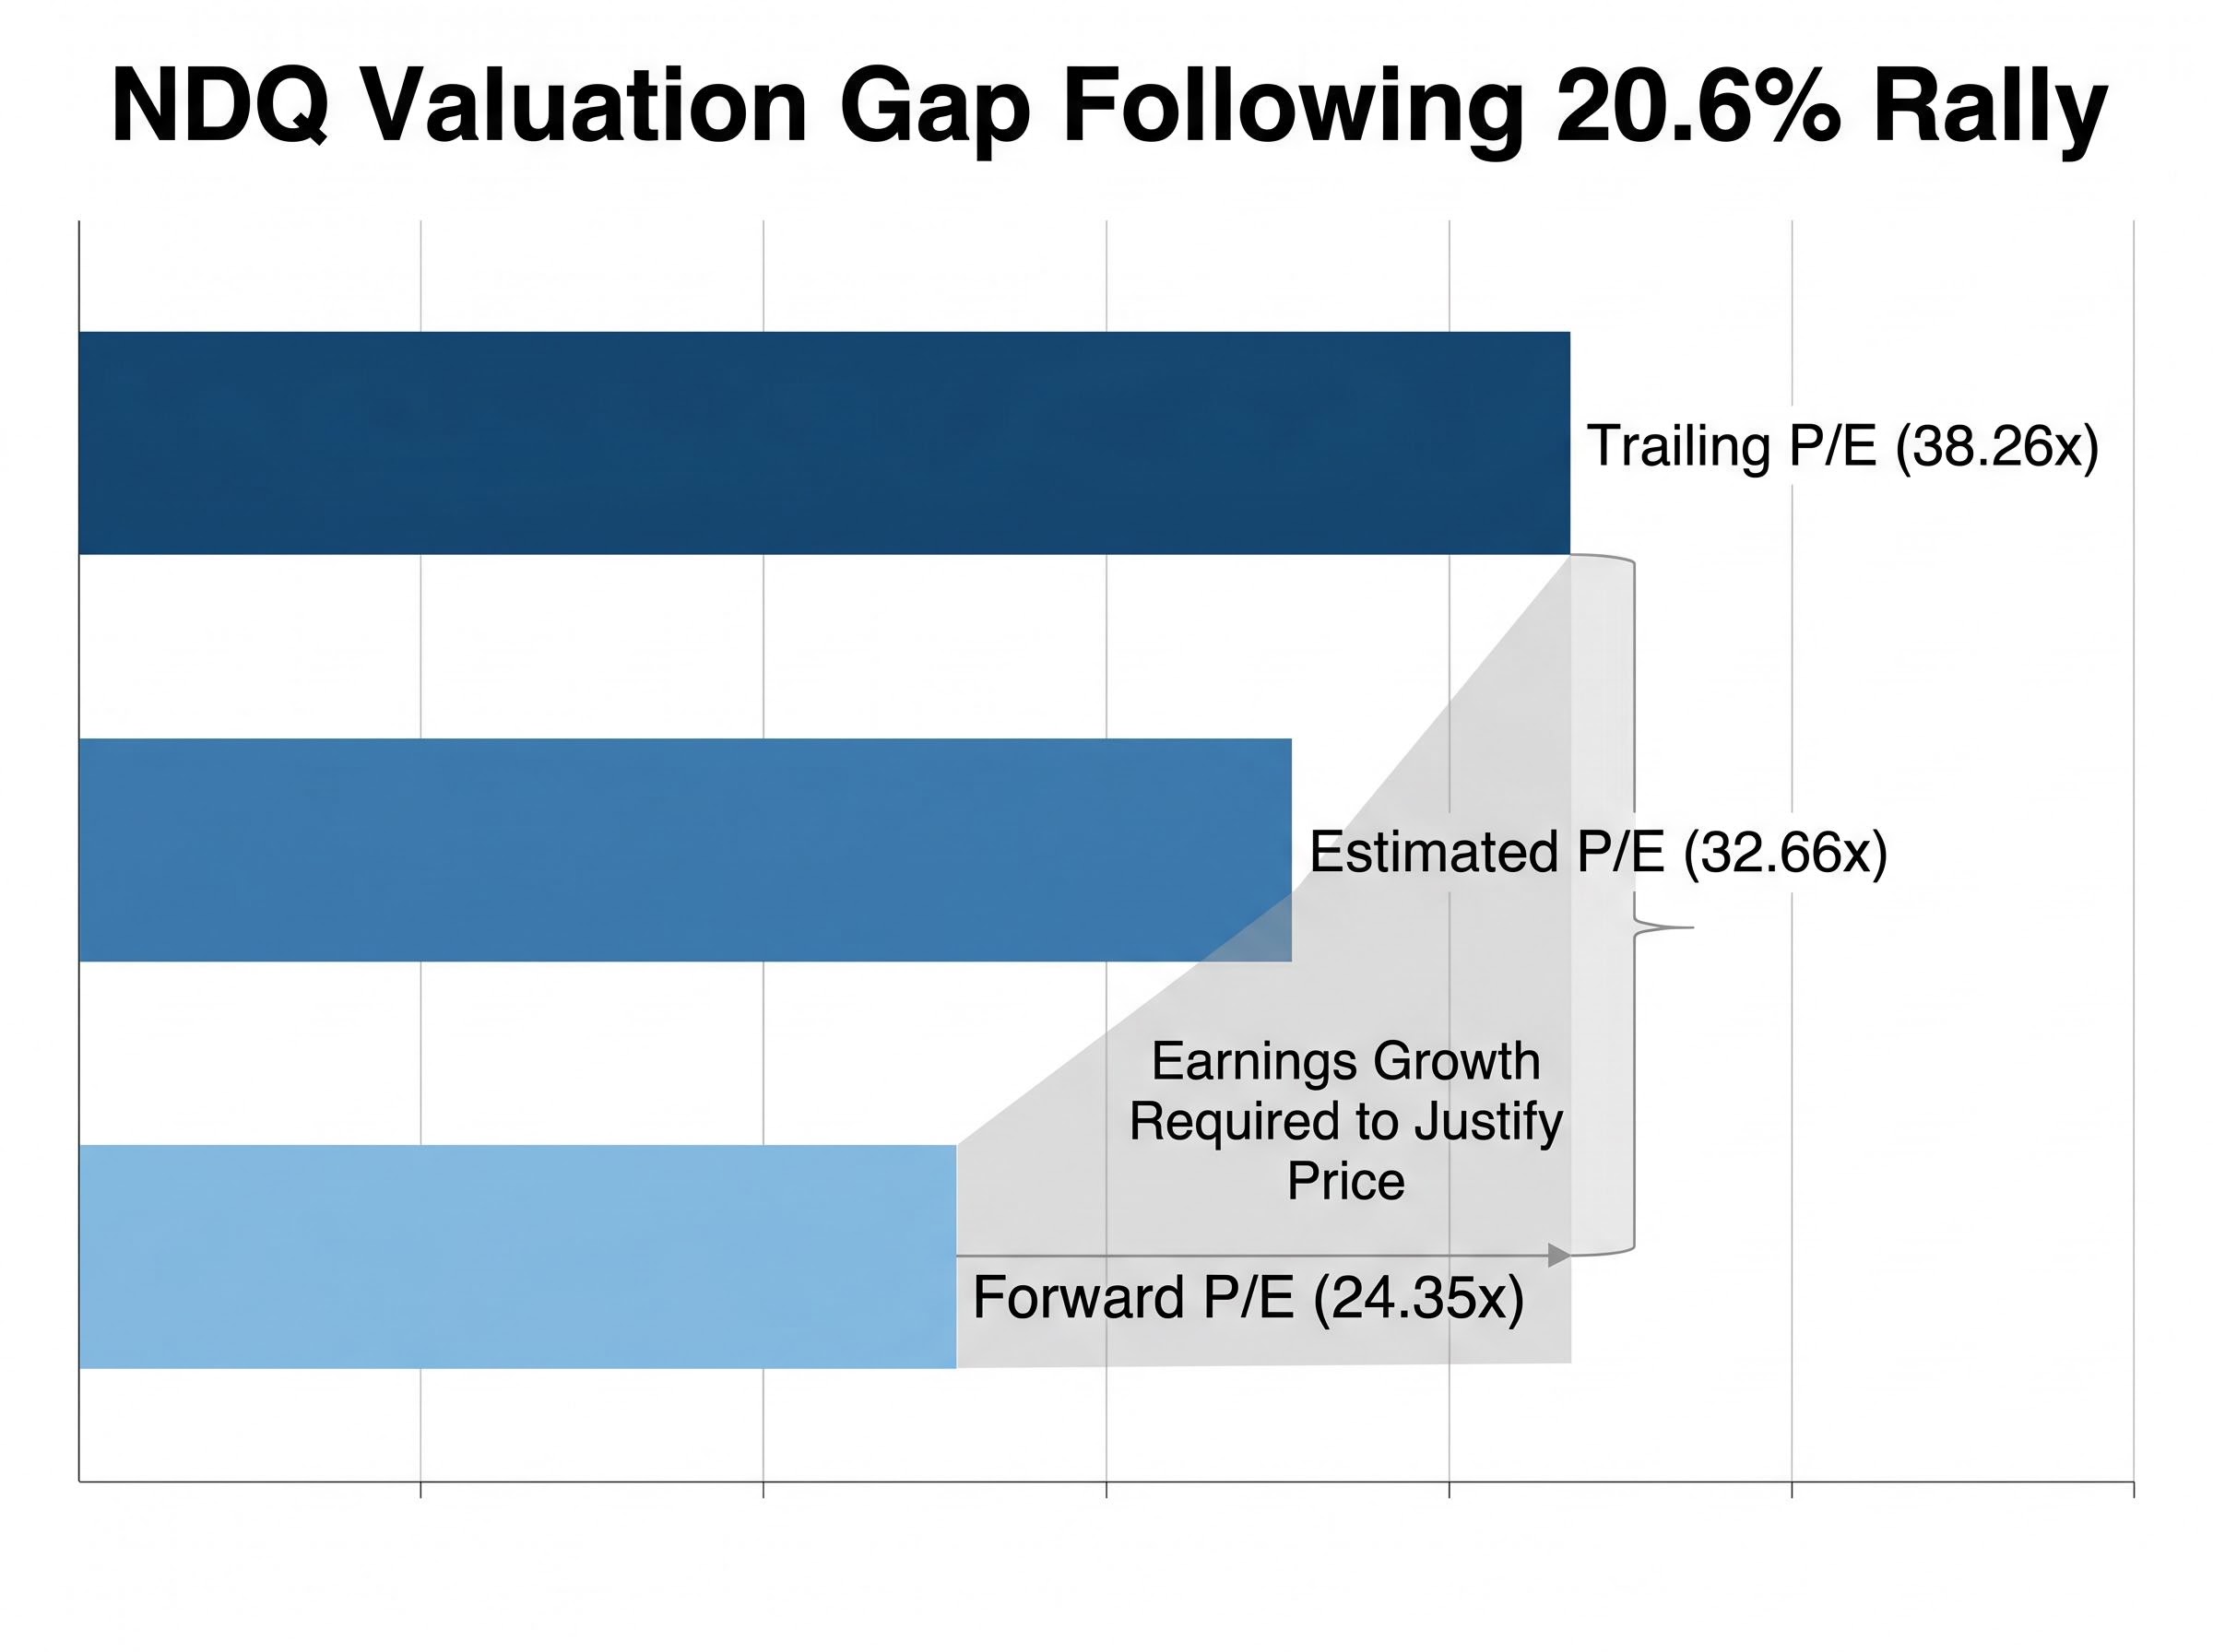
Three P/E metrics tell the valuation story, and the gaps between them matter more than any single figure.
| Metric | Value | What it signals |
|---|---|---|
| Forward P/E | ~24.35x | Reflects analyst expectations for earnings growth over the next 12 months |
| Estimated P/E | ~32.66x | Blends trailing actuals with near-term estimates; a mid-cycle snapshot |
| Trailing P/E | ~38.26x | Reflects only what has been earned to date; highest of the three |
The gap between the forward figure of 24.35x and the trailing figure of 38.26x represents the earnings growth the index must deliver to justify current prices. That gap is not a red flag on its own, but it does quantify the amount of optimism embedded in the price.
A trailing P/E of 38.26x signals that the market is pricing in significant future earnings delivery. If that delivery disappoints, the multiple has room to compress.
The elevated P/E at the index level is not an isolated data point: broader US equity valuation signals, including the Buffett Indicator at 223.6% and an unfavourable earnings yield versus Treasury yield spread, are simultaneously aligned in a way last seen at the peak of the dot-com cycle.
NDQ’s 2026 low of $46.56 sits approximately 22% below the current all-time high of $59.52. That is not historical trivia. It illustrates the volatility profile of an asset that could revisit those levels under adverse conditions. The rally from the 31 March close of $49.32 to the 11 May close compressed the window between opportunity and overextension in a matter of weeks.
Valuation alone rarely dictates short-term market direction. It does, however, determine the margin of safety available to a new investor, and at 38.26x trailing earnings, that margin is thin.
AI is not a peripheral consideration for NDQ holders. It is the thesis. The fund’s largest holdings, Nvidia, Microsoft, Alphabet, Amazon, and Meta Platforms, are directing substantial capital toward AI infrastructure, making AI the central driver of both the 2026 rally and the earnings growth baked into forward estimates.
Hyperscaler data centre buildouts have accelerated through 2025 and into 2026. Nvidia’s position as NDQ’s single largest holding at 8.8% makes the fund particularly sensitive to GPU demand cycles. The approximately 20.6% rally from late March to mid-May is broadly consistent with continued AI-driven capital expenditure sentiment. BetaShares’ geared Nasdaq-100 ETF (GNDQ) posted a 36.46% one-year return to 30 April 2026, reflecting leveraged amplification of the same underlying trend.
There is an important distinction between “these companies are spending heavily on AI” and “these companies are generating outsized returns from AI.” The capital expenditure is confirmed and large. The revenue generation at scale remains the unresolved element.
Earnings estimates embedded in the forward P/E of 24.35x assume the gap between spending and revenue realisation narrows materially over the next 12-24 months. If it does, the current valuation looks reasonable. If it does not, the trailing P/E of 38.26x becomes harder to sustain.
The AI capex-to-revenue lag is not unique to any single holding: across the semiconductor sector, Morningstar has identified an 18-24 month gap between infrastructure deployment and the revenue realisation required to validate current price-to-earnings multiples, a timeline that maps directly onto the earnings assumptions embedded in NDQ’s forward P/E of 24.35x.
Most analysis of the Nasdaq-100 is written from a US-dollar perspective. Australian NDQ holders face three additional layers of risk that affect their actual return in AUD.
The AUD/USD currency dynamics that currently benefit NDQ holders are shaped by more than rate differentials: Australia’s elevated LNG and gold export revenues have provided relative support for the Australian dollar even as energy import costs and domestic CPI at 4.6% create offsetting downward pressure.
AUD/USD: 0.7221 (12 May 2026). At this level, the relatively weak Australian dollar has been a tailwind for AUD-denominated NDQ returns. A reversal in this dynamic would reduce returns for Australian holders independently of index performance.
Australian investors in NDQ are not simply taking a view on US technology companies. They are simultaneously taking a view on AUD/USD, US-China trade policy, and Federal Reserve rate direction.
NDQ’s track record supports conviction in the underlying portfolio quality. The fund has delivered a 24.94% total return over the one year to 30 April 2026, a 16.51% annualised return over five years, and a 19.22% annualised return since inception.
Those figures reflect a fund that has compounded effectively through multiple market cycles. They do not, however, make any particular entry point equally attractive. A 20.6% rally in six weeks means the margin of safety for a new full position at today’s price is lower than it was at the 2026 low of $46.56.
The 2026 intraday high of $59.63 and the 2026 low of $46.56 represent an approximately 22% range within a single calendar year. Drawdowns of that magnitude are a recurring feature of this asset class, not exceptional events.
Position sizing is the one variable entirely within the investor’s control. A staged entry does not require predicting market direction; it acknowledges that the risk profile of a full position at an all-time high differs from a partial allocation that preserves optionality.
This approach suits a retail Australian investor who holds conviction in the portfolio’s long-term quality but recognises that entering at a record high carries near-term risk that a staged strategy can partially manage.
For investors who want to work through the mechanics and tax implications of a staged deployment in more detail, our dedicated guide to staged entry strategies for ASX investors covers the historical lump-sum versus DCA performance gap, the CGT parcel implications of multiple entry points, and a four-step framework for setting predetermined triggers rather than making real-time timing decisions.
The portfolio quality is genuine. The AI growth driver is real, though its monetisation timeline remains the unresolved variable. The valuation at 38.26x trailing earnings reflects optimistic assumptions that require delivery.
The commercial question is not whether NDQ is a good fund. A cumulative total return of approximately 624% since inception and $8.59 billion in assets under management provide their own answer.
Since its inception in May 2015, NDQ has delivered a cumulative total return of approximately 624%, reaching successive all-time highs with each prior peak eventually surpassed.
The question is how to size an entry given where prices sit today. Long-term investors who have owned NDQ through previous all-time highs and subsequent drawdowns have consistently been rewarded. Short-term volatility at current valuations, however, is a genuine and accepted feature of the position.
This article is for informational purposes only and should not be considered financial advice. Investors should conduct their own research and consult with financial professionals before making investment decisions. Past performance does not guarantee future results. Financial projections are subject to market conditions and various risk factors.
The BetaShares Nasdaq 100 ETF (ASX: NDQ) is an Australian exchange-traded fund that tracks the Nasdaq-100 Index, which holds the 100 largest non-financial companies listed on the US Nasdaq exchange, including Nvidia, Apple, Microsoft, and Amazon. It has a management expense ratio of 0.48% per annum and is unhedged, meaning returns for Australian investors are affected by AUD/USD exchange rate movements.
As of May 2026, the Nasdaq-100 trades at a trailing price-to-earnings ratio of 38.26x and a forward P/E of 24.35x, meaning the market has priced in significant future earnings growth. The gap between these two figures represents the earnings delivery the index must achieve to justify current prices, leaving a thin margin of safety for new investors entering at record highs.
NDQ is unhedged, so its AUD-denominated returns are directly influenced by the AUD/USD exchange rate. With the Australian dollar at 0.7221 as of May 2026, the relatively weak local currency has acted as a tailwind, inflating the AUD value of the fund's USD-priced assets. If the Australian dollar strengthens, this tailwind reverses and reduces returns even if the underlying Nasdaq-100 index performs well.
Since its inception in May 2015, the BetaShares Nasdaq 100 ETF has delivered an annualised return of 19.22% per annum and a cumulative total return of approximately 624%, growing its assets under management to $8.59 billion as at May 2026. Over the one year to 30 April 2026, the fund returned 24.94%, and over five years it delivered a 16.51% annualised return.
A staged entry strategy involves committing only a fraction of your intended allocation (for example, one-third) at the current price, then deploying the remaining capital at predetermined price levels or time intervals such as a 5-10% pullback or monthly additions. This approach manages the near-term risk of entering at a record high without requiring an investor to predict market direction, while still maintaining exposure to long-term upside.