
Australian investors who hold a portfolio built around the big-four banks, BHP, and Rio Tinto are not as diversified as they might think. Beneath the surface, that portfolio is a concentrated bet on a narrow set of domestic economic forces: Australian interest rates, commodity prices, and local consumer confidence. With the ASX structurally weighted toward financials and materials, this is not an edge case. It is the default position for the majority of retail and self-managed superannuation fund (SMSF) portfolios. This analysis explains why that concentration creates a real vulnerability, how the Nasdaq 100 index offers a structurally different exposure profile, what the trade-offs of accessing that exposure through the NDQ ETF look like in practice, and how to assess whether an allocation fits a long-horizon Australian portfolio.
The ASX concentration problem most Australian portfolios already have
Consider what a typical Australian retail portfolio actually holds. The big-four banks sit at the core, usually for their dividend yield and franking credits. BHP and Rio Tinto provide resources exposure. A handful of other domestic names round out the edges. On the surface, this looks like a diversified equity portfolio. Under the hood, it is a portfolio where the largest positions are all sensitive to the same handful of variables.
When the Reserve Bank of Australia adjusts interest rates, bank margins shift and bank share prices follow. When iron ore or copper prices fall, resources stocks drag. When Australian consumer confidence weakens, domestic earnings across the board compress. These forces do not always move in isolation; in a domestic downturn, they can correlate sharply.
The ASX 200’s well-documented dominance by financials and materials means this is not a quirk of individual stock selection. It is a structural feature of the index itself.
ASX 200 concentration risk is more acute than the index’s 200-stock label suggests, with financials and materials together accounting for more than 50% of the index by market-cap weight and VanEck research showing two stocks alone have historically represented approximately 22% of a typical cap-weighted Australian equity portfolio.
Why this is structural, not accidental
Franking credits have historically rewarded Australian investors for holding domestic dividend payers, particularly banks. Familiarity bias reinforces the pattern: investors buy what they know, and what they know is listed on the ASX. SMSF investors carry this concentration most acutely, because domestic equities remain the default vehicle for generating the franked income that supports retirement cash flows.
ATO quarterly statistics on SMSF asset allocation confirm that listed shares represent approximately 28% of total SMSF assets, a figure that underscores how heavily self-managed funds are anchored to domestic equity markets rather than distributed across international exposures.
The three primary vulnerability vectors of an ASX-concentrated portfolio:
- Interest rate sensitivity through bank holdings, where rate decisions directly affect margins and share prices
- Commodity price sensitivity through resources exposure, where global demand cycles drive earnings
- Domestic economic cycle sensitivity overall, where the majority of ASX-listed companies generate revenue in Australian dollars within the Australian economy
When big ASX news breaks, our subscribers know first
What the Nasdaq 100 actually contains and why it looks nothing like the ASX
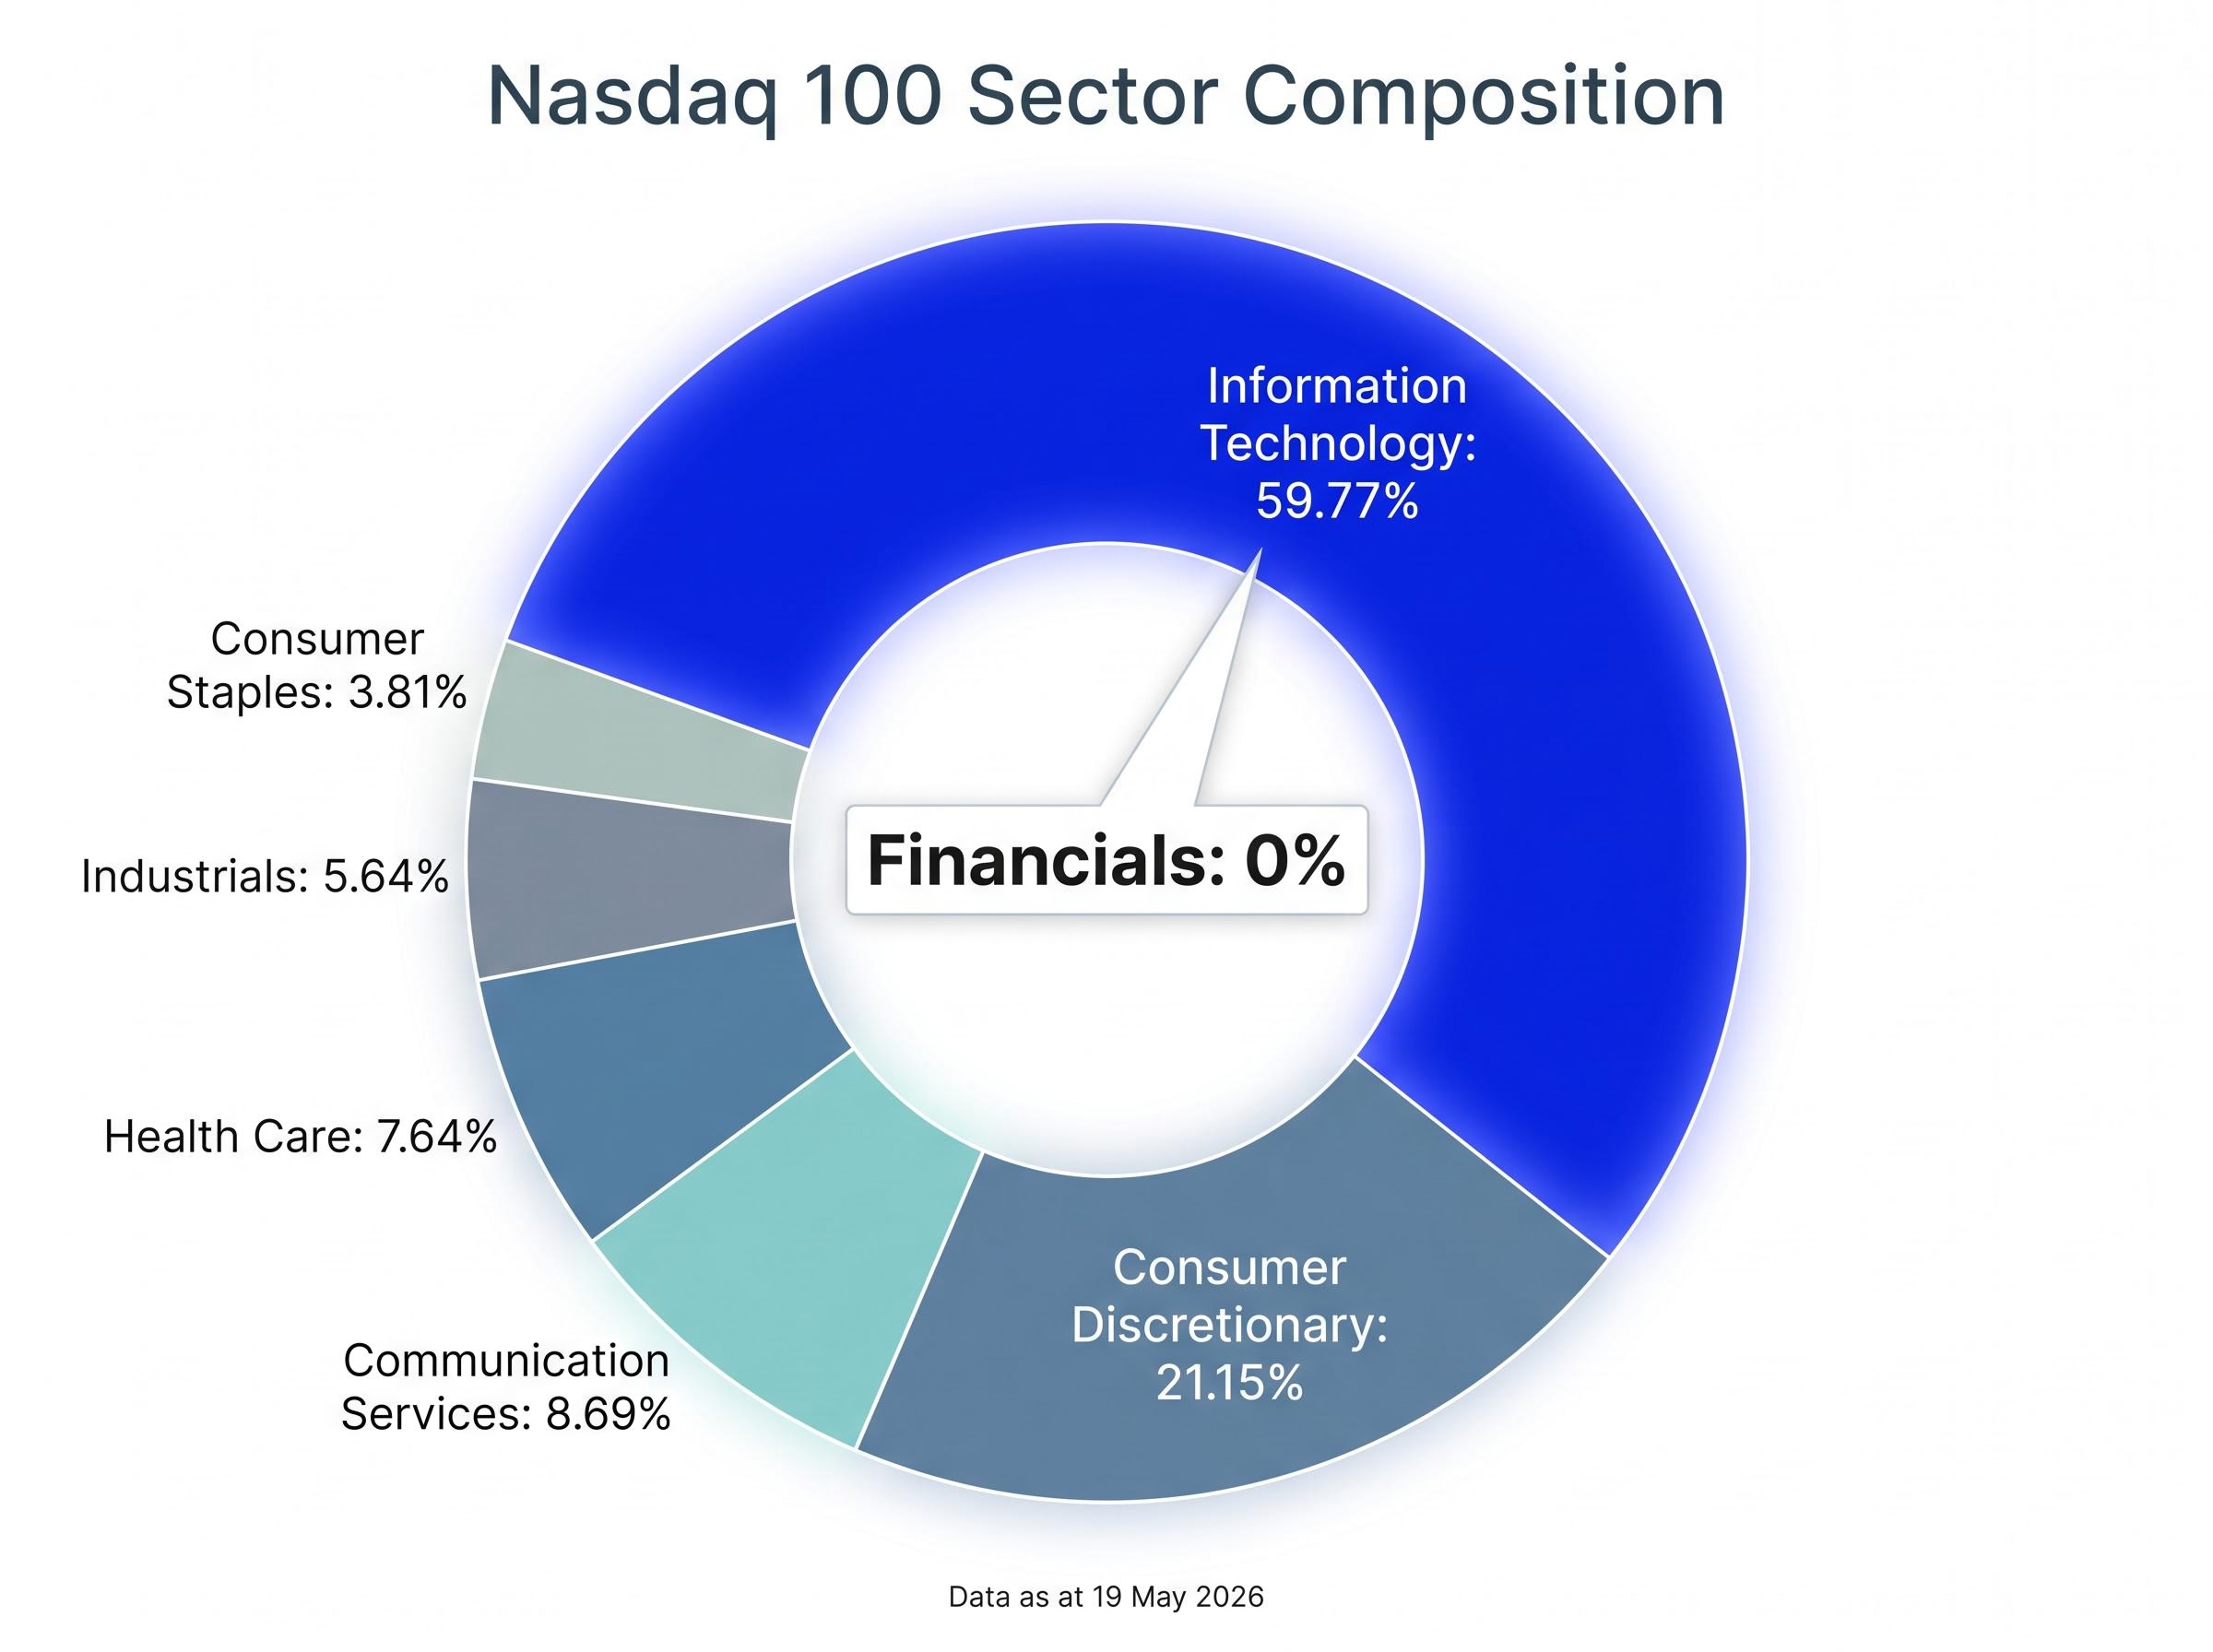
The Nasdaq 100 index is built from 100 of the largest non-financial companies listed on the Nasdaq exchange. Its sector composition, as at 19 May 2026, tells its own story.
| Sector | Weight (%) |
|---|---|
| Information Technology | 59.77% |
| Consumer Discretionary | 21.15% |
| Communication Services | 8.69% |
| Health Care | 7.64% |
| Industrials | 5.64% |
| Consumer Staples | 3.81% |
Nearly 60% of the index sits in information technology. Consumer discretionary accounts for another 21%. The index spans globally dominant businesses across AI, cloud computing, semiconductors, digital advertising, and ecommerce, companies that generate revenue across multiple currencies, geographies, and end markets.
Structural design feature: The Nasdaq 100 carries 0% financial sector exposure. This is not an oversight. The index excludes financials by construction, which structurally decouples it from the interest rate sensitivity that dominates ASX bank stocks.
That single design feature makes the Nasdaq 100’s return profile fundamentally different from anything the ASX offers. Where an Australian investor’s domestic holdings move with RBA decisions and local credit conditions, the Nasdaq 100 moves with global technology earnings, US consumer spending, and enterprise adoption of digital infrastructure.
Why adding NDQ can reduce a portfolio’s dependence on Australian economic conditions
Diversification works when two assets respond to different underlying forces. An ASX-heavy portfolio and the Nasdaq 100 are driven by structurally different variables, which is precisely what makes the combination effective.
An allocation to the NDQ ETF means a portion of a portfolio’s returns are determined by global technology earnings, AI adoption curves, and international consumer spending rather than domestic bank margins and iron ore prices. The forces that drive the Nasdaq 100 up or down on any given quarter have limited overlap with the forces that move the ASX’s dominant sectors.
From a practical standpoint, NDQ provides this international exposure through a single ASX-listed transaction. There is no need to open a foreign brokerage account, manage currency conversion, or select individual international companies. One trade on a standard Australian brokerage account delivers exposure to the full Nasdaq 100 index.
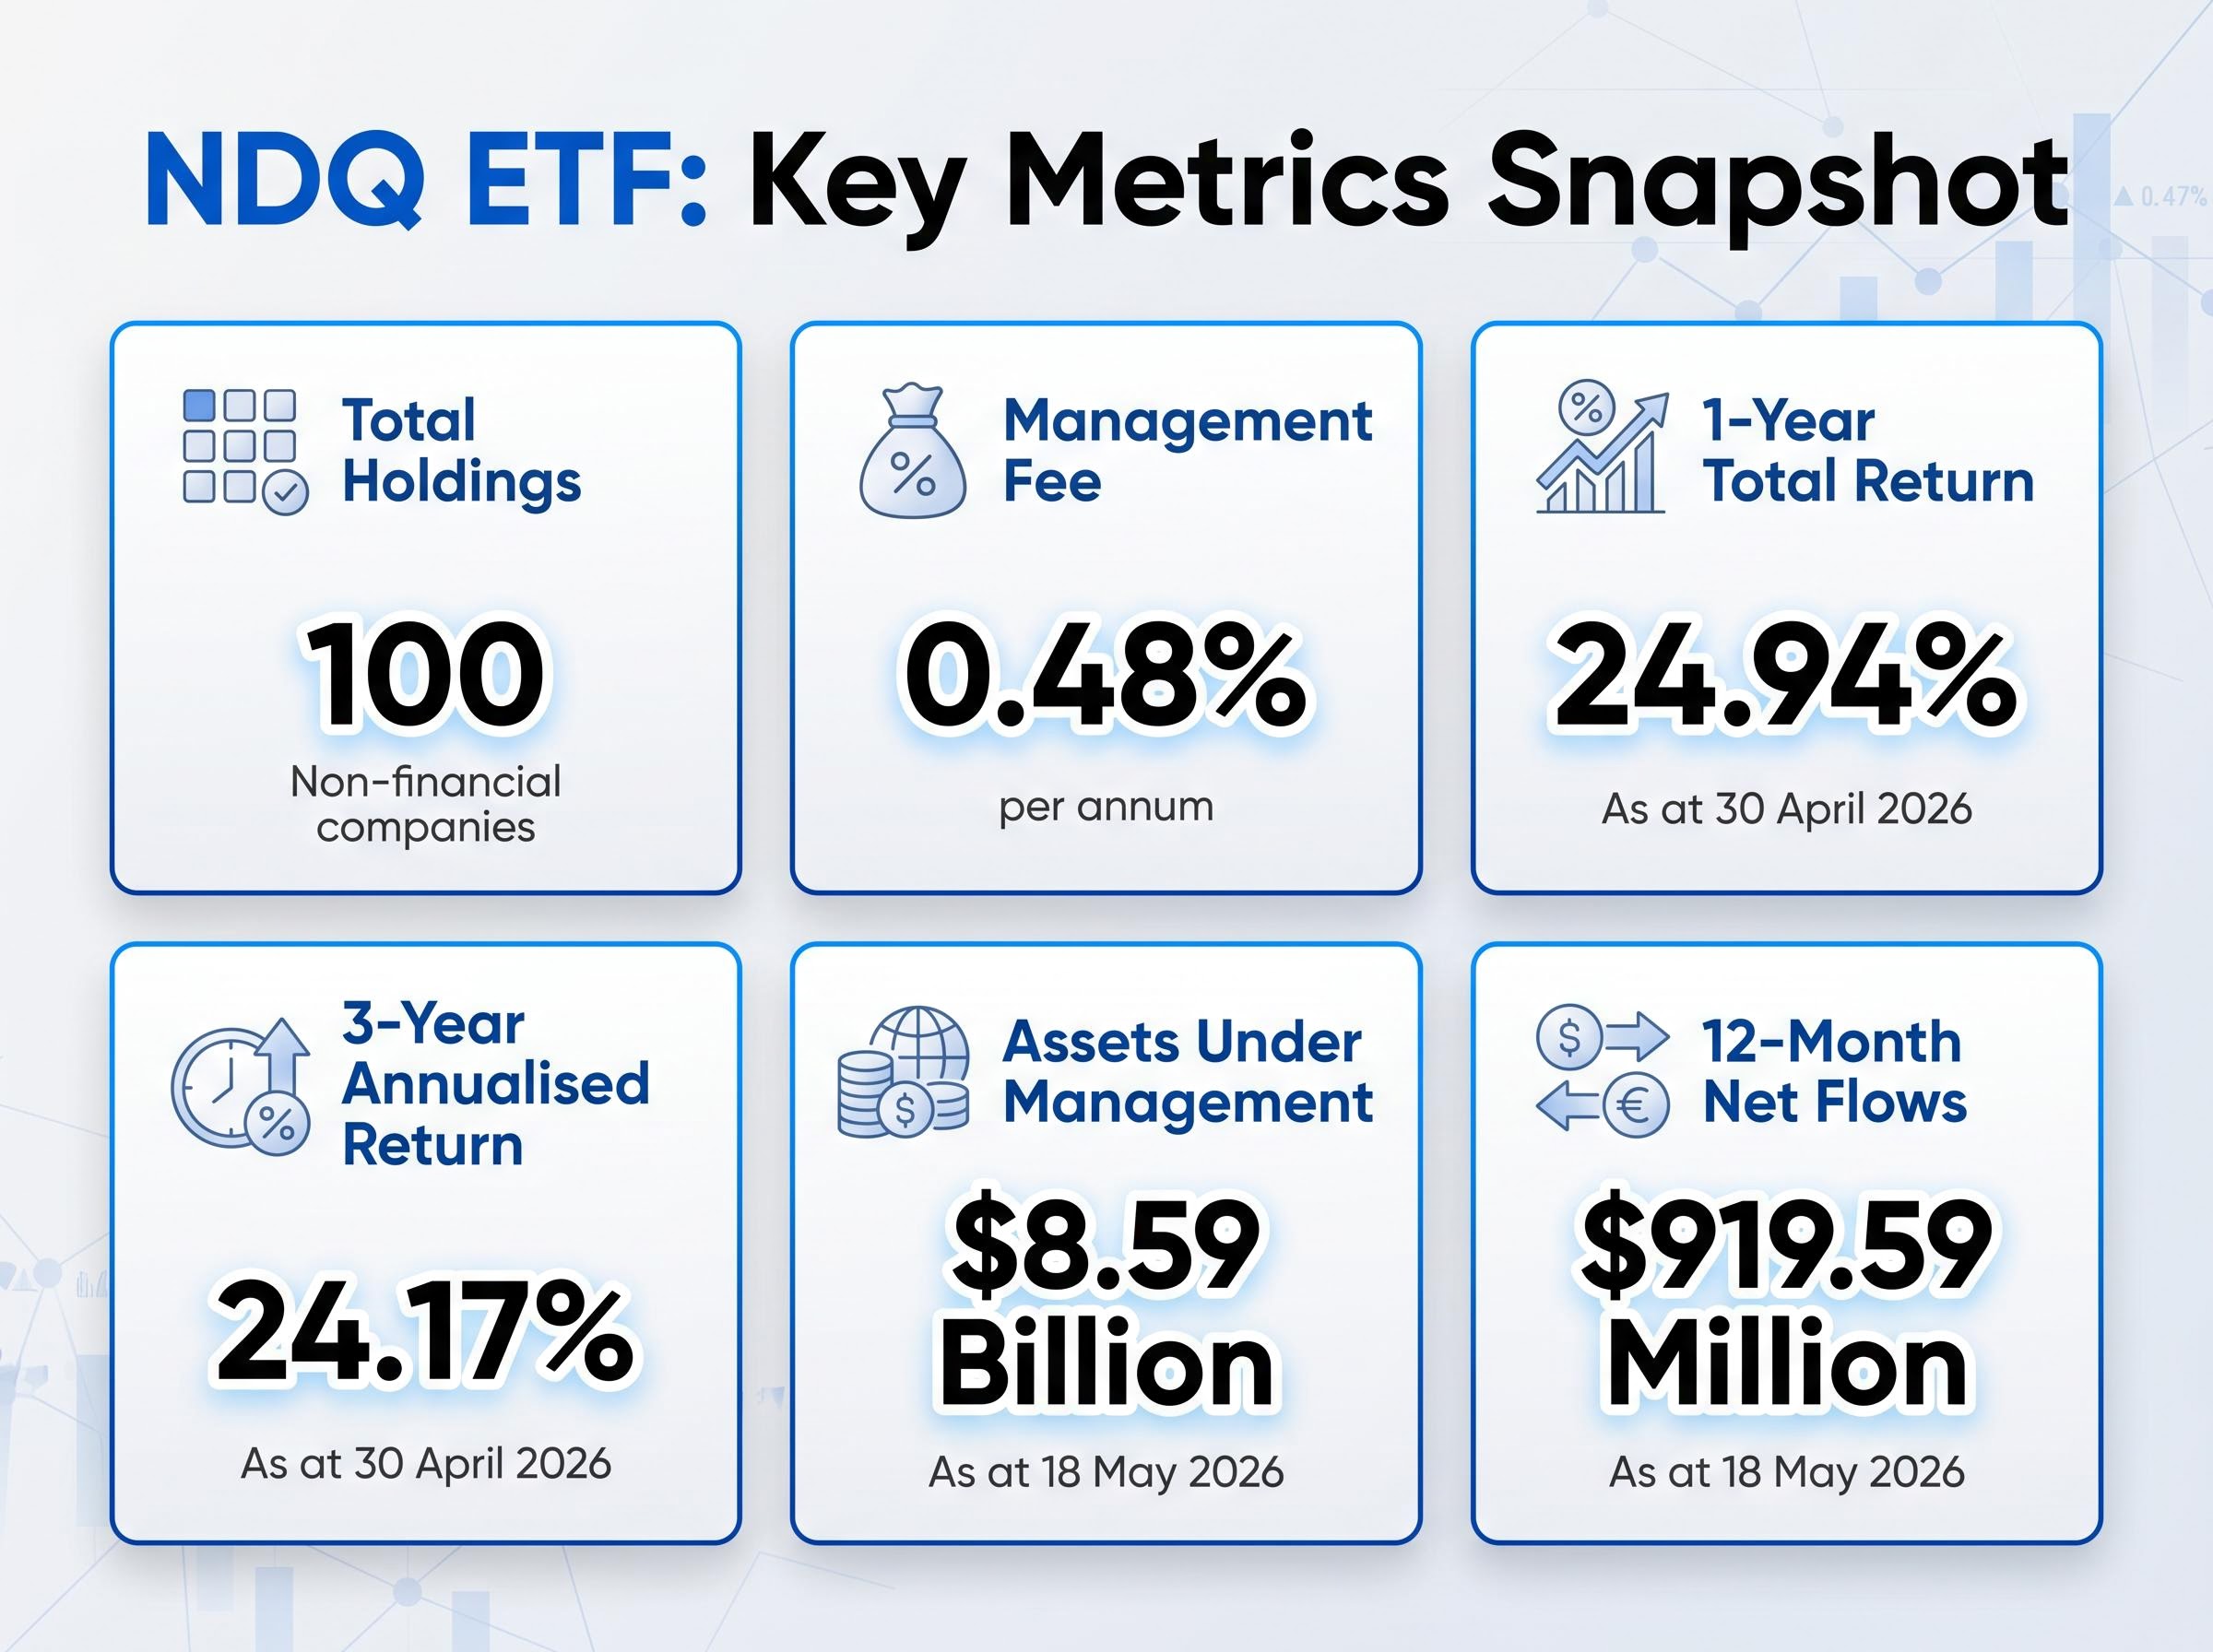
The scale of investor adoption reinforces the point. As at 18 May 2026, the fund held $8.59 billion in assets under management, with net fund flows of approximately $919.59 million over the most recent 12 months, according to BetaShares data. A large and growing cohort of Australian investors has already reached the same conclusion about the diversification gap in their portfolios.
The three distinct return drivers that an NDQ allocation introduces to an ASX-heavy portfolio:
- Global technology earnings growth, driven by enterprise software, cloud computing, and semiconductor demand
- US and international consumer spending, captured through the index’s consumer discretionary and communication services weightings
- AI and digital infrastructure adoption, a multi-year structural trend reflected in the index’s largest constituents
Understanding the Nasdaq 100’s sector concentration and what it means for risk
The diversification case for NDQ is sound, but it carries a qualification that investors need to understand clearly. The Nasdaq 100 is itself a highly concentrated index. With 59.77% in information technology as at 19 May 2026, NDQ is not a broad global equity fund. It is a high-conviction exposure to a specific sector cluster.
This concentration creates a distinct risk profile. Technology stocks, particularly long-duration growth companies, are sensitive to interest rate expectations. When rates rise or are expected to rise, the present value of future earnings compresses, and growth stock valuations tend to follow. Periods of rising rates have historically weighed more heavily on the Nasdaq 100 than on broader indices with greater sector balance.
Nasdaq 100 valuation risk became concrete in May 2026 as the index’s 18% rally from April lows pushed momentum indicators into overbought territory at a defined resistance zone, with Nvidia trading at a trailing P/E of approximately 40-41 and Magnificent Seven earnings required to deliver verified AI revenue to justify those premiums.
Performance context: The NDQ ETF delivered a 3-year annualised return of 24.17% and a 1-year total return of 24.94% as at 30 April 2026, according to BetaShares. Past performance does not indicate future results. These figures reflect a specific period of strong technology sector performance.
The distinction matters for portfolio construction. NDQ solves one concentration problem (domestic Australian exposure) while introducing a different one (technology sector concentration). Recognising this asymmetry is what separates a considered allocation from an unconsidered one.
The three primary risk factors specific to the Nasdaq 100’s concentration:
- Technology sector valuation cycles, where sentiment shifts can produce sharp drawdowns in a sector that dominates the index
- Interest rate sensitivity on growth stocks, where rising rate expectations compress the valuations of long-duration earnings streams
- AI sentiment volatility, where rapid shifts in market expectations around artificial intelligence adoption can amplify short-term price swings
Who this allocation suits and the time horizon that makes it viable
The NDQ ETF is most structurally suited to investors with a long time horizon. Five years represents a minimum; ten years or more aligns more closely with the technology sector’s historical return pattern, which includes significant interim drawdowns that require time to recover.
The investor profile where this allocation makes the most sense includes:
A deliberate domestic and international split of approximately 60% global and 40% Australian equities is a commonly cited starting framework for accumulation investors who want to balance franking credit access with genuine geographic diversification, though the right ratio depends on existing superannuation allocations and income requirements that vary by investor.
- An existing ASX-heavy portfolio with meaningful concentration in financials and resources
- Tolerance for interim price volatility in exchange for long-term capital growth
- No near-term income requirement from this portion of the portfolio
- A preference for growth-oriented returns over yield
Investors who depend on franked income for their tax strategy should note that NDQ pays no franking credits. This is a structural feature of its international holdings, not an anomaly, and it affects the after-tax return calculation for SMSF investors specifically.
Franking credit entitlement varies significantly across investor structures: an SMSF in pension phase with a 0% tax rate can receive the full credit as a cash refund from the ATO, while an investor on the top marginal rate receives a partial offset, which is why two investors holding identical ASX bank shares can experience materially different after-tax dividend outcomes.
Cost and tax considerations for Australian investors
The fund’s management fee of 0.48% per annum reflects the cost of international index licensing and the operational infrastructure required to provide ASX-listed access to a US-domiciled index. In context, this sits above the fee level of broad domestic equity ETFs but remains reasonable for a product that eliminates the need for a foreign brokerage account or individual stock selection across 100 international holdings.
The absence of franking credits means the tax efficiency equation differs from a domestic equity ETF. SMSF investors whose cash flow strategy relies on franked dividend income should treat NDQ as a complement to, not a replacement for, their domestic income-generating holdings.
The diversification case is sound, but NDQ is a specific tool for a specific job
ASX concentration risk is real, measurable, and present in the majority of Australian retail and SMSF portfolios. The Nasdaq 100 offers genuinely different sector and geographic exposure, and the NDQ ETF is a practical, well-established vehicle for delivering that exposure through a single ASX transaction.
The qualification is equally clear. NDQ is a high-conviction technology sector allocation, not a catch-all international diversifier. It belongs as one component within a broader portfolio strategy, sized in proportion to an investor’s risk tolerance and time horizon.
The structural tailwinds that underpin the long-term case, global digital adoption, AI integration across enterprise and consumer markets, and the compounding effect of holding globally dominant businesses, remain intact. For an Australian investor with a decade-long horizon and an honest assessment of what their current portfolio actually holds, the case for allocating to NDQ is grounded in portfolio mechanics rather than speculation.
This article is for informational purposes only and should not be considered financial advice. Investors should conduct their own research and consult with financial professionals before making investment decisions. Past performance does not guarantee future results.