How the 2026 Budget and 4.9% Yields Affect ASX Share Investors
4 hrs ago


National Australia Bank reported half-year results on 4 May 2026 that left investors with two contradictory signals: a share price slipping roughly 1% in early trade, and an underlying profit growth figure of 6.4% that told a materially different story. The gap between those two readings is where the analytical value sits.
The headline cash earnings figure of $2.64 billion is the number most screens displayed first. It is also the number most likely to mislead. A $949 million after-tax accounting policy change, related to software capitalisation, compressed reported earnings in a way that obscures the operational result underneath. Strip that charge out, and adjusted cash earnings reached $3.59 billion. This piece separates the accounting noise from the operational signal, works through the credit quality picture, and identifies what the underlying numbers reveal about NAB’s actual financial position heading into the second half.
NAB’s share price traded at approximately $39.36 on results morning, down roughly 1% from the 1 May close of around $40.00-$40.155. Results were released at 10:30 AM AEST during active ASX trading, and the initial reaction pointed to earnings disappointment.
At first glance, the reported numbers supported that reading. Cash earnings of $2.64 billion and statutory net profit of $2.75 billion are not figures that typically produce enthusiasm.
Adjusted cash earnings, which strip out the large notable item, reached $3.59 billion, a figure that reframes the entire result.
The gap between $2.64 billion and $3.59 billion is not rounding error. It is the difference between a result that looks flat and one that shows growth. Understanding what sits between those two figures is the analytical starting point.
When a bank capitalises software development costs, it spreads the expense across multiple years rather than recognising it all at once. NAB changed this policy in the first half, choosing to accelerate the recognition of those costs. The result was a one-off amortisation charge of $1,347 million pre-tax ($949 million after tax).
This is not a write-down triggered by impaired assets or a failed project. It is a deliberate decision to clean up the balance sheet by bringing forward costs that would otherwise have trickled through future periods. NAB characterised it as a proactive balance sheet action.
The AASB 138 intangible assets standard sets the conditions under which software development costs qualify for capitalisation versus immediate expensing, meaning any policy change in this area flows directly through to reported earnings in the period the change is adopted.
The charge matters because it distorts reported earnings without reflecting any change in how the bank actually performed during the half:
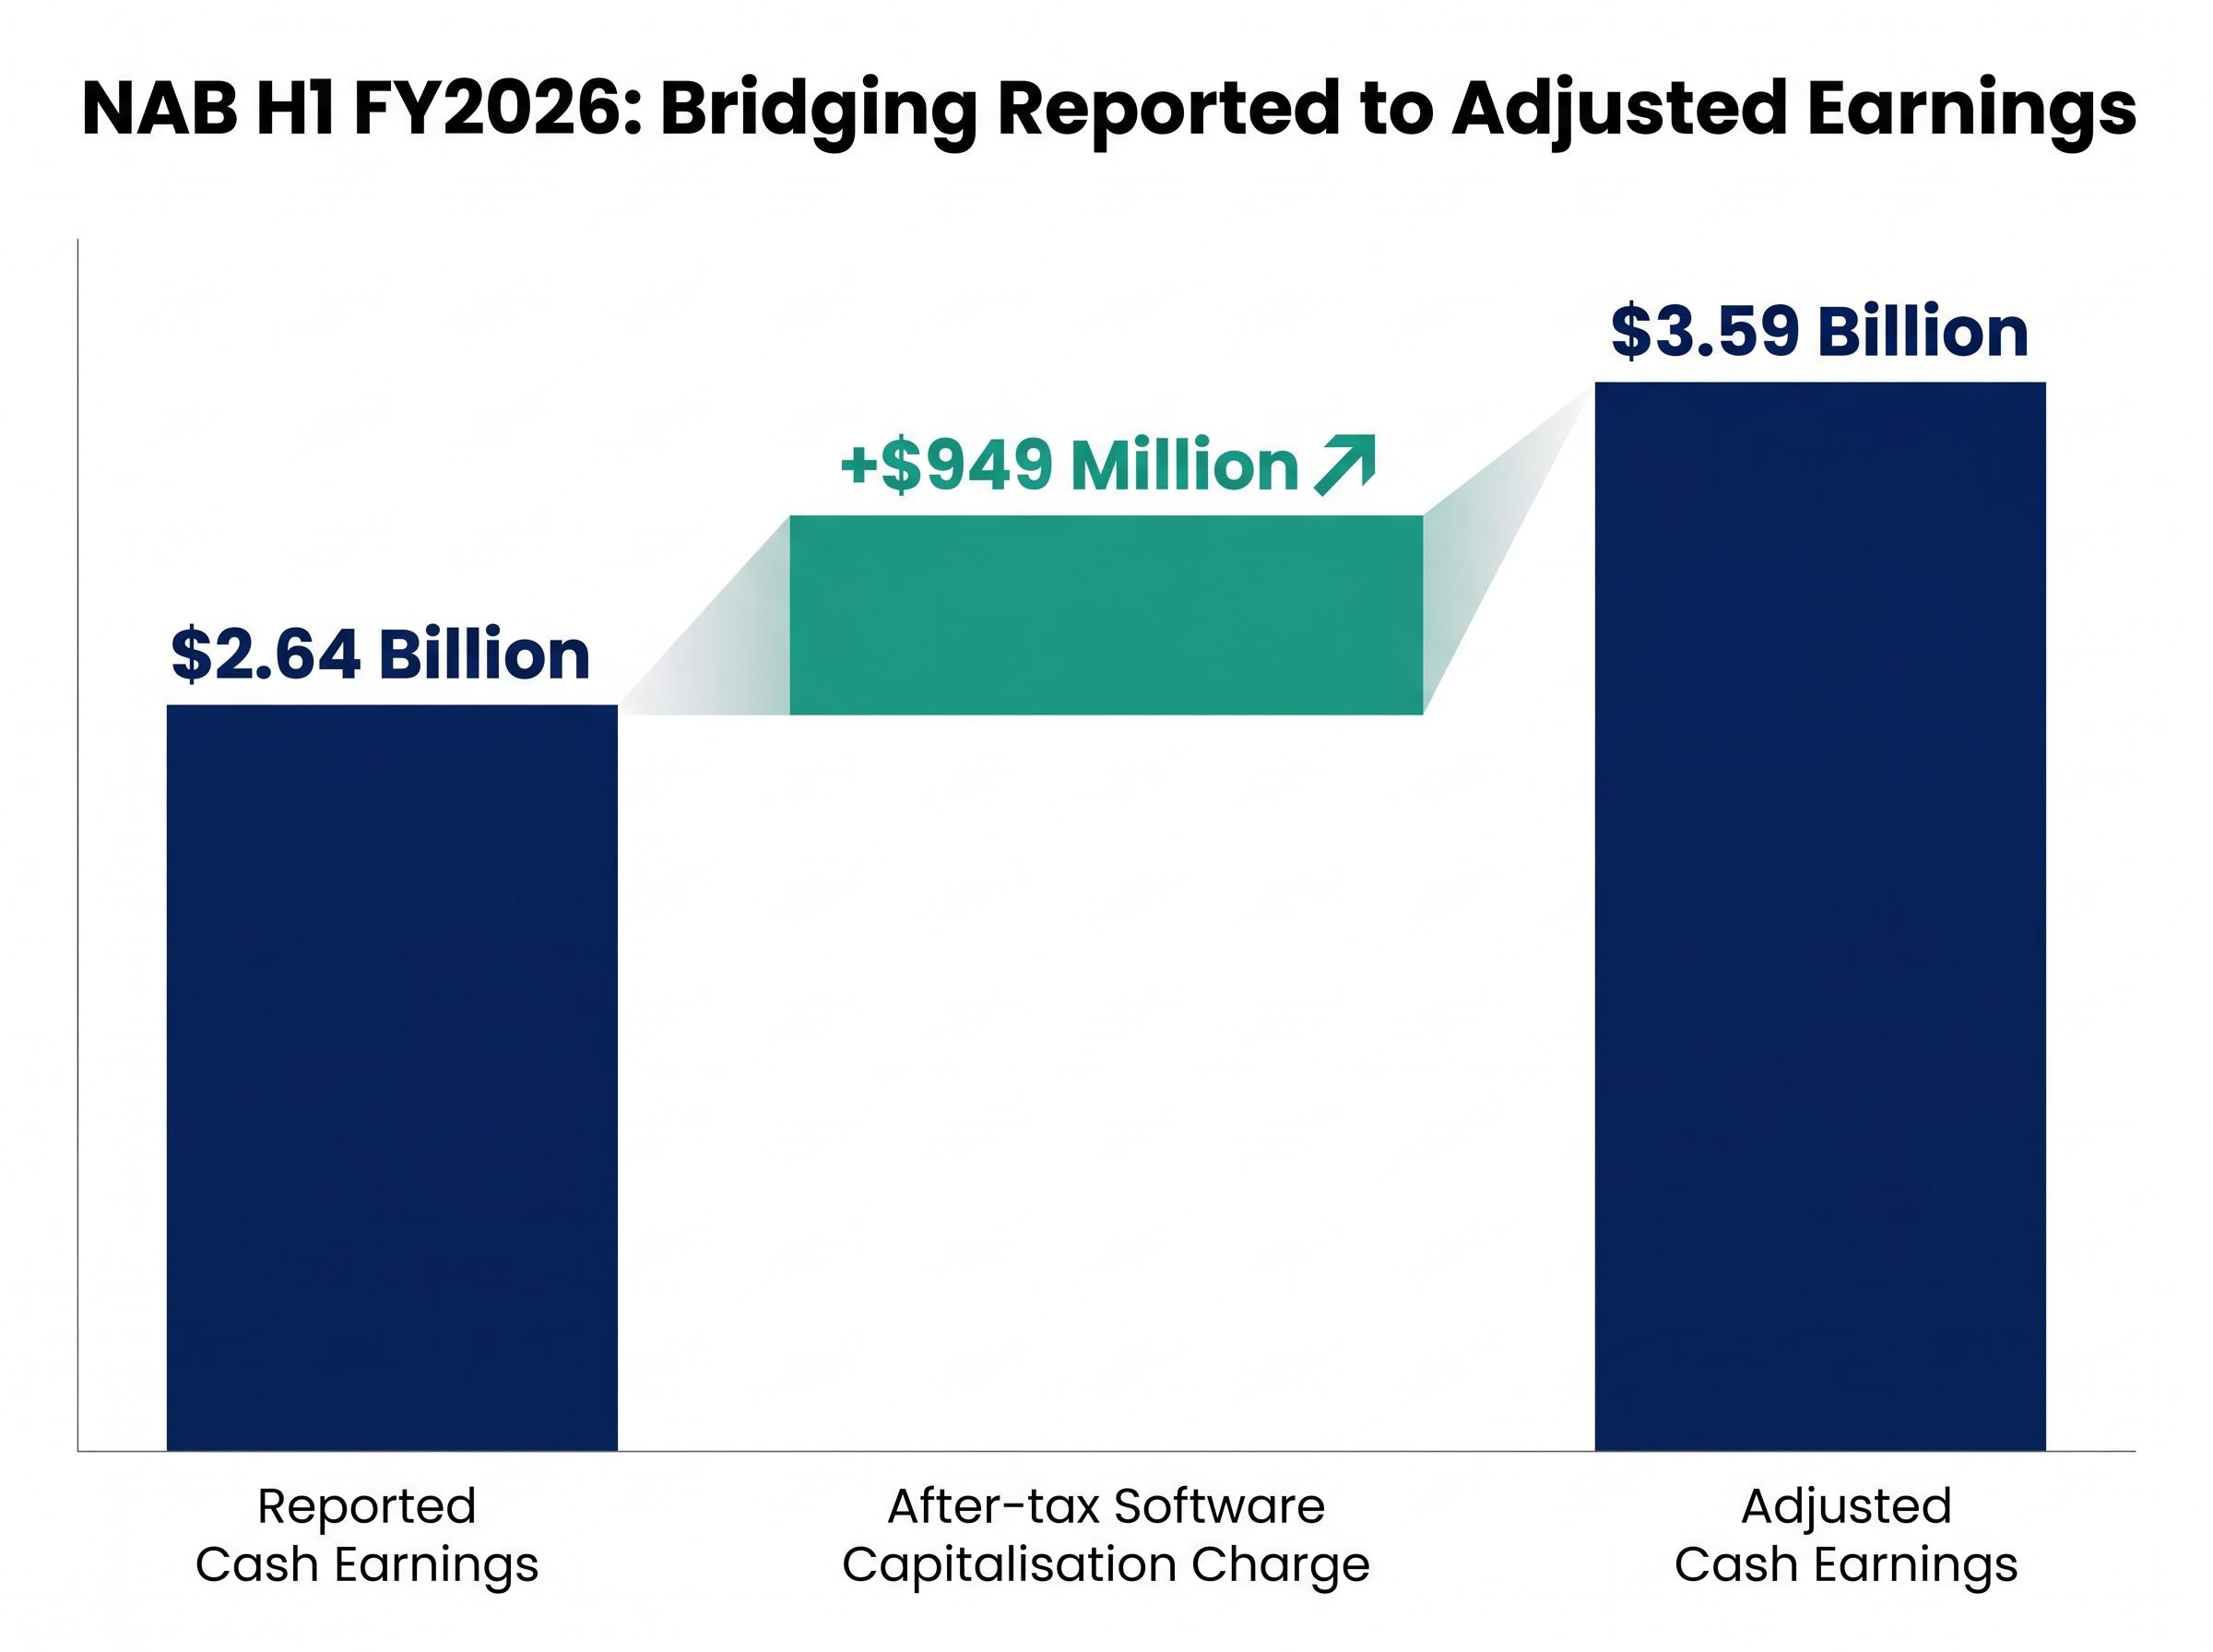
Reported cash earnings of $2.64 billion and adjusted cash earnings of $3.59 billion describe the same half-year through different lenses. The $949 million difference is entirely attributable to the software capitalisation policy change. On an adjusted basis, earnings grew 2.3% compared with the second half of FY2025, a result that sits closer to what the bank’s operations actually delivered.
Underlying profit grew 6.4% in the half, and this is the metric that cuts cleanest through both the software charge and credit impairment movements to show operational momentum. Revenue growth of 3.1% versus H2 FY2025 fed into that expansion, but the underlying profit figure suggests margin improvement is contributing meaningful lift beyond top-line growth alone.
Business and Private Banking stood out as the strongest divisional performer. Cash earnings (excluding large notable items) reached $1.85 billion, up 9.9%, with underlying profit growth of 5.4%. Australian business lending grew 5.6%, with market share gains reported in both SME and total business lending. The proprietary channel share of home loan drawdowns improved from 41.4% in H2 FY2025 to 47.7% in H1 FY2026, a shift that carries margin implications given lower distribution costs.
| Metric | H1 FY2026 Result | Comparison Period | Change |
|---|---|---|---|
| Underlying profit growth | 6.4% | vs H2 FY2025 | Up |
| Revenue growth | 3.1% | vs H2 FY2025 | Up |
| B&PB cash earnings (ex notable items) | $1.85 billion | vs H2 FY2025 | Up 9.9% |
| Proprietary channel home loan share | 47.7% | H2 FY2025: 41.4% | Up 6.3 ppts |
For investors assessing whether NAB’s franchise is growing, the 6.4% underlying profit result suggests the operational story is materially stronger than the headline earnings figure implies.
The credit impairment charge rose to $706 million in H1 FY2026, up from $485 million in H2 FY2025. Read in isolation, a 46% increase in credit charges looks concerning. The composition of the charge tells a different story.
$300 million of the total impairment charge is a forward-looking provision for Middle East geopolitical risk, a deliberate buffer against potential future stress rather than a response to realised losses.
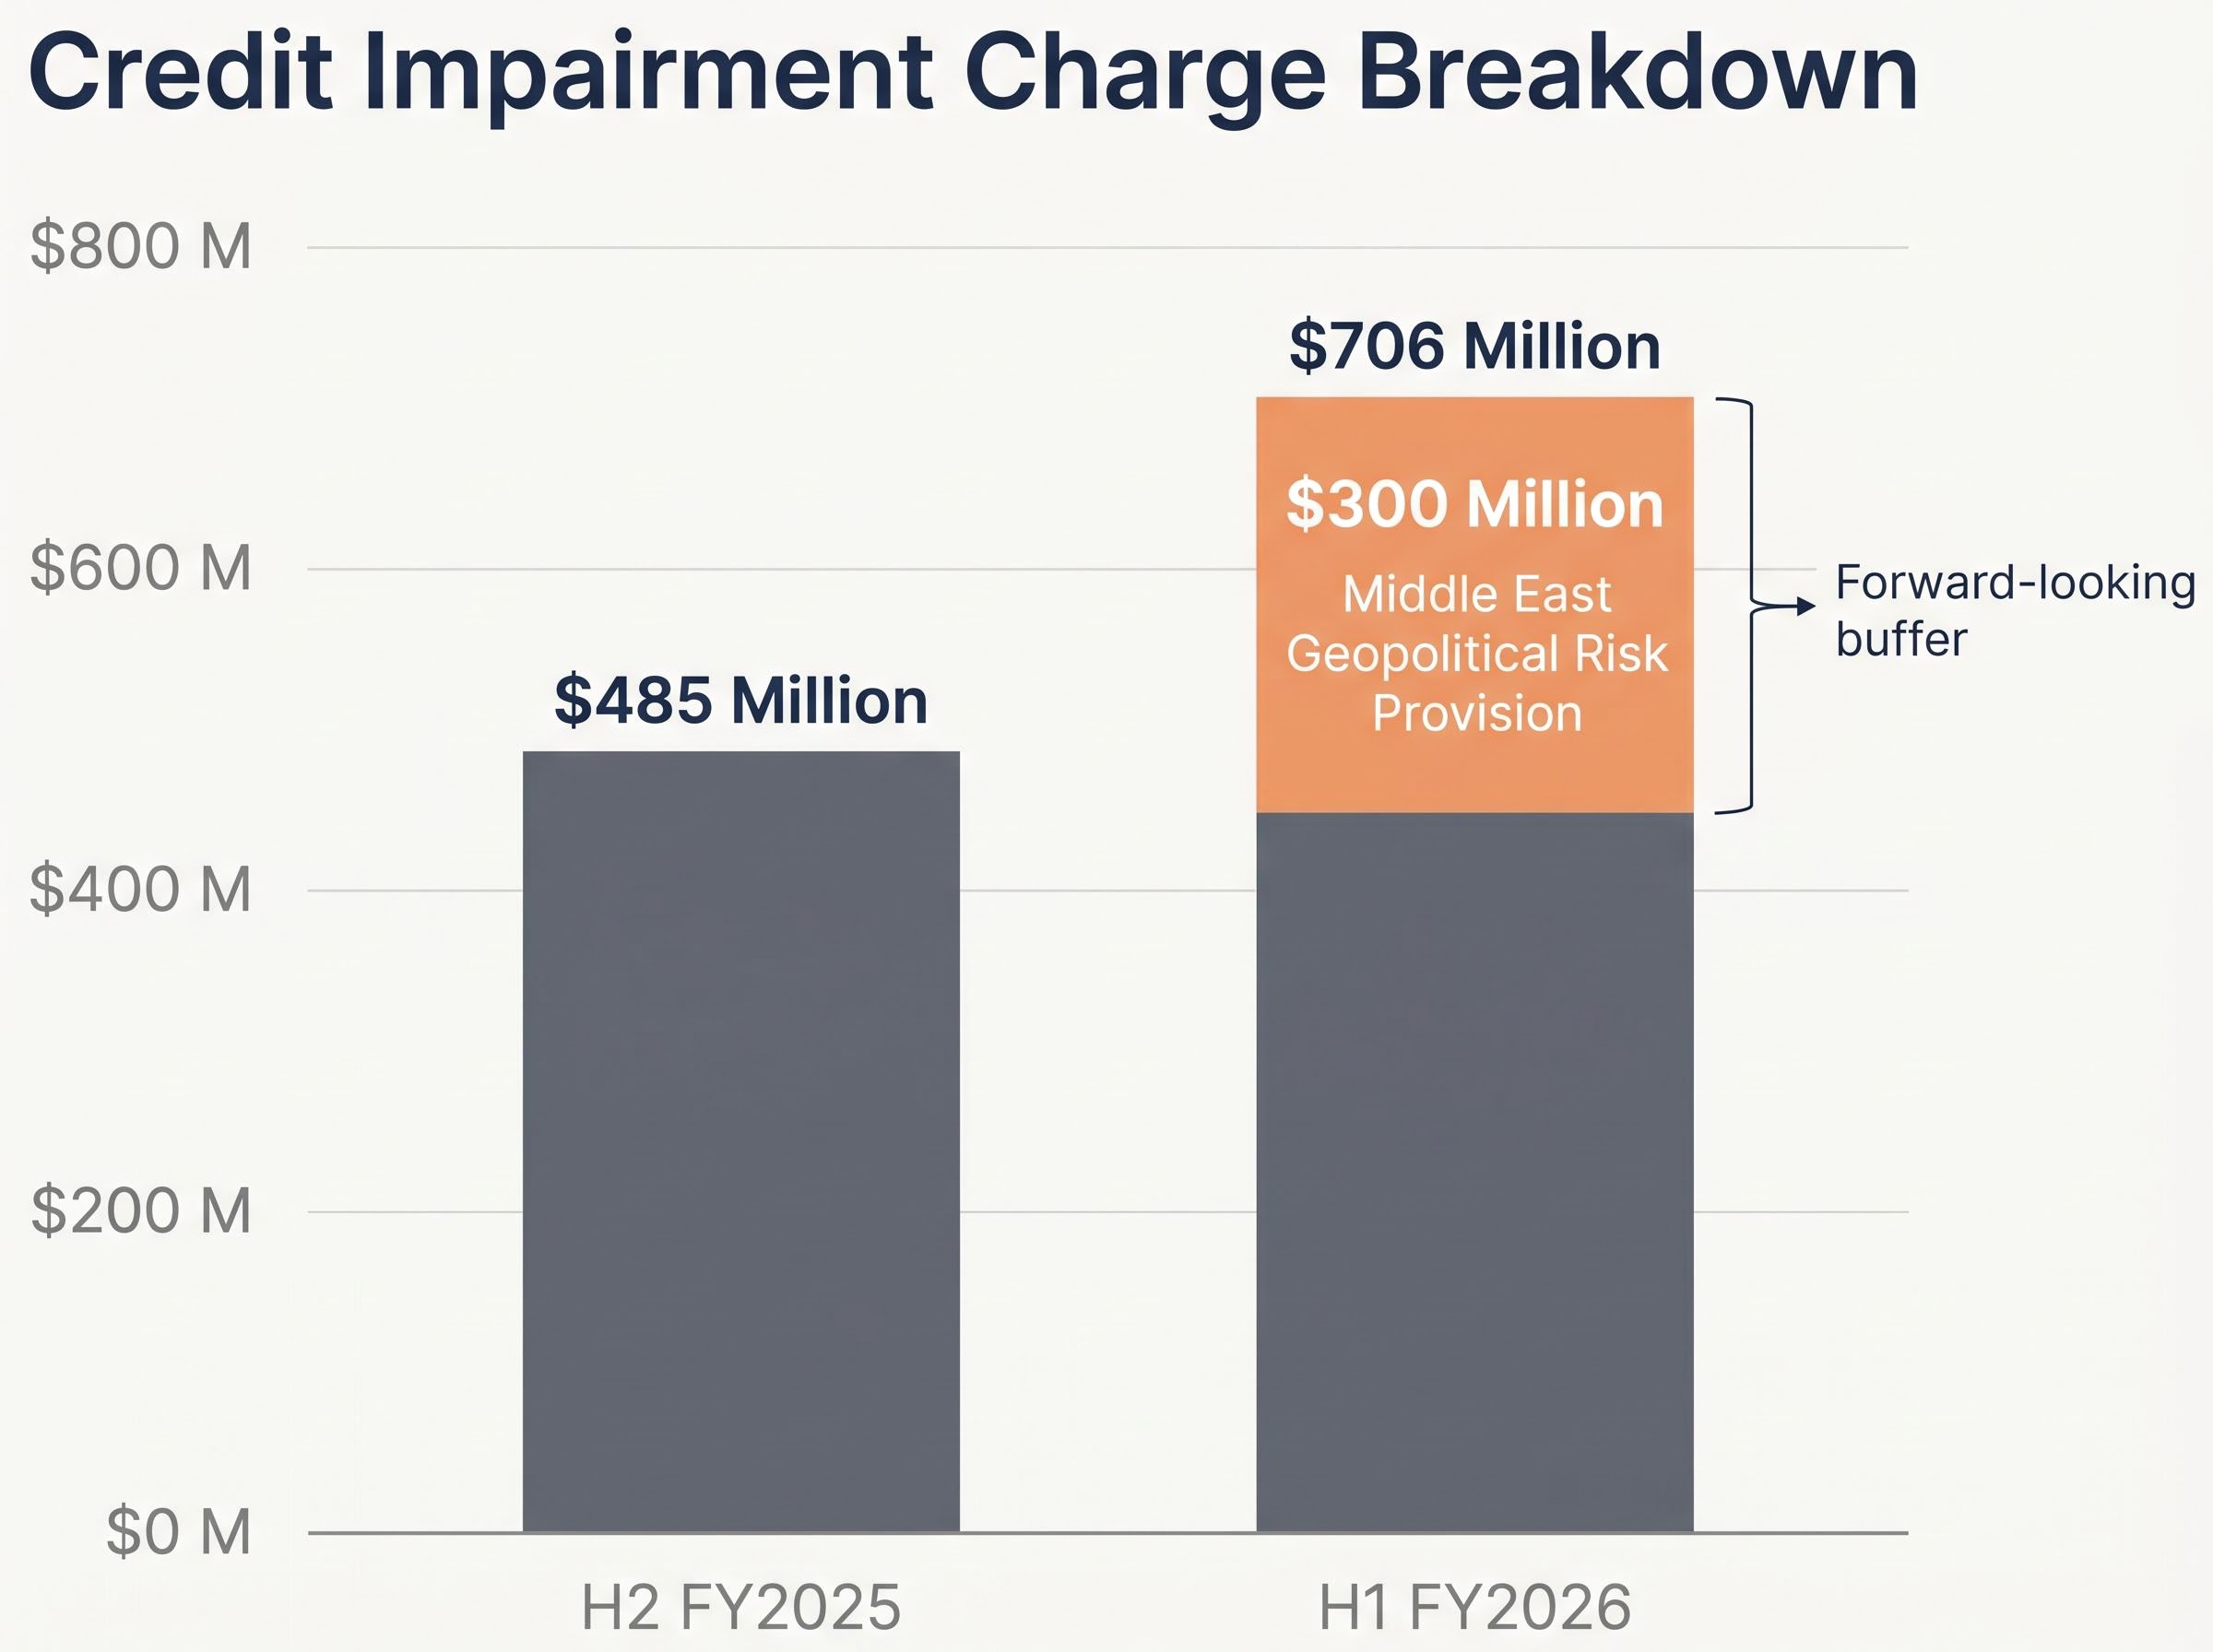
Management indicated that underlying asset quality trends actually improved during the half, even as the headline charge moved higher. The collective provisions ratio edged up from 1.31% at December 2025 to 1.35% at March 2026, consistent with a bank choosing to build reserves rather than one being forced to recognise deterioration.
The $706 million charge also carries a broader signal about ASX bank risk in 2026, with NAB’s voluntary pre-results disclosure in April having triggered a 3.6% single-day share price drop that illustrated how market participants initially struggled to distinguish a forward-looking provision build from evidence of genuine loan book deterioration.
The distinction matters. A bank absorbing unexpected credit losses is a different proposition from one voluntarily increasing provisions against a scenario that has not yet occurred.
NAB reported a Common Equity Tier 1 (CET1) ratio, the measure of a bank’s core capital strength, of 11.65% at 31 March 2026, a modest decline from the September 2025 level but still above the bank’s stated target. The path from here is what carries the signal.
NAB’s capital plan was disclosed in mid-April 2026 before the formal results, signalling that management had already decided to use the half-year reporting event to accelerate both the software accounting clean-up and the forward-looking provision build rather than spread those decisions across future periods.
The interim dividend held at 85 cents per share, fully franked, consistent with both the prior half and the prior corresponding period. The adjusted cash dividend payout ratio of 72.5% indicates the bank is distributing a meaningful share of adjusted earnings while retaining enough to rebuild capital.
The partial underwrite on the DRP is the detail worth noting. It signals that management is prioritising capital accumulation during a period of elevated global uncertainty rather than relying solely on organic capital generation. For income-focused shareholders, the dividend is stable. For capital-focused investors, the DRP structure describes a bank in deliberate rebuild mode.
The adjusted earnings picture, 2.3% cash earnings growth, 6.4% underlying profit expansion, and 3.1% revenue growth, describes a bank with operational momentum that the headline figure obscured. The business lending franchise is gaining share, proprietary distribution channels are expanding, and margin improvement is doing work beyond revenue growth alone.
What remains genuinely uncertain is how this result compares across the sector. ANZ reported H1 FY2026 cash profit of $3,780 million, up 70% from H2 FY2025, though direct comparison requires careful treatment of one-off items and comparison methodology differences in ANZ’s result. CBA and Westpac have not yet reported, meaning a full four-bank benchmark is unavailable.
Big Four valuation fundamentals have been under scrutiny throughout 2026, with the ASX 200 Financials sector posting an 8.87% year-to-date gain driven by four banks that collectively represent around 25% of the entire index, even as unanimous sell ratings and stretched price-to-earnings multiples accumulated across the sector.
CEO Andrew Irvine framed NAB as well-positioned entering a period of heightened volatility, pointing to the balance sheet strengthening actions and elevated provisioning as the mechanisms enabling continued customer support. The first-quarter trading update had already signalled strength: cash earnings ran 15% above the H2 FY2025 quarterly average, with underlying profit 12% above the same base.
Broker price target revisions and ratings changes are expected throughout the 4 May 2026 trading session and post-market. Full analyst digestion of the software capitalisation change and the Middle East provision will take hours, not minutes.
The single most useful takeaway from NAB’s H1 FY2026 result is not any individual metric. It is the reminder that reported cash earnings at a major Australian bank frequently contain large notable items that distort the headline. The $949 million software capitalisation charge is this half’s illustration of that principle. Adjusted and underlying figures are almost always more analytically informative than the reported number that appears first on a screen.
Results-day share price movements in major bank stocks are often noisy. Institutional investors who account for the majority of trading volume typically require hours or days to digest full results documents, divisional breakdowns, and management commentary before forming a considered view. Early intraday price action may not reflect that assessment.
Investors who learn to look past headline cash earnings to adjusted and underlying figures will be better equipped to evaluate every major bank result, not only this one.
ANZ’s H1 FY2026 result provides the only available peer comparison at the time of publication. Whether NAB’s 6.4% underlying profit growth is sector-leading or in line with peers will become clearer once CBA and Westpac report.
For investors wanting to understand the analyst consensus backdrop that NAB’s result now feeds into, our full explainer on the Morgans sector-wide sell call covers the specific provisioning forecasts, earnings downgrade scenarios, and price target ranges across all four banks that frame what a sector-wide bearish view looks like heading into the second half of 2026.
This article is for informational purposes only and should not be considered financial advice. Investors should conduct their own research and consult with financial professionals before making investment decisions. Past performance does not guarantee future results. Financial projections are subject to market conditions and various risk factors.
—
The NAB share price fell roughly 1% because the headline cash earnings figure of $2.64 billion was compressed by a $949 million after-tax software capitalisation accounting charge, which obscured the stronger adjusted result of $3.59 billion and 6.4% underlying profit growth.
A software capitalisation policy change means a company alters how it spreads software development costs over time; NAB chose to accelerate recognition of these costs, resulting in a one-off $949 million after-tax charge that reduced reported cash earnings without reflecting any change in actual operational performance.
NAB reported a Common Equity Tier 1 (CET1) ratio of 11.65% at 31 March 2026, which is above the bank's stated operating target, with a pro forma ratio of 12.05% expected after the Dividend Reinvestment Plan proceeds are factored in.
The $300 million Middle East provision is a forward-looking geopolitical risk buffer that NAB voluntarily set aside against potential future stress, not a response to realised loan losses; management indicated that underlying asset quality trends actually improved during the half.
NAB declared an interim dividend of 85 cents per share, fully franked, consistent with both the prior half and the prior corresponding period, with an adjusted cash dividend payout ratio of 72.5%.