Vanguard VIHY Declares First Distribution at 49.49 Cents per Unit
1 hr ago
Metcash shares fell roughly 26% in the six months before 11 May 2026, then jumped 9.12% in a single session on the back of a trading update that confirmed full-year earnings and flagged a $25 million cost savings programme. That kind of repricing on a day of no dramatic news revision raises an obvious question: was the selloff overdone?
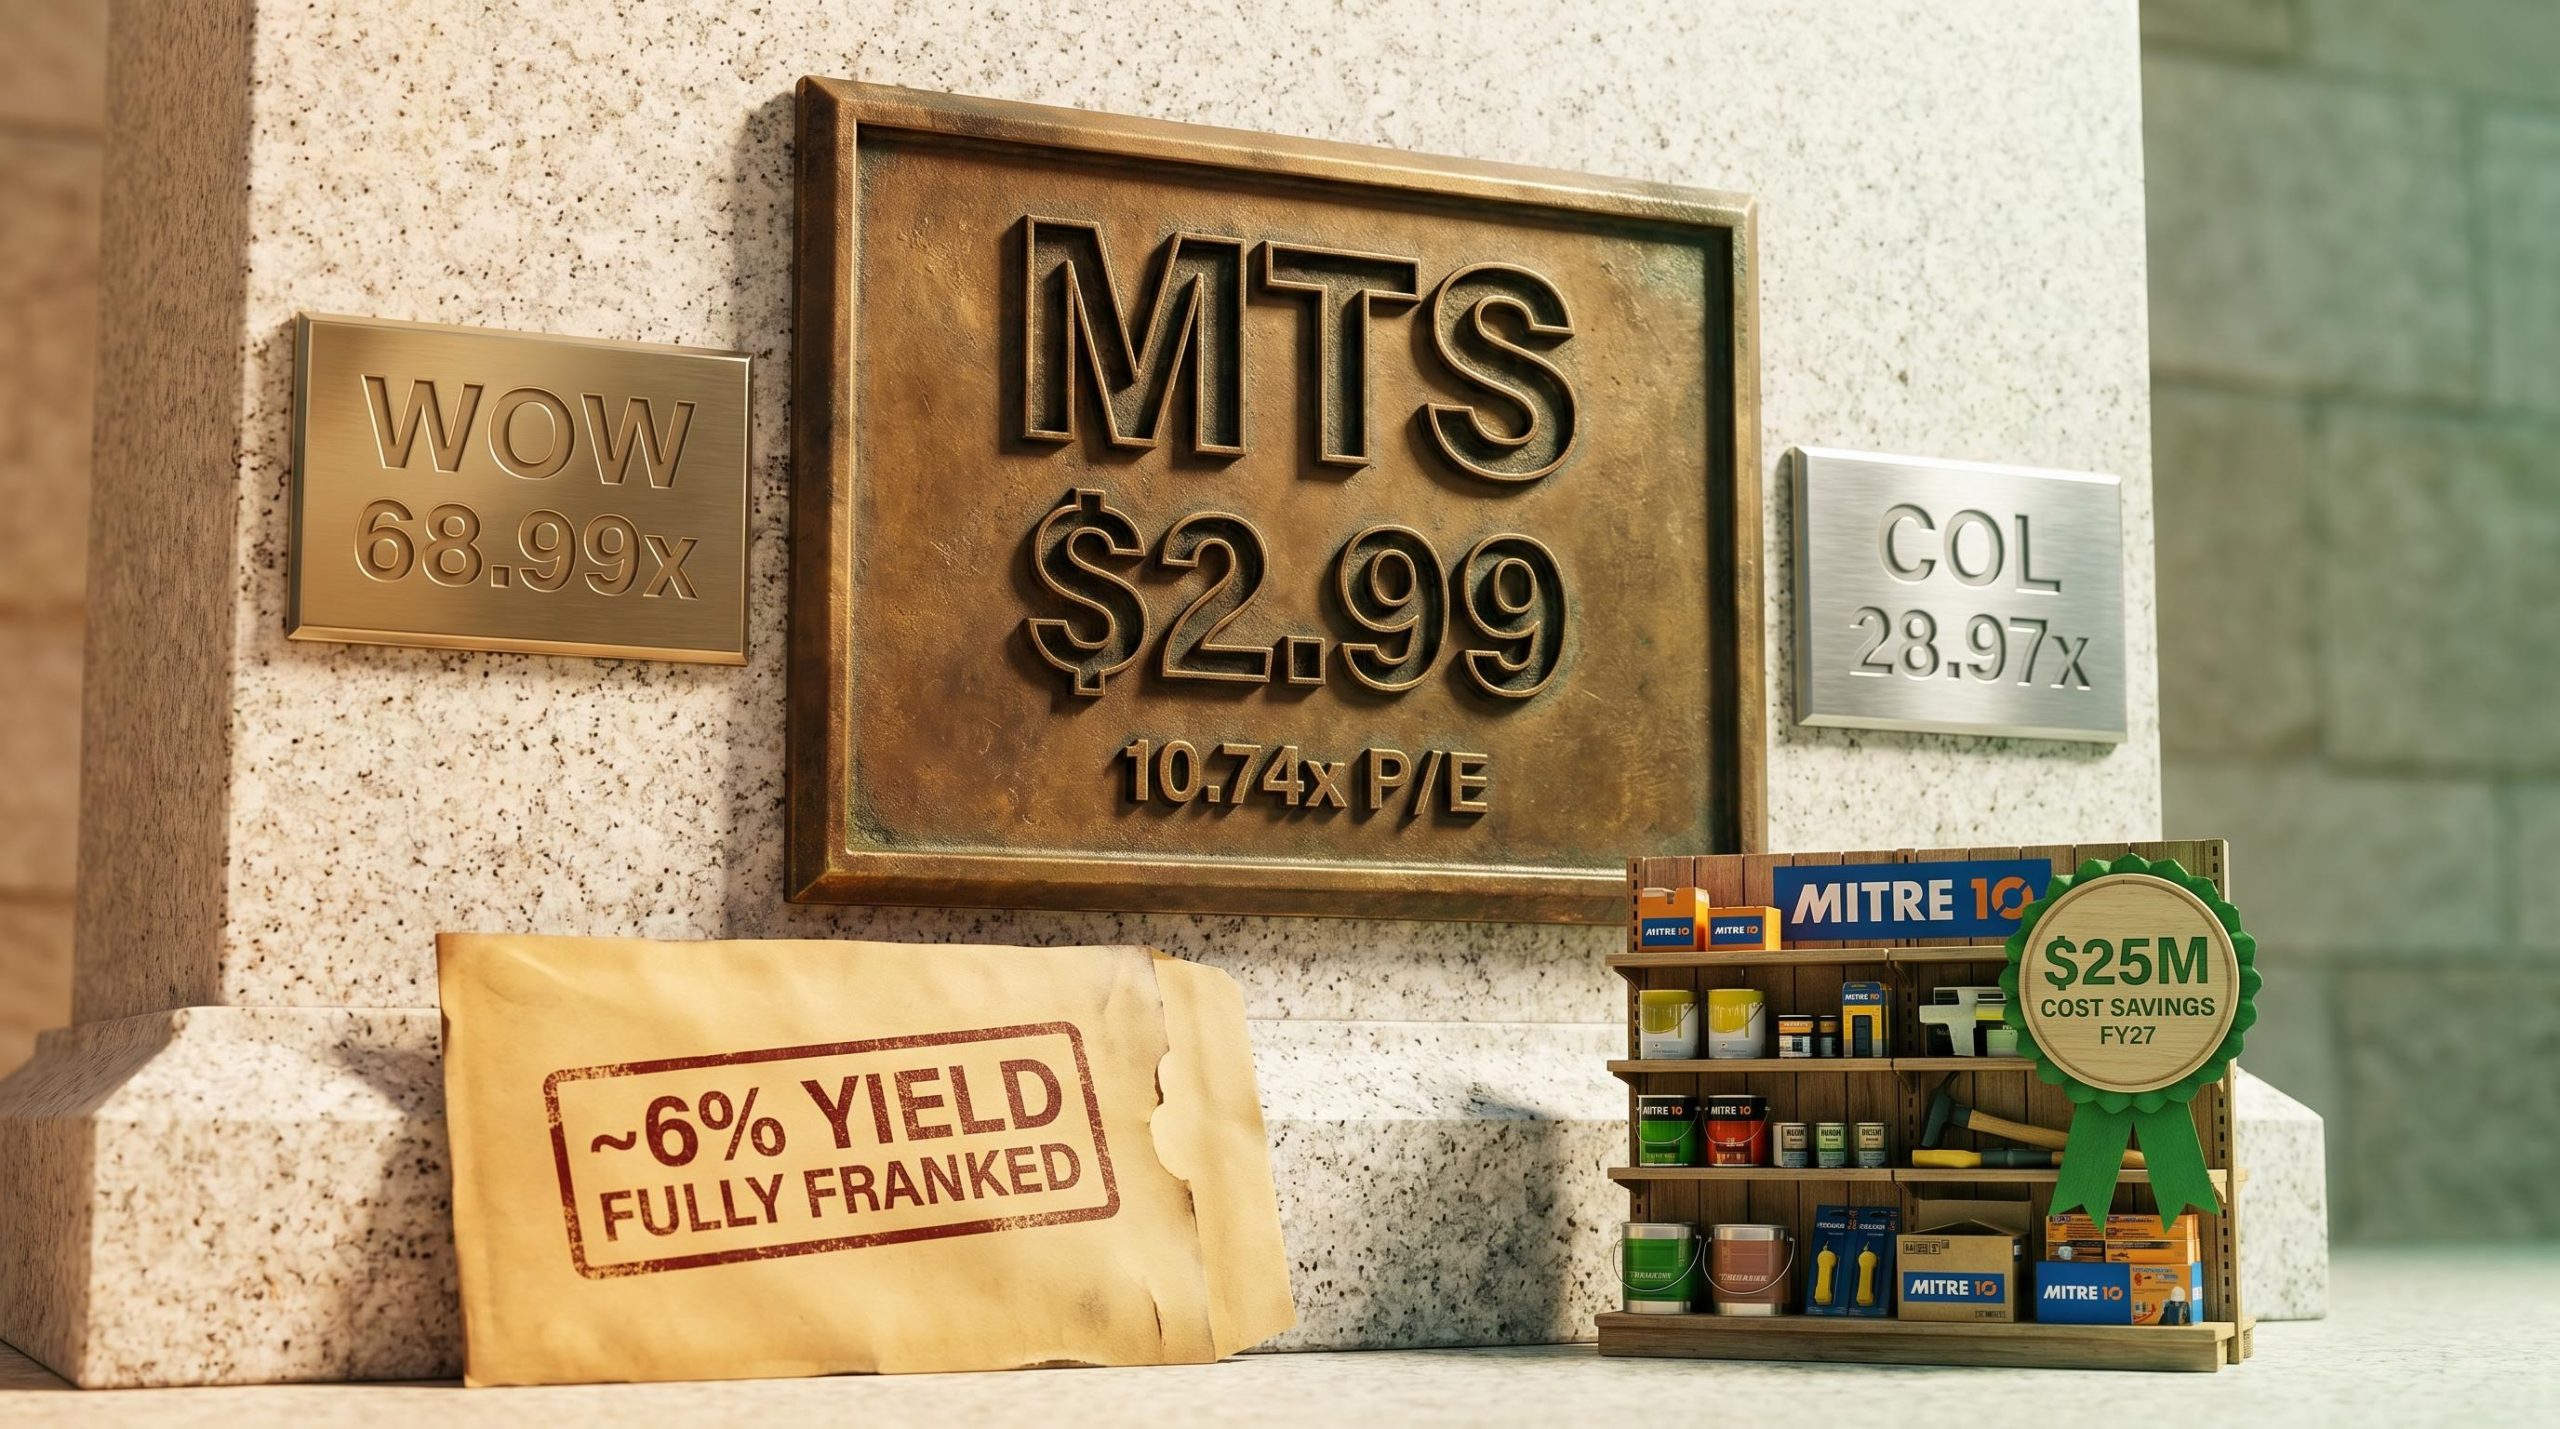
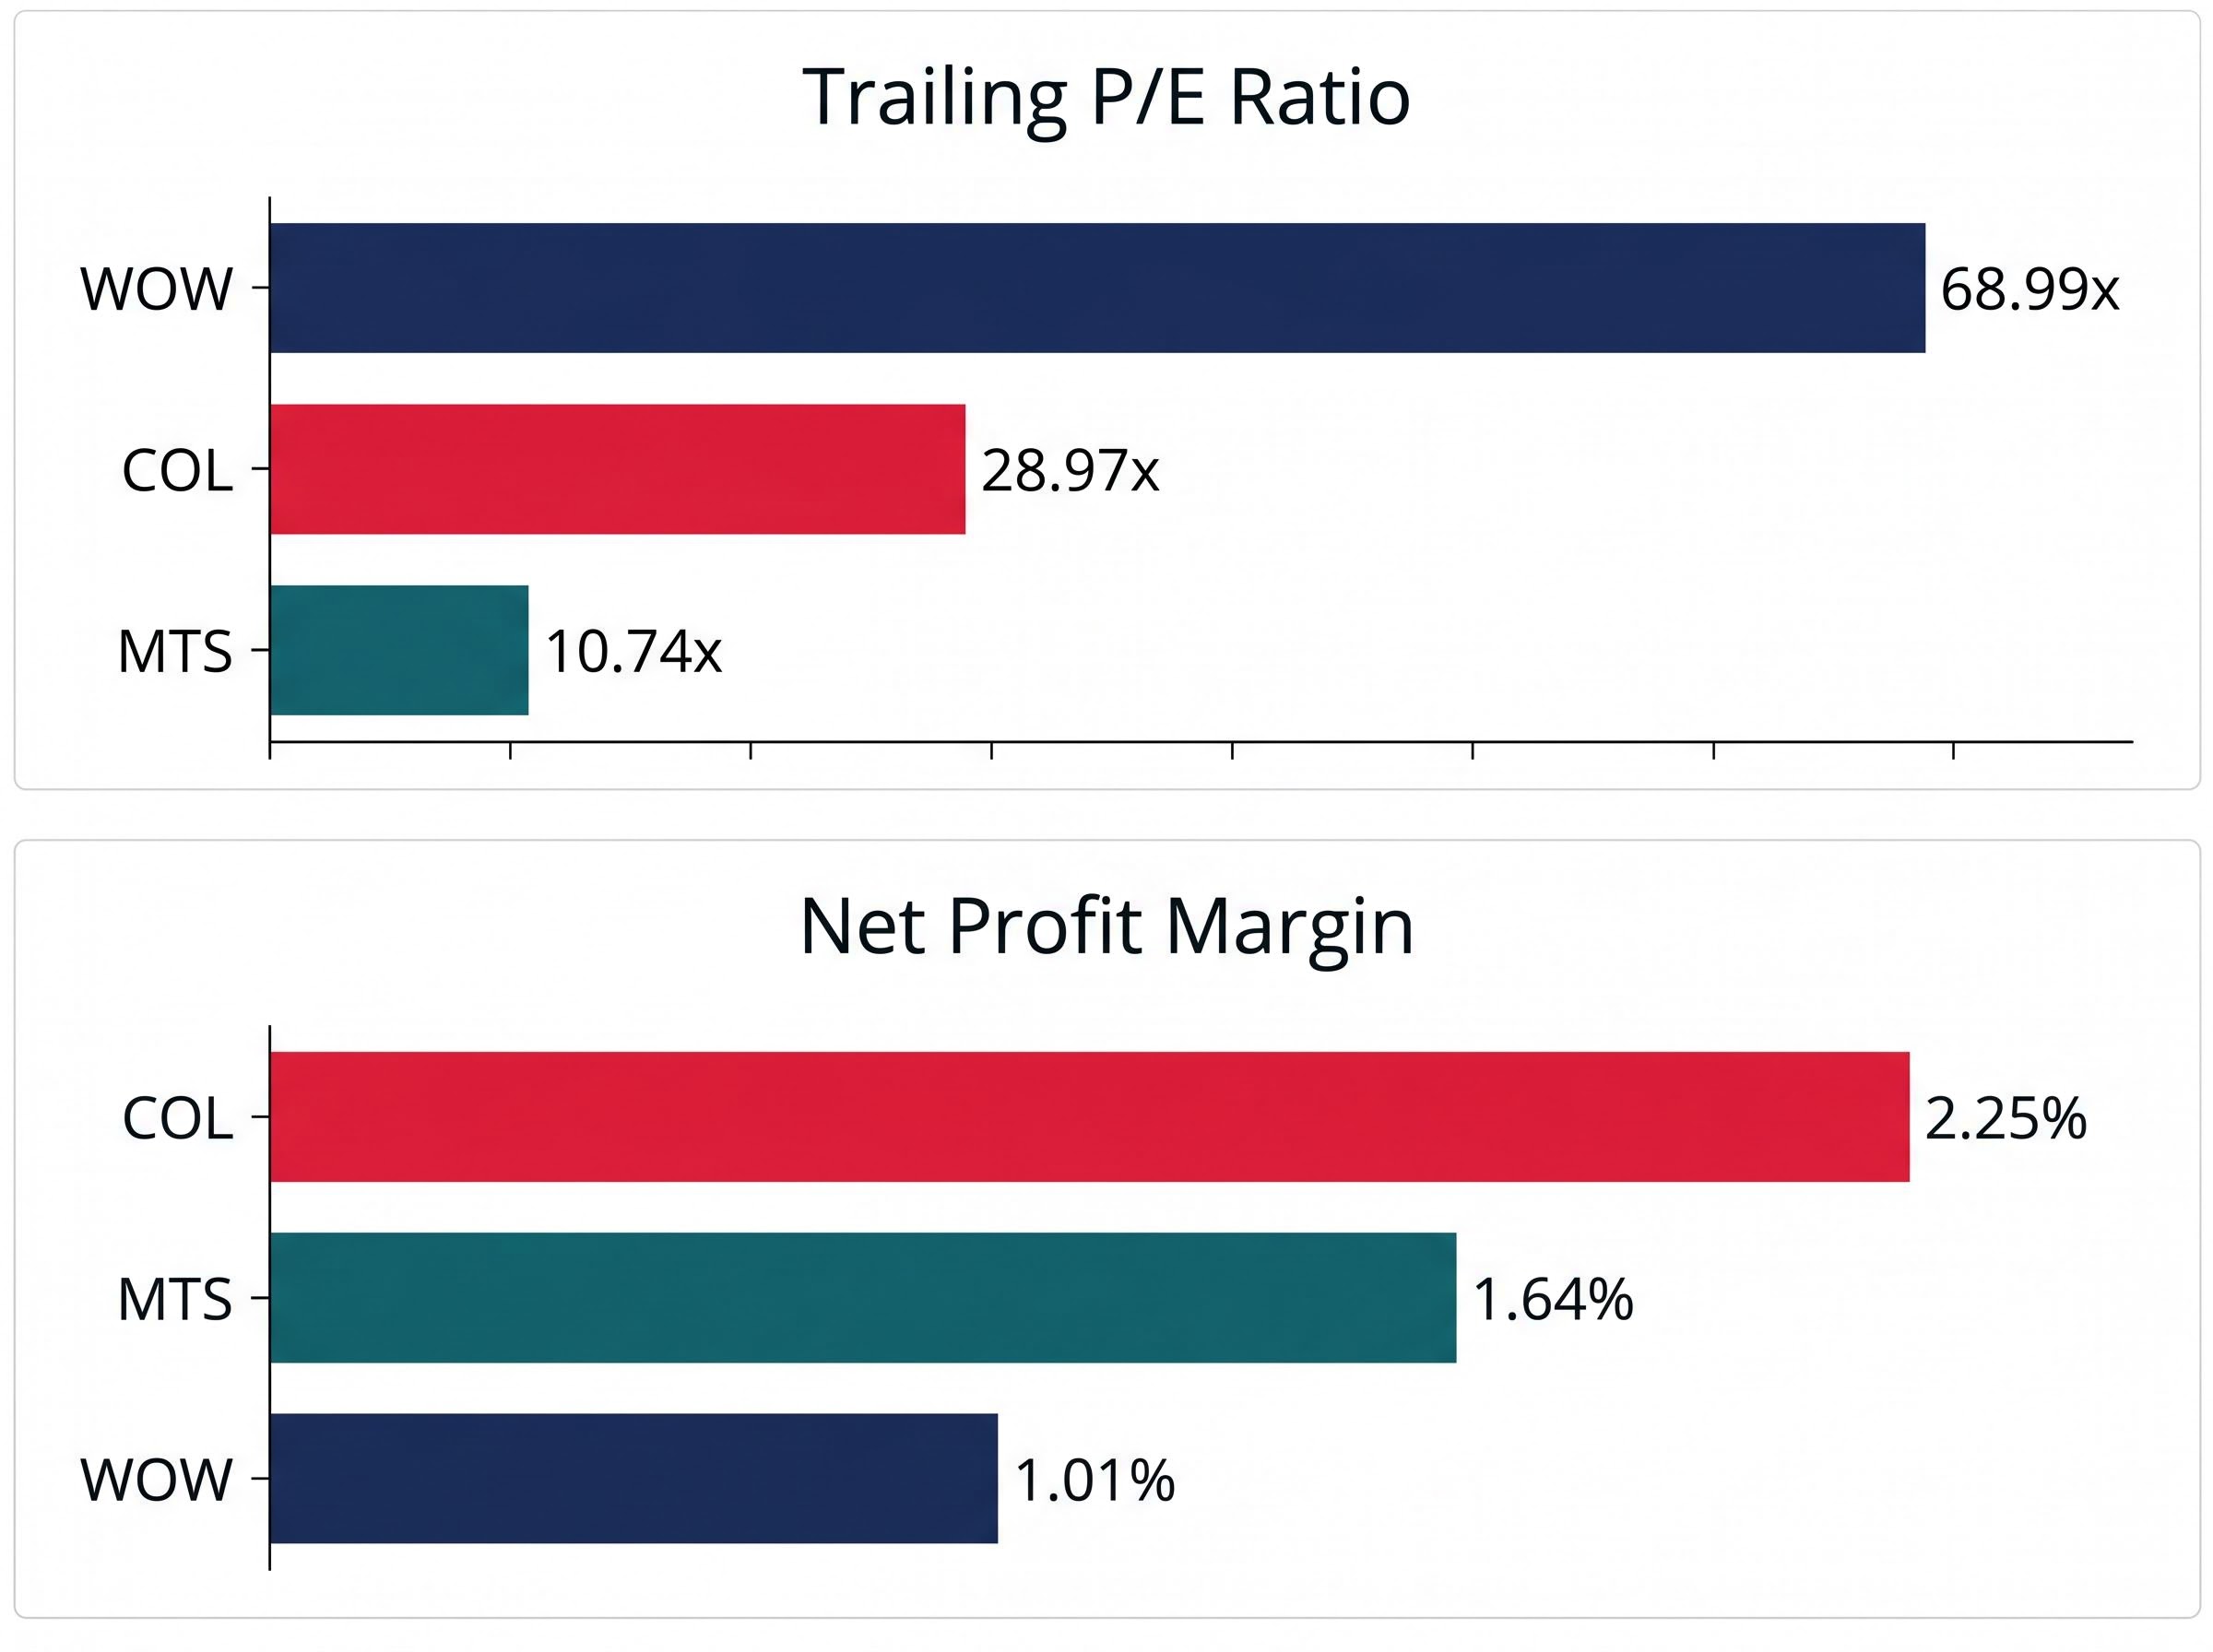
MTS is currently trading at $2.99, a trailing price-to-earnings (P/E) ratio of 10.74x and a forward P/E of 10.96x, against a market backdrop where Woolworths trades at nearly 69x and Coles at nearly 29x. The gap is extraordinary enough to demand scrutiny: either the market has embedded a structural discount that is entirely justified, or the stock is genuinely mispriced heading into an earnings-catalyst cycle.
What follows works through the MTS investment case from first principles: what the valuation actually reflects, what the cost programme is worth in earnings terms, where the structural risks are real versus overstated, and what conditions would need to hold for the consensus Buy thesis to pay off.
At $2.99, Metcash trades at 10.74x trailing earnings. Woolworths trades at 68.99x. Coles trades at 28.97x. The numbers, laid side by side, make the case before any interpretation is required.
| Metric | MTS | WOW | COL |
|---|---|---|---|
| Trailing P/E | 10.74x | 68.99x | 28.97x |
| Net Profit Margin | 1.64% | 1.01% | 2.25% |
| P/B Ratio | 1.836x | 9.23x | 7.54x |
| ROE (TTM) | 17.5% | Higher (est.) | Higher (est.) |
The simple “MTS is cheap” reading, however, requires a qualifier. Woolworths’ trailing P/E of 68.99x reflects compressed earnings rather than a growth premium; the ratio is inflated by a period of margin contraction, not by expectations of future expansion.
Woolworths’ net profit margin of 1.01% is actually lower than Metcash’s 1.64%, partially undermining the narrative that MTS is the structurally inferior margin business.
That leaves the central analytical question. Is MTS trading at a discount because of genuine structural inferiority in its business model, or because the market is applying a wholesale intermediary penalty that overstates the risk? The answer lies in how Metcash actually makes money.
The ASX consumer staples sector carries a structural beta of approximately 0.55-0.6 against the broader market and recorded a maximum drawdown of around -9% in 2025, roughly half the ASX 200’s equivalent fall, which partly explains why Woolworths and Coles command defensive premiums that a wholesale intermediary like Metcash cannot fully replicate.
Metcash operates three segments, each serving independent retailers rather than consumers directly:
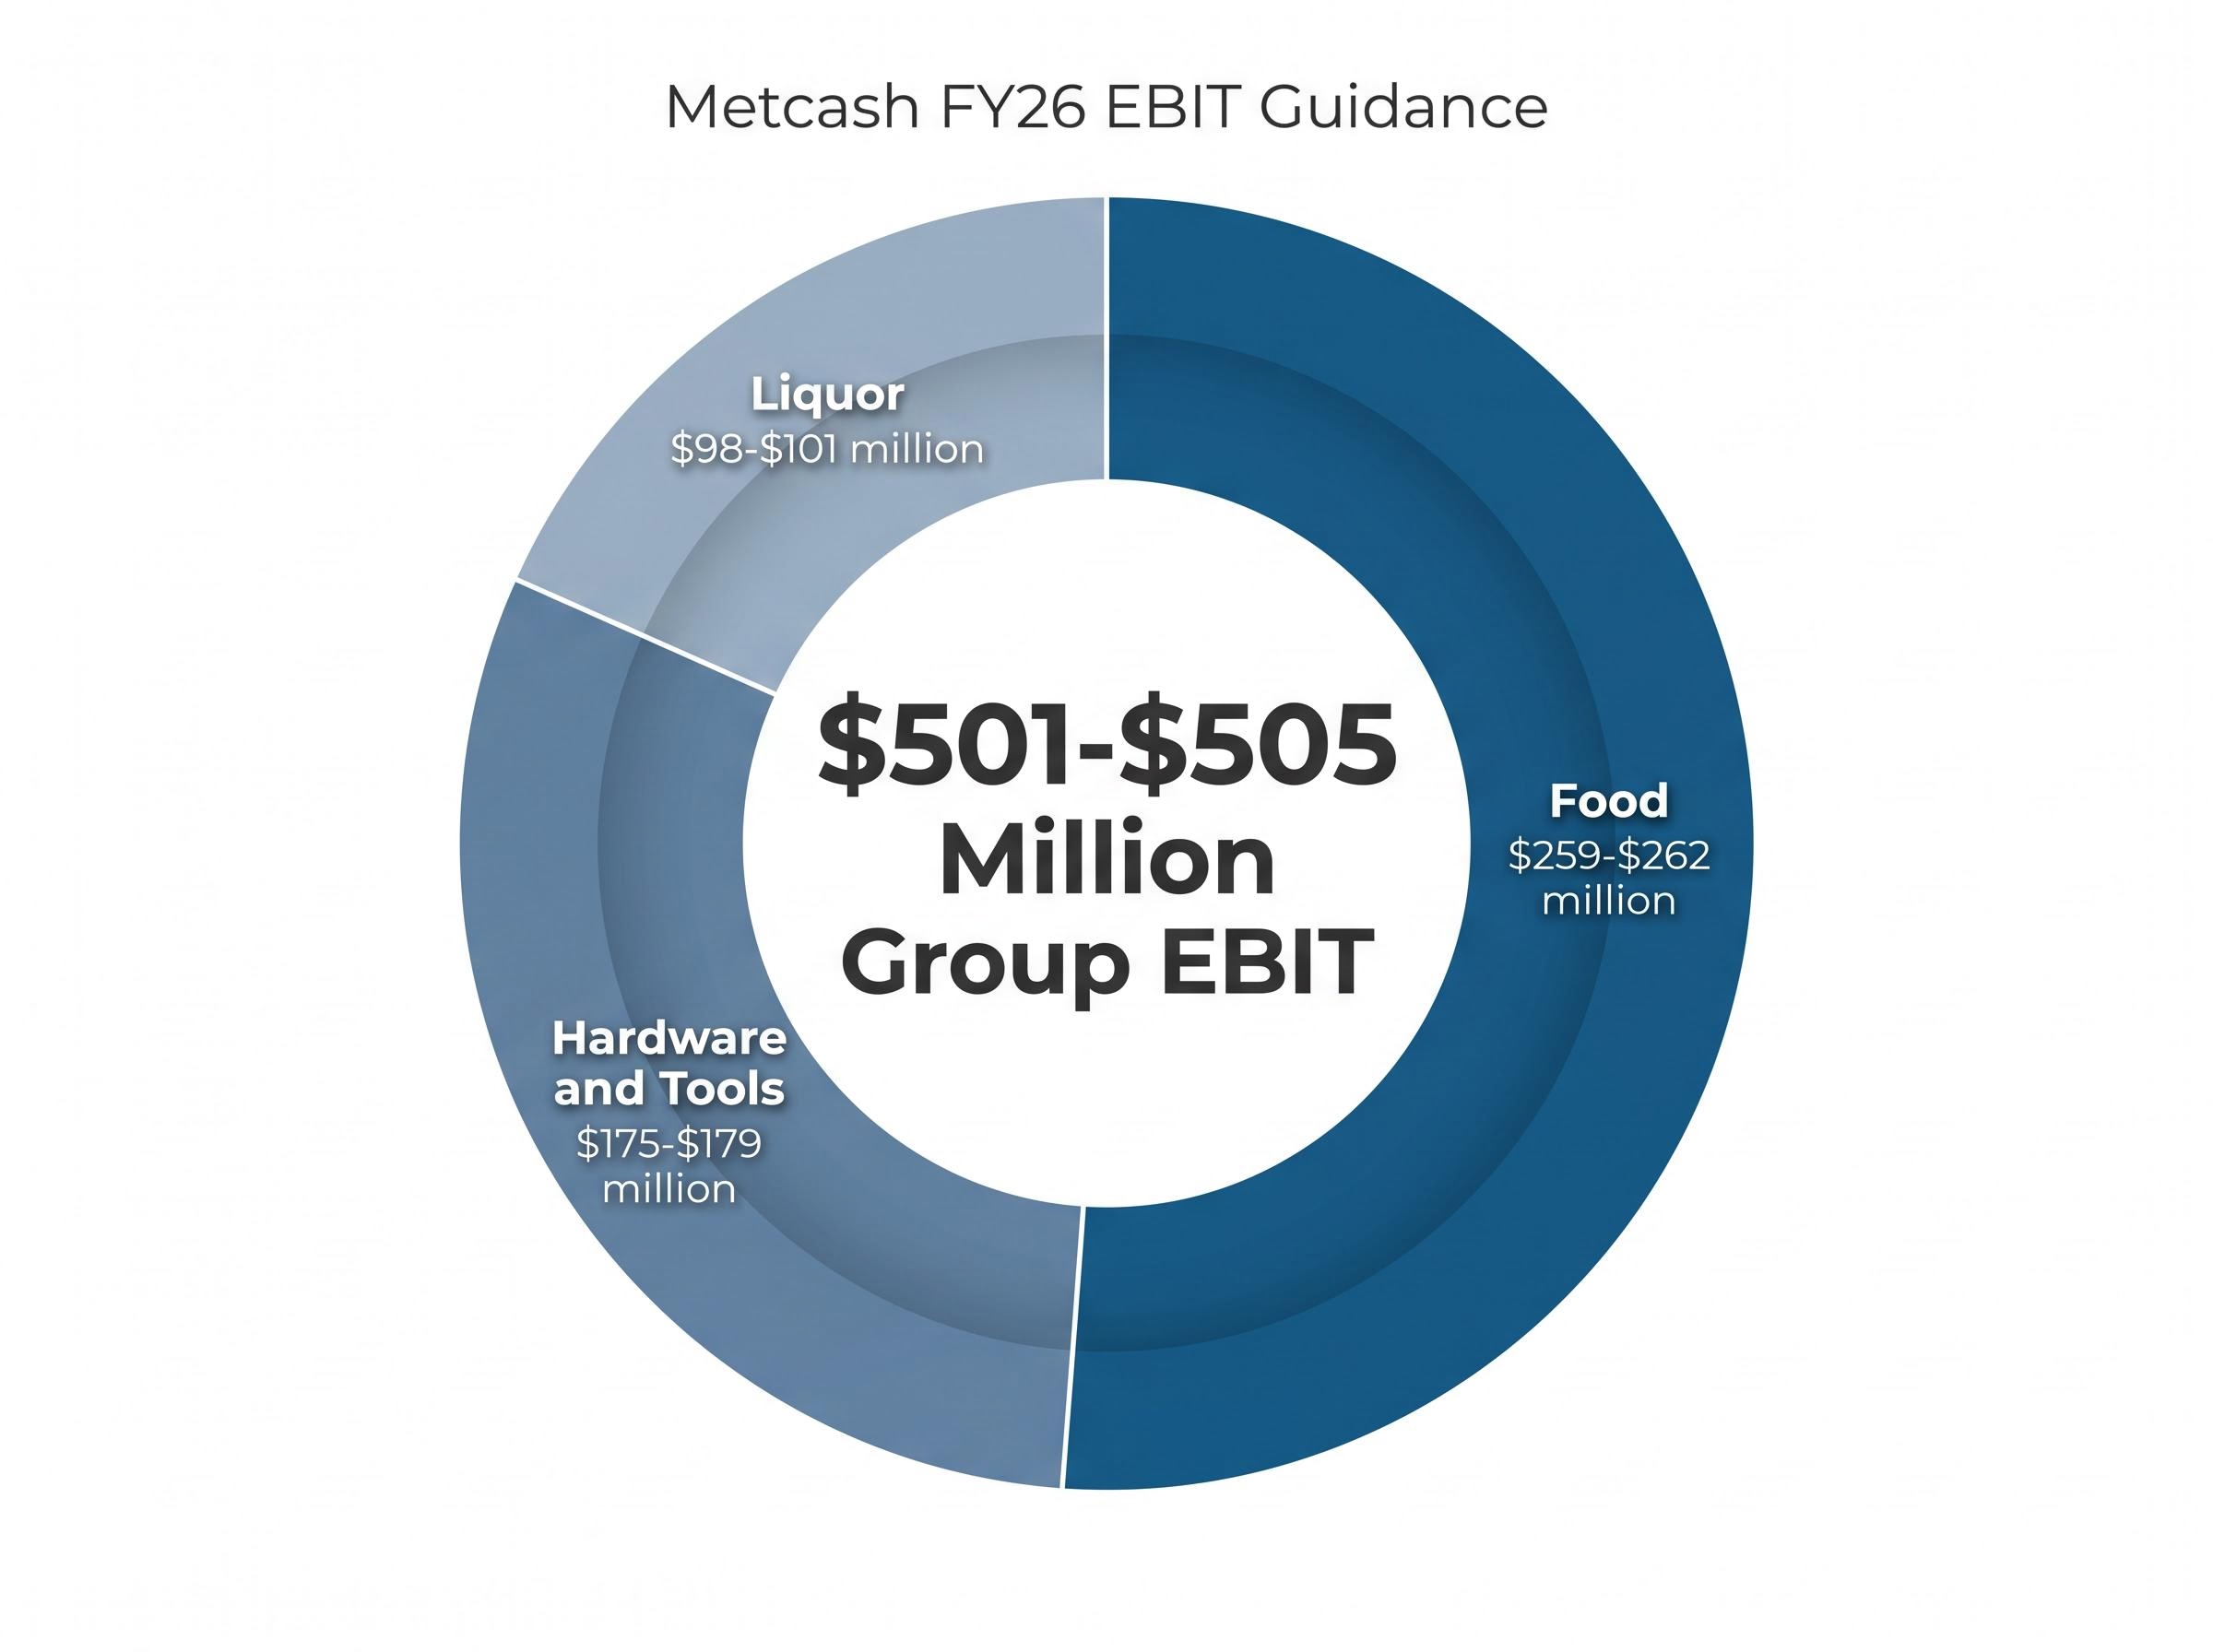
The FY26 trading update confirmed EBIT (earnings before interest and tax, the profit a company generates from its operations) guidance of $501-$505 million across the group, with Food contributing $259-$262 million, Liquor $98-$101 million, and Hardware and Tools $175-$179 million. Group revenue grew 0.7% overall, or 3.8% excluding tobacco.
Wholesale distribution businesses typically trade at lower multiples than integrated retailers. The reasons are structural: thinner margins, limited own-brand pricing power, and customer concentration risk. MTS does not control its shopfront. It supplies it. That distinction permanently compresses the multiple the market is willing to pay.
Coles margin expansion in 1H FY26, driven by automation benefits and strategic sourcing gains that lifted supermarkets EBIT by 14.6%, illustrates the operational advantage integrated retailers hold over wholesale intermediaries: Metcash cannot replicate store-level automation savings across a network it does not own, which is one structural reason the multiple gap is unlikely to fully close.
The sharpest illustration of that concentration risk arrived in May 2018, when Drakes Supermarkets announced its departure from the Metcash supply network, effective June 2019. The result was a $352 million writedown, comprising a $318 million non-cash impairment and a $34 million asset writedown, recorded in FY18 results.
The Drakes episode is historical and distinct from the current share price weakness, which has been driven by FY26 operating results and broader market conditions. But it remains the baseline case study for what happens when a wholesale intermediary loses a material customer. It is the risk that the valuation discount permanently prices in, and it is the reason MTS will never trade at Coles’ multiple regardless of operational execution.
The 11 May 2026 trading update introduced a cost savings programme targeting at least $25 million in annualised savings from FY27. The anatomy is straightforward:
$15 million from labour savings. $10 million from non-trade procurement. These two levers constitute the full programme as currently disclosed.
The question for investors is whether $25 million moves the needle against an FY26 underlying net profit after tax (NPAT) base of $268-$270 million. Working through the arithmetic:
At roughly 9% of FY26 NPAT on a pre-tax basis, a fully delivered programme is not transformational. It is, however, meaningful when layered onto a hardware recovery cycle, and it demonstrates management intent to self-fund earnings growth rather than rely on top-line expansion alone. The risk is execution: labour cost savings in a tight Australian employment market carry implementation risk, and the forward P/E already partially prices in delivery.
Hardware and Tools contributed EBIT of $175-$179 million at the FY26 guidance midpoint, representing approximately 35% of group earnings. This is the division where the investment thesis is most leveraged and most uncertain.
IHG/Mitre 10 is structurally differentiated from Bunnings (owned by Wesfarmers). Where Bunnings dominates the consumer hardware market with scale, purchasing power, and brand recognition, IHG targets the trade and professional construction segment through its network of independent retailer members. That distinction matters in a housing recovery cycle: trade spending tends to follow construction activity and renovation pipelines, and IHG’s independent network is positioned to capture share in categories where Bunnings’ consumer orientation is less competitive.
The broader hardware distribution market context matters here: Stealth Group’s record half-year results following its HBT acquisition position it as a third independent competitor in a segment estimated at $93 billion, adding competitive texture to the trade and professional construction channels where IHG and Mitre 10 are most active.
MFAM Research holds a Buy rating on MTS with a price target of $3.80, implying approximately 27% upside from $2.99. The thesis centres on a hardware division re-rating as the Australian housing cycle accelerates.
MFAM Research’s price target of $3.80 represents the most optimistic end of the analyst range, against a consensus average of $3.43 (TipRanks, May 2026).
The FY26 trading update explicitly described trade market conditions as soft and acknowledged the recovery timeline had extended beyond earlier expectations. This is the single most important caveat in the bull case: analyst consensus positions the cycle bottom at H2 FY26, with acceleration into FY27, but that call has already been pushed back once.
A delayed recovery extends the earnings catalyst window rather than eliminates it, provided the underlying housing cycle thesis remains intact. Wesfarmers’ net profit margin of 6.60% (TTM) serves as a reminder of the competitive scale gap MTS faces in hardware, even with favourable cycle timing.
At $2.99, Metcash offers a dividend yield of approximately 6%, supported by a payout ratio estimated at 60-70% of NPAT. The H1 FY26 interim dividend was declared on 1 December 2025. Against NPAT guidance of $268-$270 million, the yield appears sustainable at current levels.
The capital allocation picture extends beyond dividends. Management is running an ongoing share buyback programme, a signal that carries specific implications at current valuations:
| Capital Return Mechanism | Current Metric | Investor Significance |
|---|---|---|
| Dividend Yield | ~6% (fully franked) | Income floor at current price levels |
| Payout Ratio | 60-70% of NPAT | Sustainable against $268-$270m guidance |
| Buyback Programme | Ongoing | EPS accretive at sub-11x earnings |
Management returning capital via buybacks at these price levels implies a view that the stock is undervalued relative to intrinsic value. Capital allocation decisions of this nature only make economic sense if the board believes the shares are priced below the present value of future cash flows.
The bear case against MTS is not fabricated. Wholesale intermediaries carry permanent structural ceilings on multiple expansion, customer concentration risk is embedded in the food division, and the hardware recovery has already slipped once. These are legitimate constraints.
The bull case, however, rests on three specific conditions:
MTS will not re-rate to 29x like Coles or anywhere near Woolworths’ levels. The structural ceiling is real. Investors entering at current levels should calibrate expectations to the analyst consensus range of $3.43 to $3.80, not to a multiple re-rating scenario.
At sub-11x earnings with a 6% yield and buyback support, the downside is cushioned even if the hardware recovery is delayed. The 26% prior decline has done the market’s work in pricing risk; the cost programme and hardware cycle are the variables that determine whether upside is captured.
The weight of evidence, including the analyst consensus Buy rating, the MFAM target of $3.80, and the valuation floor established by the dividend yield, suggests the current discount overshoots structural risk rather than appropriately prices it. That conclusion, however, is conditional on execution.
The full FY26 results are expected in June 2026 and will provide the first complete view of segment-level performance since the trading update. Key metrics to monitor:
The 11 May trading update resolved some uncertainty and prompted the 9.12% single-session rally. The June results will be the first real test of whether management’s cost savings framing holds up under analyst scrutiny, with divisional EBIT granularity providing the data needed to validate or challenge the consensus Buy thesis at an average target of $3.43.
Metcash at $2.99 is not a valuation story that requires multiple expansion. It is a yield and cost-discipline story that pays even in a flat-market scenario: a 6% fully franked dividend, a mathematically accretive buyback, and a cost programme that contributes to 5% consensus EPS growth in FY27.
The structural ceiling is real. MTS will not trade at 25x earnings. Investors entering at current levels should calibrate expectations to the $3.43-$3.80 analyst consensus range rather than sector multiples.
The 26% prior decline has done the market’s work in pricing downside. The cost programme and hardware recovery are the variables that determine whether the upside is captured. The June 2026 full-year results will deliver the segment-level detail needed to test this thesis against divisional reality. Until then, the balance of evidence favours the patient buyer over the sceptic, provided execution follows intent.
For investors weighing whether the structural discount on ASX domestic-facing stocks like Metcash is likely to persist or narrow, our full explainer on Australian investor trends and home bias documents the shift that saw international ETFs overtake domestic ETFs as the most purchased category on Selfwealth by Syfe in Q1 2026, examining what that capital rotation means for the relative demand outlook for ASX mid-cap value names.
This article is for informational purposes only and should not be considered financial advice. Investors should conduct their own research and consult with financial professionals before making investment decisions. Past performance does not guarantee future results. Financial projections are subject to market conditions and various risk factors.
Metcash is a wholesale distribution company that supplies independent retailers across three segments: Food (IGA supermarket network), Liquor, and Hardware and Tools (Mitre 10, Home Timber and Hardware, and Total Tools). Unlike Woolworths or Coles, Metcash does not operate its own retail stores but instead earns revenue by supplying goods to independent retailer members.
Metcash trades at roughly 10.74x trailing earnings compared to Woolworths at nearly 69x and Coles at nearly 29x because wholesale intermediary businesses structurally command lower multiples due to thinner margins, limited own-brand pricing power, and customer concentration risk. The market also permanently discounts Metcash because it does not own its retail shopfront, which limits the operational leverage available to vertically integrated supermarket chains.
Metcash announced a cost savings programme targeting at least $25 million in annualised savings from FY27, comprising $15 million in labour savings and $10 million from non-trade procurement reductions. After applying a 30% corporate tax rate, the after-tax benefit is roughly $17-$18 million, contributing to the consensus FY27 EPS growth forecast of approximately 5%.
At $2.99, Metcash offers a dividend yield of approximately 6%, fully franked, supported by a payout ratio estimated at 60-70% of net profit after tax. Against NPAT guidance of $268-$270 million for FY26, the dividend appears sustainable at current price levels.
Investors should monitor Hardware and Tools EBIT against the $175-$179 million guidance range, cost savings run-rate disclosures confirming progress toward the $25 million annualised target, Food network customer retention across the IGA wholesale network, and net debt and leverage ratios that were not disclosed in the May 2026 trading update. The full FY26 results are expected in June 2026.