
The pitch is always the same: a fat monthly distribution, a yield number pushing double digits, a fund page that makes 10% look effortless. The problem shows up on the total-return statement. Many S&P 500 income ETF investors chasing that yield have watched the plain vanilla index leave them behind, and the gap is not small. JEPI, one of the most popular names in the category, posted a year-to-date total return of just 2.68% while the S&P 500 Total Return Index climbed 13.14% over the same stretch.
The trouble now is abundance, not scarcity. Roughly 15 to 20 S&P 500 income ETFs compete for the same dollars, each waving a high yield, but the spread between the best and worst total-return performers in this group is enormous. Goldman Sachs’ $2.25 billion acquisition of options-ETF specialist NEOS tells you institutional capital is pouring into this space, which makes picking the right fund more consequential, not less.
What follows here is a ranked, evidence-based look at which strategies and funds are genuinely delivering and which are quietly eroding capital while cutting distribution cheques. By the time you finish, you will have a clear framework for comparing these funds on the only metric that ultimately decides your outcome: total return relative to VOO.
Why total return, not yield, is the only number that matters for S&P 500 income investors
Start with a distinction that reshapes everything: distribution yield and total return are not the same thing, and the difference is where most income investors lose money without realising it.
Distribution yield tells you how much cash a fund pays out. Total return tells you what actually happened to your wealth, combining the price movement of the fund’s holdings with the income it distributed. A fund can pay a spectacular yield and still shrink your capital if part of that distribution is simply your own money handed back to you, a mechanism known as return of capital.
Return of capital disguised as income is not unique to options-overlay ETFs; across high-yield fund structures more broadly, gradual NAV erosion and PIK interest inflate reported yields while the investor’s real wealth quietly shrinks, following the same mechanical pattern that makes stated yield an unreliable total-return proxy.
Total return has three components, and all three deserve your attention:
- Price appreciation: the change in the value of the fund’s underlying holdings.
- Income distributions: the cash paid out to shareholders.
- Reinvestment effect: the compounding that happens when distributions are reinvested rather than spent.
This is why VOO, the Vanguard S&P 500 ETF, serves as the benchmark for judging every income fund. It carries no options overlay, participates fully in the market’s upside, and compounds without the drag that comes from capping gains for premium income. It is the clean baseline against which every clever income strategy must justify itself.
The benchmark to beat The S&P 500 Total Return Index posted 13.14% year-to-date and 20.38% over the trailing 1-year as of 24 September 2026. Any income ETF you consider should be measured against these numbers, not against its own yield headline.
So the right question is not “which fund pays the most?” It is “which fund beats VOO, or at least trails it least, on a total-return basis while still delivering meaningful income?”
Here is the uncomfortable arithmetic. If a fund pays you 9% in distributions while producing a 3% total return, you are not earning 9%. You are receiving roughly six percentage points of your own capital back, dressed up as income, with extra steps in between. That is the trap this analysis is built to help you avoid.
When big ASX news breaks, our subscribers know first
The funds actually beating the market: OVL and GPIX make the case for disciplined partial overlays
The good news is that beating the benchmark while collecting high income is not a fantasy. Two funds are doing exactly that, and the reasons are structural rather than lucky.
Start with OVL, the Overlay Shares Large Cap Equity ETF. It leads the category on total return, and the mechanism explains why. Instead of selling covered calls, OVL sells cash-secured puts on the S&P 500, collecting premium for taking on downside risk.
The consequence matters enormously. When the market rallies, those puts expire worthless and the portfolio keeps every bit of the upside. There is no strike price capping the gains.
The record backs it up. As of 24 September 2026, OVL posted a year-to-date NAV total return of 14.88% and a trailing 1-year NAV total return of 23.21%, beating the S&P 500 Total Return Index on both counts. It did that while paying an annualised distribution rate of 10.28% as of 30 June 2026.
Outperforming the index, not just tracking it OVL’s trailing 1-year NAV total return of 23.21% outpaced the S&P 500 Total Return Index’s 20.38% over the same period. That is high income and market-beating growth in the same package.
Then there is GPIX, the Goldman Sachs S&P 500 Premium Income ETF, the strongest of the covered call funds. Its edge comes from a dynamic 25-75% call-writing overlay applied to a full S&P 500 replica, meaning it only ever writes calls on a portion of the portfolio rather than the whole thing.
That partial approach is the difference-maker. GPIX captures roughly 85.7% of SPY’s total return while still generating substantial income, which is precisely what a fully overwritten fund cannot do.
| Fund | Strategy Type | YTD Total Return | Trailing 1-Year Total Return | Distribution Yield |
|---|---|---|---|---|
| OVL | Cash-secured put writing | 14.88% | 23.21% | 10.28% |
| GPIX | Dynamic 25-75% covered call | 13.87% | 18.02% | ~8.07% |
| VOO (benchmark) | No overlay | 13.14% | 20.38% | Market yield |
GPIX carries $4.72 billion in assets and an expense ratio of 0.29%, with year-to-date total return of 13.87% and a trailing 1-year of 18.02% as of 23 September 2026.
Goldman Sachs Asset Management’s GPIX fund data discloses that approximately 91.1% of the fund’s distributions carried a return-of-capital classification as of August 31, 2026, a tax efficiency feature that distinguishes GPIX from peers paying ordinary income and adds a meaningful after-tax dimension to its already competitive total-return profile.
What these two funds prove is that the “income versus growth” tradeoff is a false choice if the strategy is right. OVL’s put-writing preserves your upside entirely; GPIX’s partial overlay preserves most of it. The tradeoff you actually make is between the two of them, and which one fits depends on whether growth or income sits higher on your priority list.
Why JEPI has disappointed: the structural cost of selling away your upside
Now to the fund most likely sitting in your portfolio already. JEPI, the JPMorgan Equity Premium Income ETF, has a powerful brand and a large following, and its total-return record over the current bull market has been poor. The reason is not a bad year or a wrong bet. It is the design itself.
JEPI writes at-the-money (ATM) calls, meaning it sells options at strike prices right around the current market level. That generates rich premium income, but it also caps the fund’s upside almost immediately whenever the market rises.
Three structural mechanisms drag its total return in a bull market:
- Upside capped at the strike: when the S&P 500 climbs above the strike price, JEPI does not participate in those gains because it has already sold them away.
- Premium fails to offset a strong rally: the income collected from selling calls rarely matches what a powerful market advance would have delivered in price gains.
- Compounding shortfall on capped capital: because the underlying capital grows more slowly than the market, the compounding base is smaller every year, and that gap widens over time.
The consequence for a long-term investor is not a rounding error. It is the difference between hitting your retirement number and falling materially short of it.
What the multi-year record actually shows
A single year could be a fluke. The multi-year record removes that excuse.
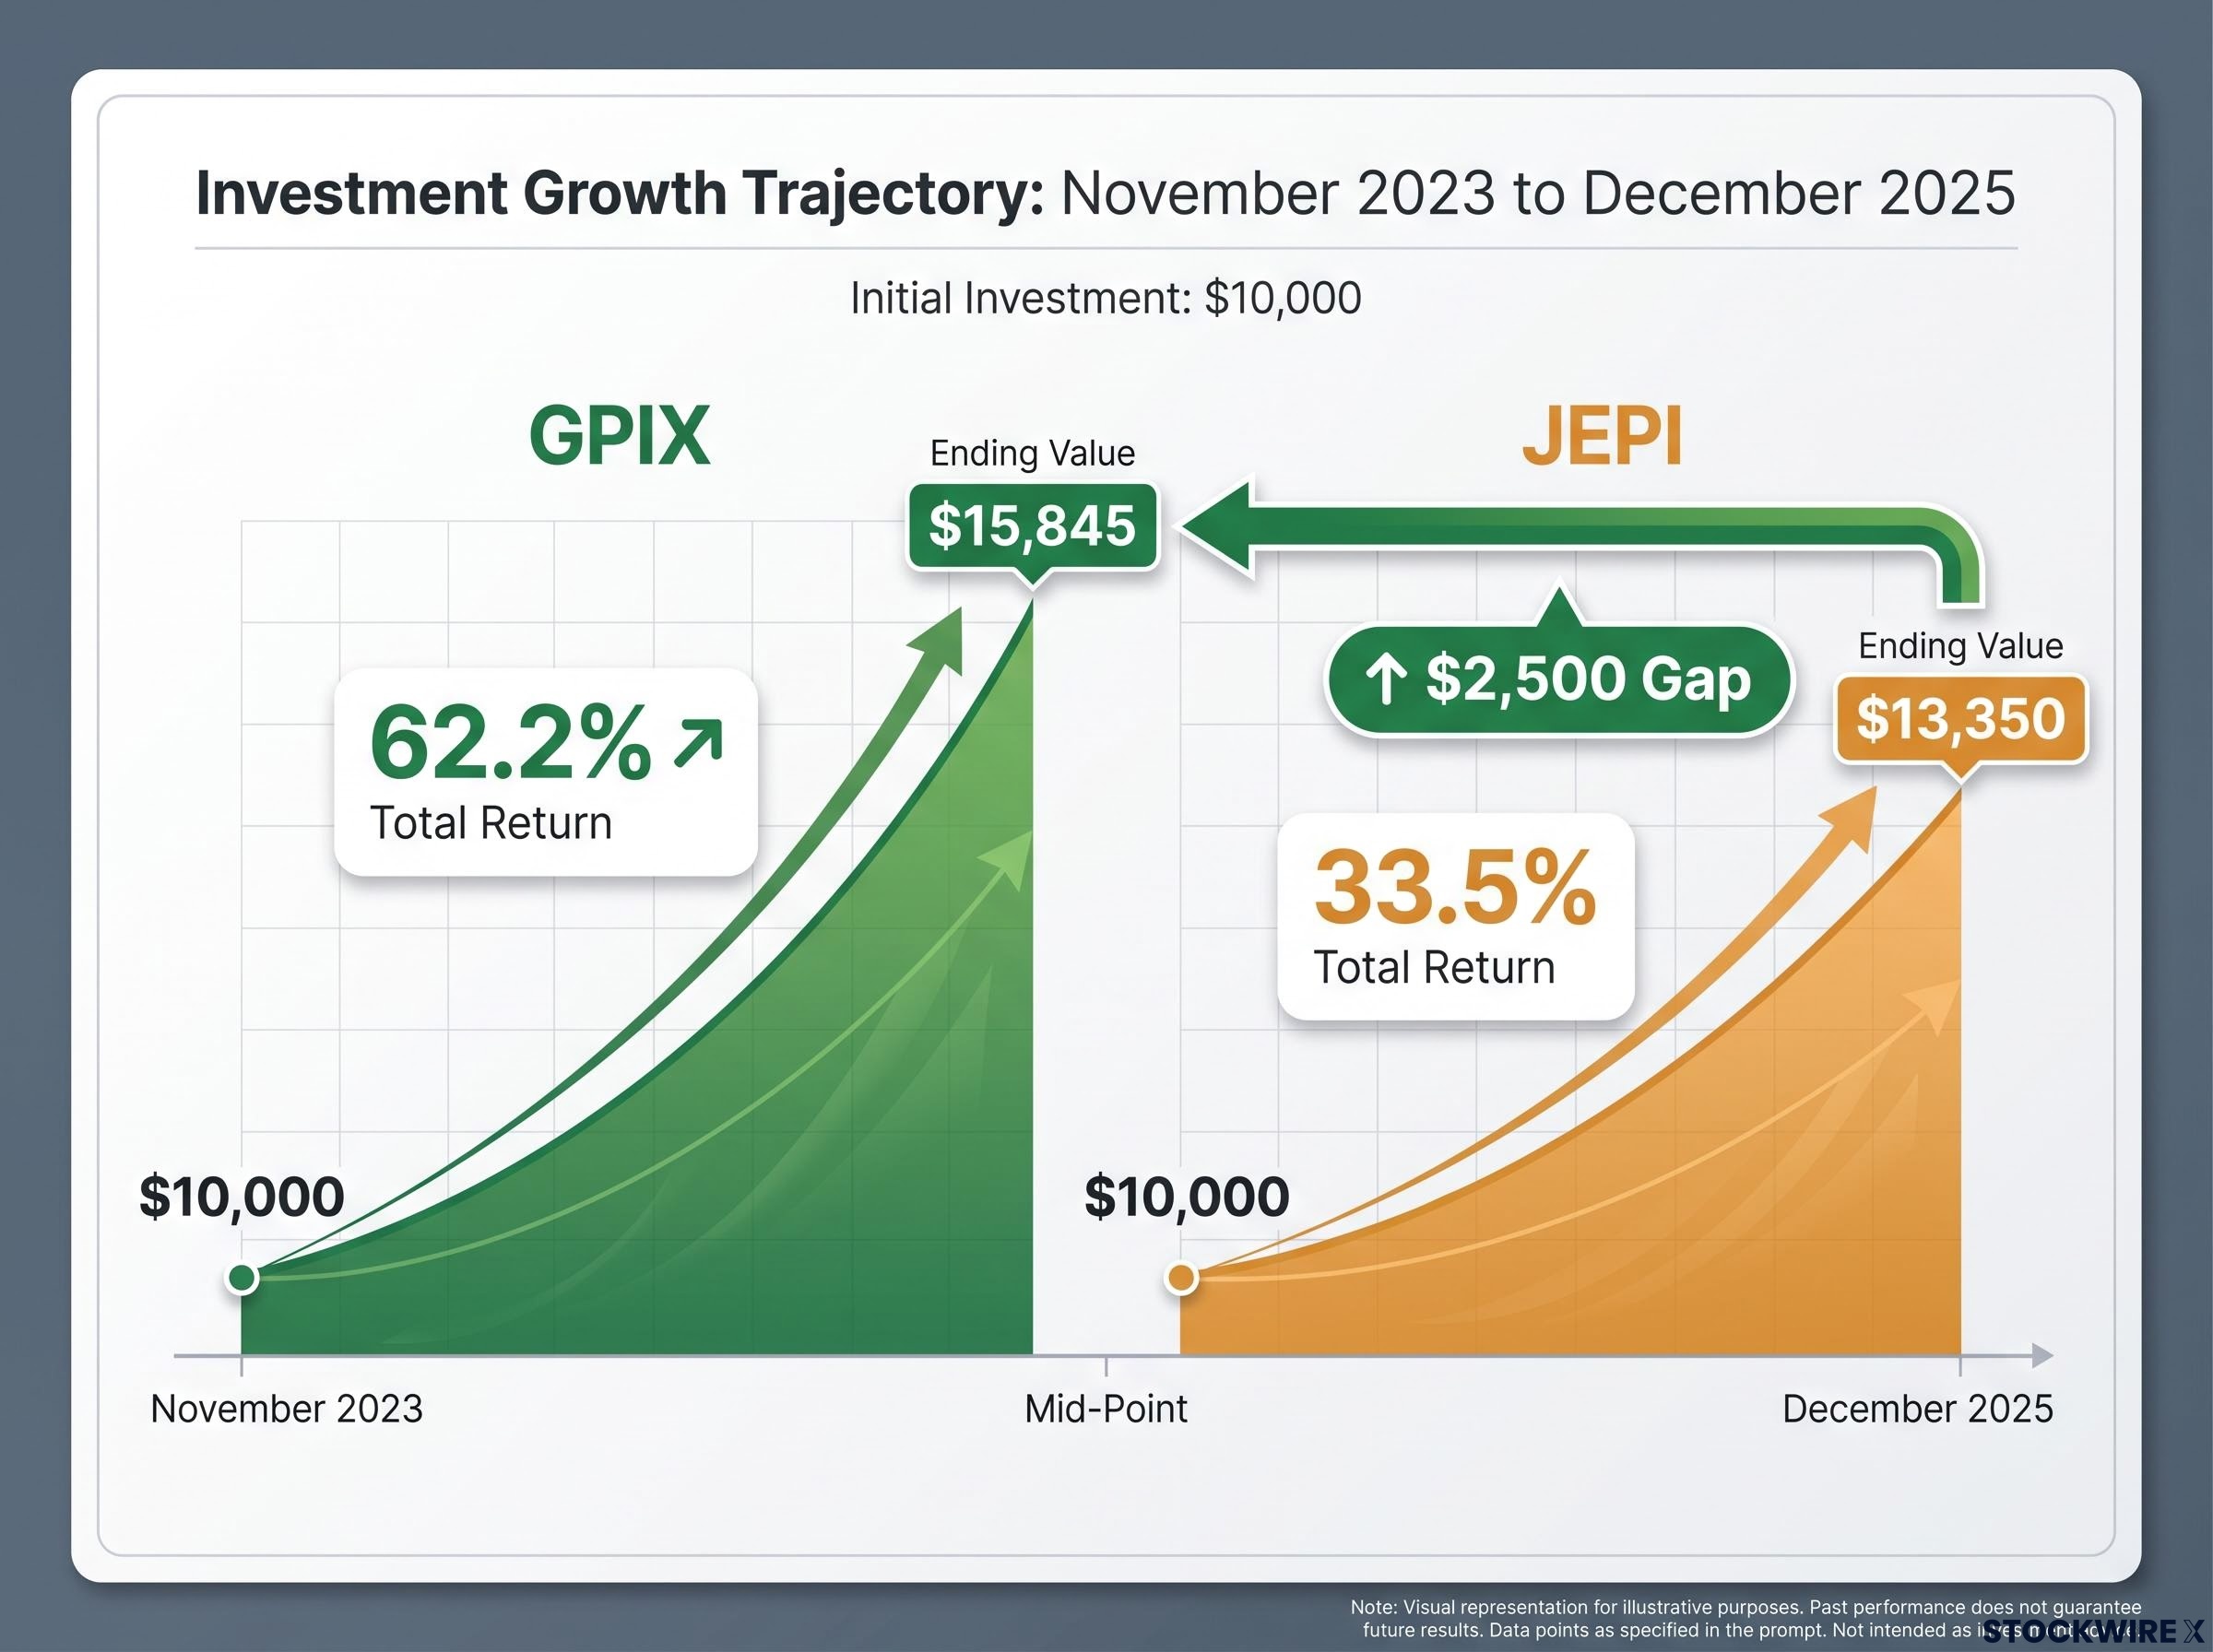
The compounding cost, in dollars A $10,000 investment in JEPI from November 2023 to December 2025 grew to roughly $13,350, a total return of about 33.5%. The same $10,000 in GPIX grew to about $15,845, a total return of roughly 62.2% over the identical period.
That is a gap of nearly $2,500 on a $10,000 stake, and it compounds. Scale that to a real retirement balance and the shortfall becomes the sort of number that changes your plans.
The middle ground exists too. SPYI, the NEOS S&P 500 High Income ETF, posted a trailing 12-month total return of 15.53% as of 22 September 2026, better than JEPI but still behind OVL’s 18.82% over the same window.
The psychological trap is worth naming plainly. A high stated yield feels like income security, but if the underlying capital is compounding far below the market, you are exposed to sequence-of-returns risk: the danger that drawing income from a slow-growing base erodes the portfolio faster than it can recover. What looks like safety on the fund page can be a slow leak on the statement.
Beyond covered calls: how XP, BALI, zero-DTE funds, and leveraged strategies fit the income landscape
The category does not end at covered calls. Its outer edges hold funds worth understanding, if only so you can recognise what you are looking at when a new product appears with an eye-catching yield.
XP takes a different route entirely. It targets a 20% annual distribution yield through a managed distribution model, using no options and no leverage, and it slightly outperforms VOO on total return. Think of it as a structured drawdown service rather than an options overlay, with the target yield reset each year.
BALI, BlackRock’s active equity income fund, is characterised in source analysis as a structurally superior alternative to JEPI for investors who want active stock selection instead of pure index exposure. Specific recent performance figures could not be confirmed, but its edge is attributed to equity factor tilts and less aggressive upside capping rather than to any single year’s luck.
Then come the more exotic corners. Zero-DTE funds such as XDTE, WDTE, and SPYT use zero-day-to-expiration options, resetting their positions daily rather than monthly. Leveraged covered call funds like XSPI and TSYX amplify the standard overlay, with XSPI reported to deliver around 15-16% yield and TSYX running a 130% daily leveraged strategy that has lagged its leveraged peers.
Zero-day-to-expiration mechanics introduce path-dependence and dealer gamma flows that differ structurally from monthly or weekly options overlays; because dealers must hedge intraday positions with magnified urgency near the close, daily-reset funds can be forced to sell premium at the worst moments in a volatility spike rather than at the orderly points a monthly schedule would target.
| Fund | Strategy Category | Key Structural Feature | Total-Return Profile |
|---|---|---|---|
| XP | Managed distribution | No options, no leverage; 20% target yield | Slightly ahead of VOO |
| BALI | Active equity income | Factor tilts, less aggressive capping | Reported superior to JEPI |
| XDTE | Zero-DTE options | Daily-reset intraday premium capture | Path-dependent, cost-heavy |
| XSPI | Leveraged covered call | ~15-16% yield; amplified overlay | Not independently confirmed |
| TSYX | Leveraged covered call | 130% daily leveraged swaps | Lags leveraged peers |
The zero-DTE approach carries specific structural drawbacks worth weighing before you buy:
- High turnover from resetting positions every single day.
- Path-dependence, where daily resets can force the fund to sell into volatility spikes at the worst moments.
- Transaction drag that quietly erodes net returns over time.
The SEC investor bulletin on complex ETF risks specifically flags daily-resetting structures as prone to performance divergence over longer holding periods, a warning that maps directly onto zero-DTE funds whose intraday premium capture can compound path-dependence losses in ways that are not visible in short-window return snapshots.
The honest read is this: the outer edges of the category add cost and complexity that most income investors simply do not need. Traditional non-leveraged overlays have generally outperformed their leveraged alternatives over recent market cycles, and for a long-term holder, the simpler partial-overlay funds deliver better risk-adjusted outcomes.
How to pick an S&P 500 income ETF: a decision framework for total-return-first investors
Enough diagnosis. Here is how to turn all of this into a choice you can actually make.
The decision comes down to three variables, worked through in order:
- Determine how much upside you are willing to sacrifice for income. The more aggressively a fund overwrites the index, the more current income you get and the more long-term growth you surrender. OVL sacrifices almost none; JEPI sacrifices a great deal.
- Decide between index exposure and active stock selection. Most of these funds track the S&P 500 directly. A minority, like BALI, pick stocks actively, which can help or hurt depending on the manager.
- Match your time horizon to a distribution versus compounding priority. A long horizon favours compounding and argues for lighter overlays. A short horizon or an immediate cash need shifts the balance toward higher current distribution.
Run those three filters and specific funds fall out for specific investors:
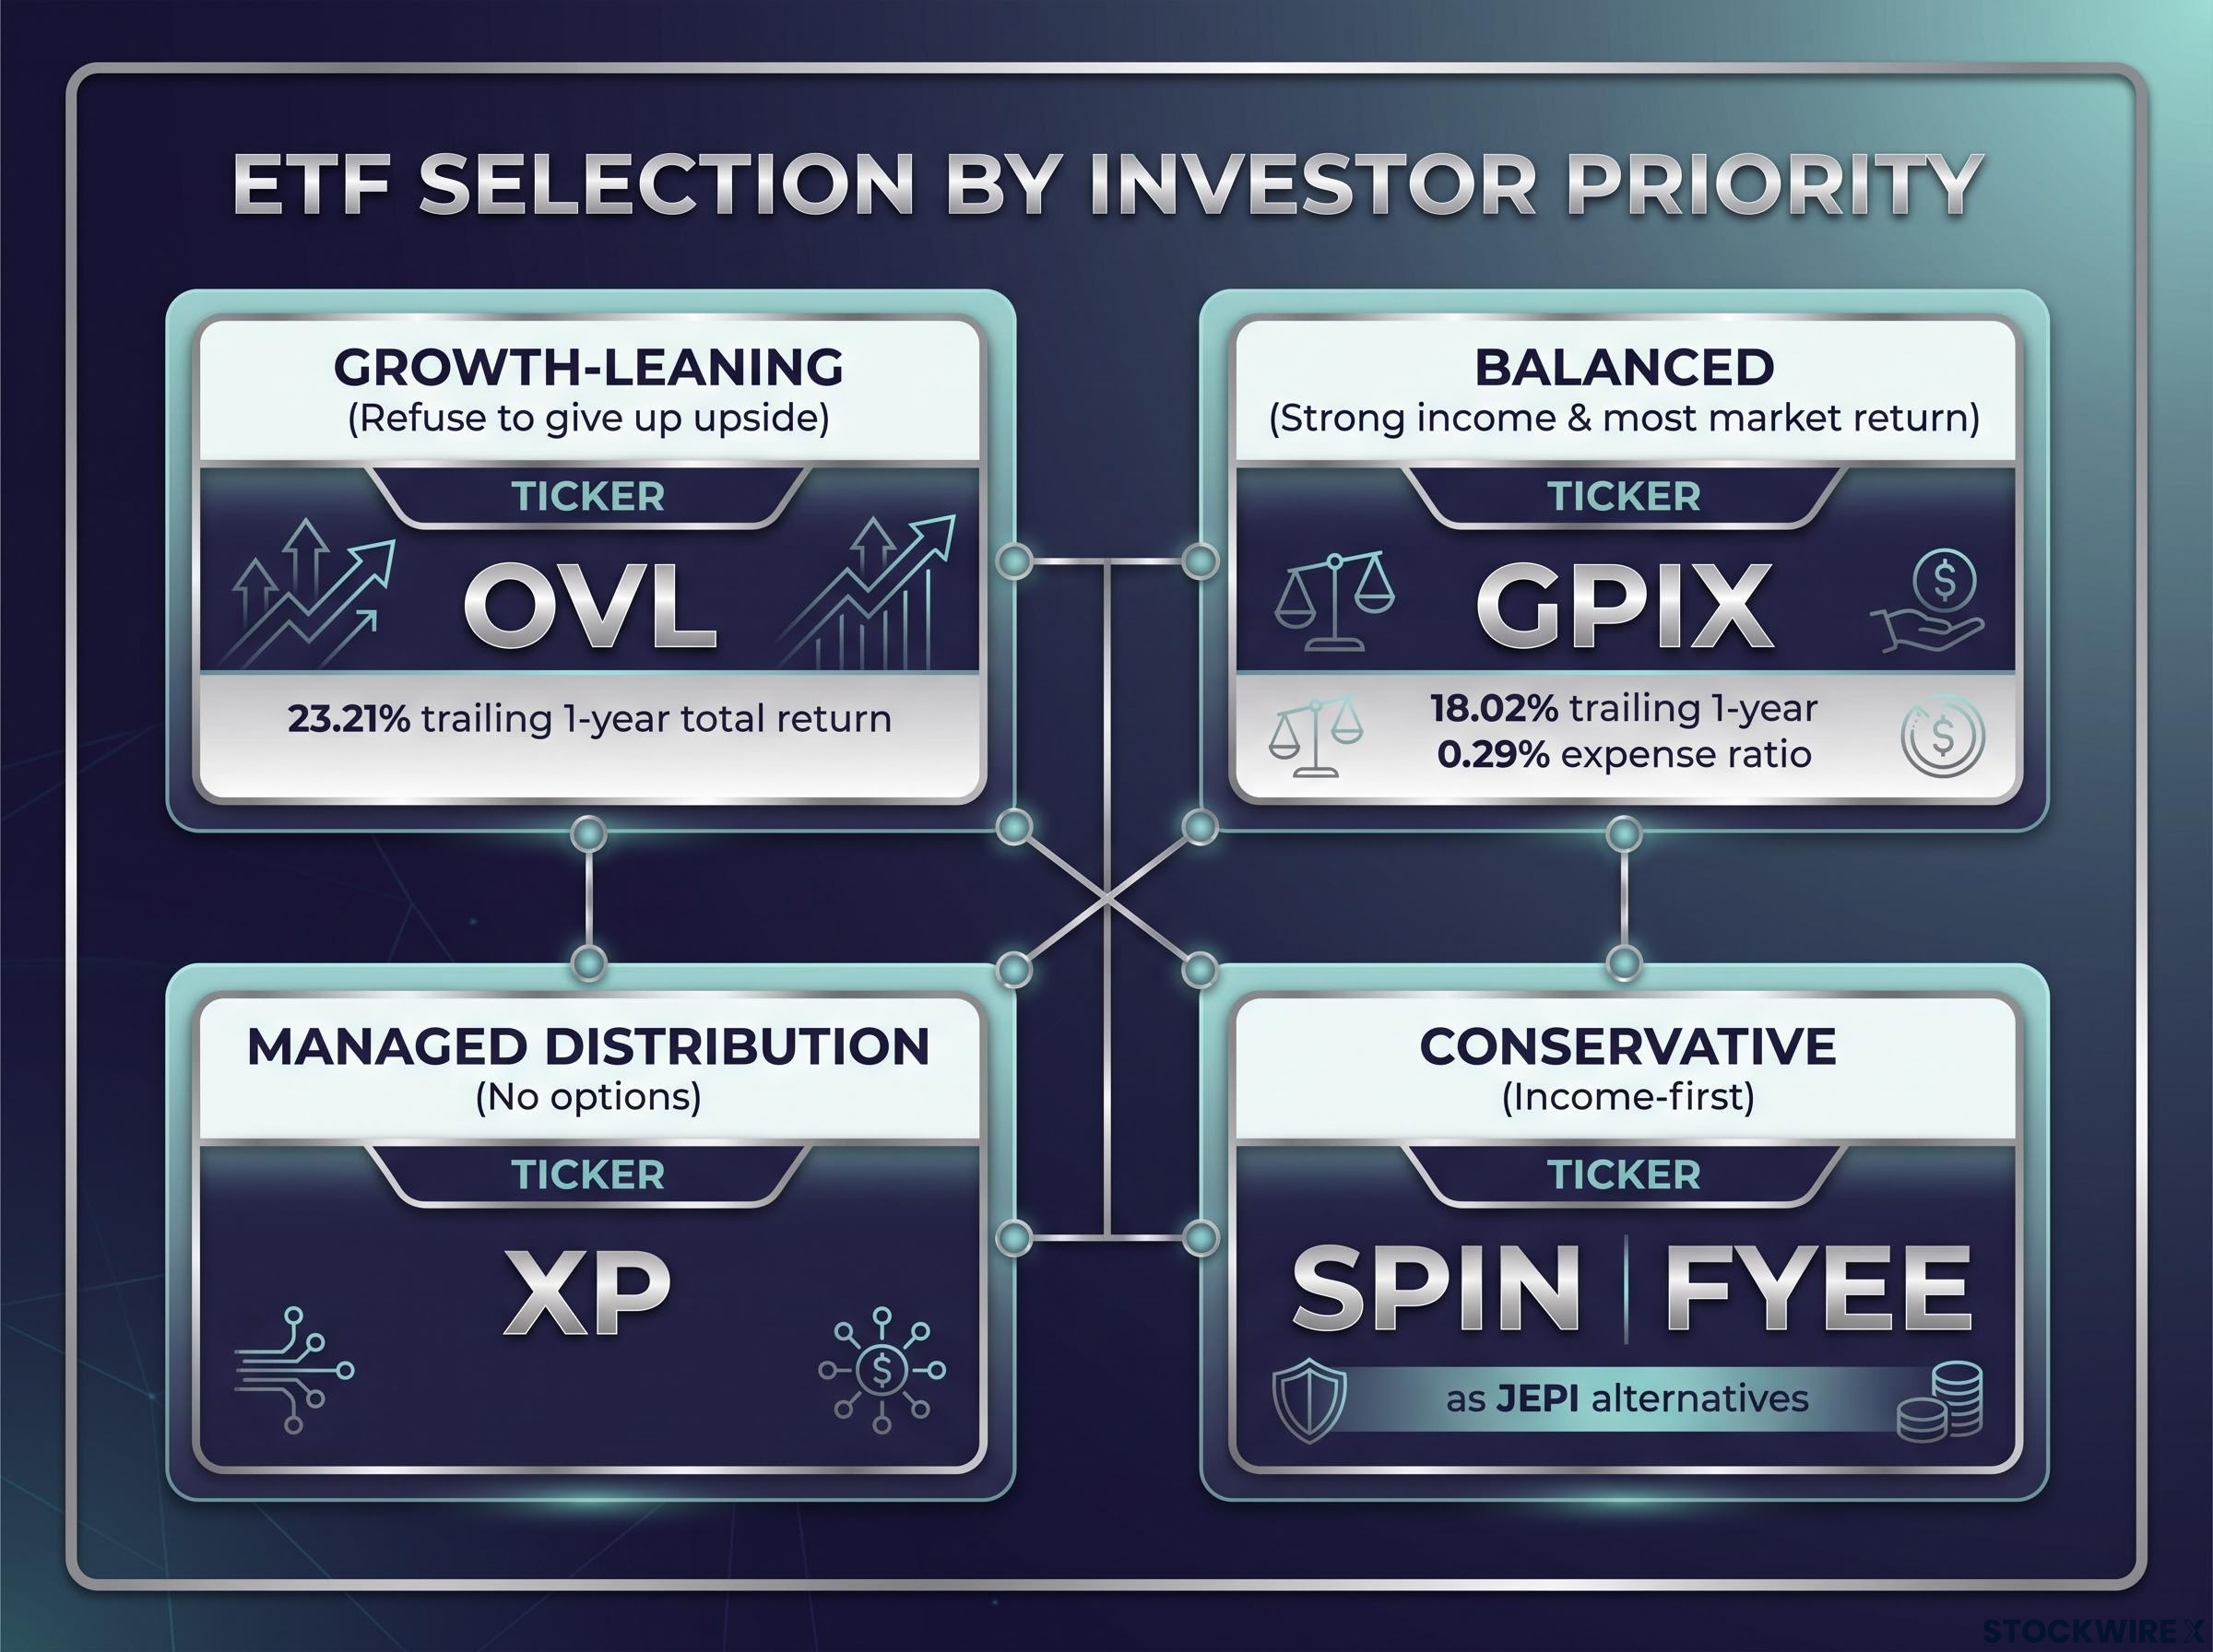
- OVL for growth-leaning income investors who refuse to give up market upside, backed by its 23.21% trailing 1-year total return.
- GPIX for balanced income investors who want strong income and most of the market’s return, with a 0.29% expense ratio and an 18.02% trailing 1-year.
- XP for those who want a managed-distribution product with no options machinery under the hood.
- JEPI alternatives such as SPIN from State Street and FYEE from Fidelity for conservative, income-first retirees who accept benchmark lag in exchange for high current cash flow.
For most total-return-oriented income investors, GPIX and OVL are the sensible default starting points. JEPI’s 2.68% year-to-date total return is the cautionary figure to keep in mind before branching into anything more specialised.
The principle underneath all of it is simple. Choose the fund that fits your total-return goals first and your yield preference second, because over a long horizon the market’s upward drift makes upside participation the dominant driver of where you end up.
This article is for informational purposes only and should not be considered financial advice. Investors should conduct their own research and consult with financial professionals before making investment decisions.
Where the income ETF category is heading, and what it means for your next allocation decision
The central finding survives the details: strategy type, not fund brand or yield headline, is what determines your total-return outcome in this category. A partial overlay beats a full overwrite. A put-writing structure beats a call cap in a rising market. Every fund comparison above pointed the same direction.
That lesson is about to be tested by a wave of new products.
Options market volatility signals matter directly to income ETF performance: elevated implied volatility fattens the premiums that funds like GPIX and OVL collect, while the VIX futures curve through year-end shapes the income environment for every covered call and put-writing strategy in this category.
The institutional signal Goldman Sachs’ $2.25 billion acquisition of options-ETF specialist NEOS shows that major institutions are accelerating development of dynamic options strategies. The category is set to expand, and the marketing will get louder.
Through September 2026, non-leveraged partial-overlay funds like OVL and GPIX have structurally outperformed both fully overwritten and leveraged alternatives across the evaluated periods. That is the pattern to hold onto as new entrants arrive.
Here is your monitoring posture from here. Track the funds with partial or flexible overlays, not the ones flashing the highest stated yield. As even richer yield headlines appear, the investor who anchors every decision to total return will sidestep the marketing noise that left so many JEPI holders trailing the market for years.
Past performance does not guarantee future results. Financial projections are subject to market conditions and various risk factors.