
What Domino’s Q1 Results Reveal About the Consumer Spending Slowdown
15 hrs ago

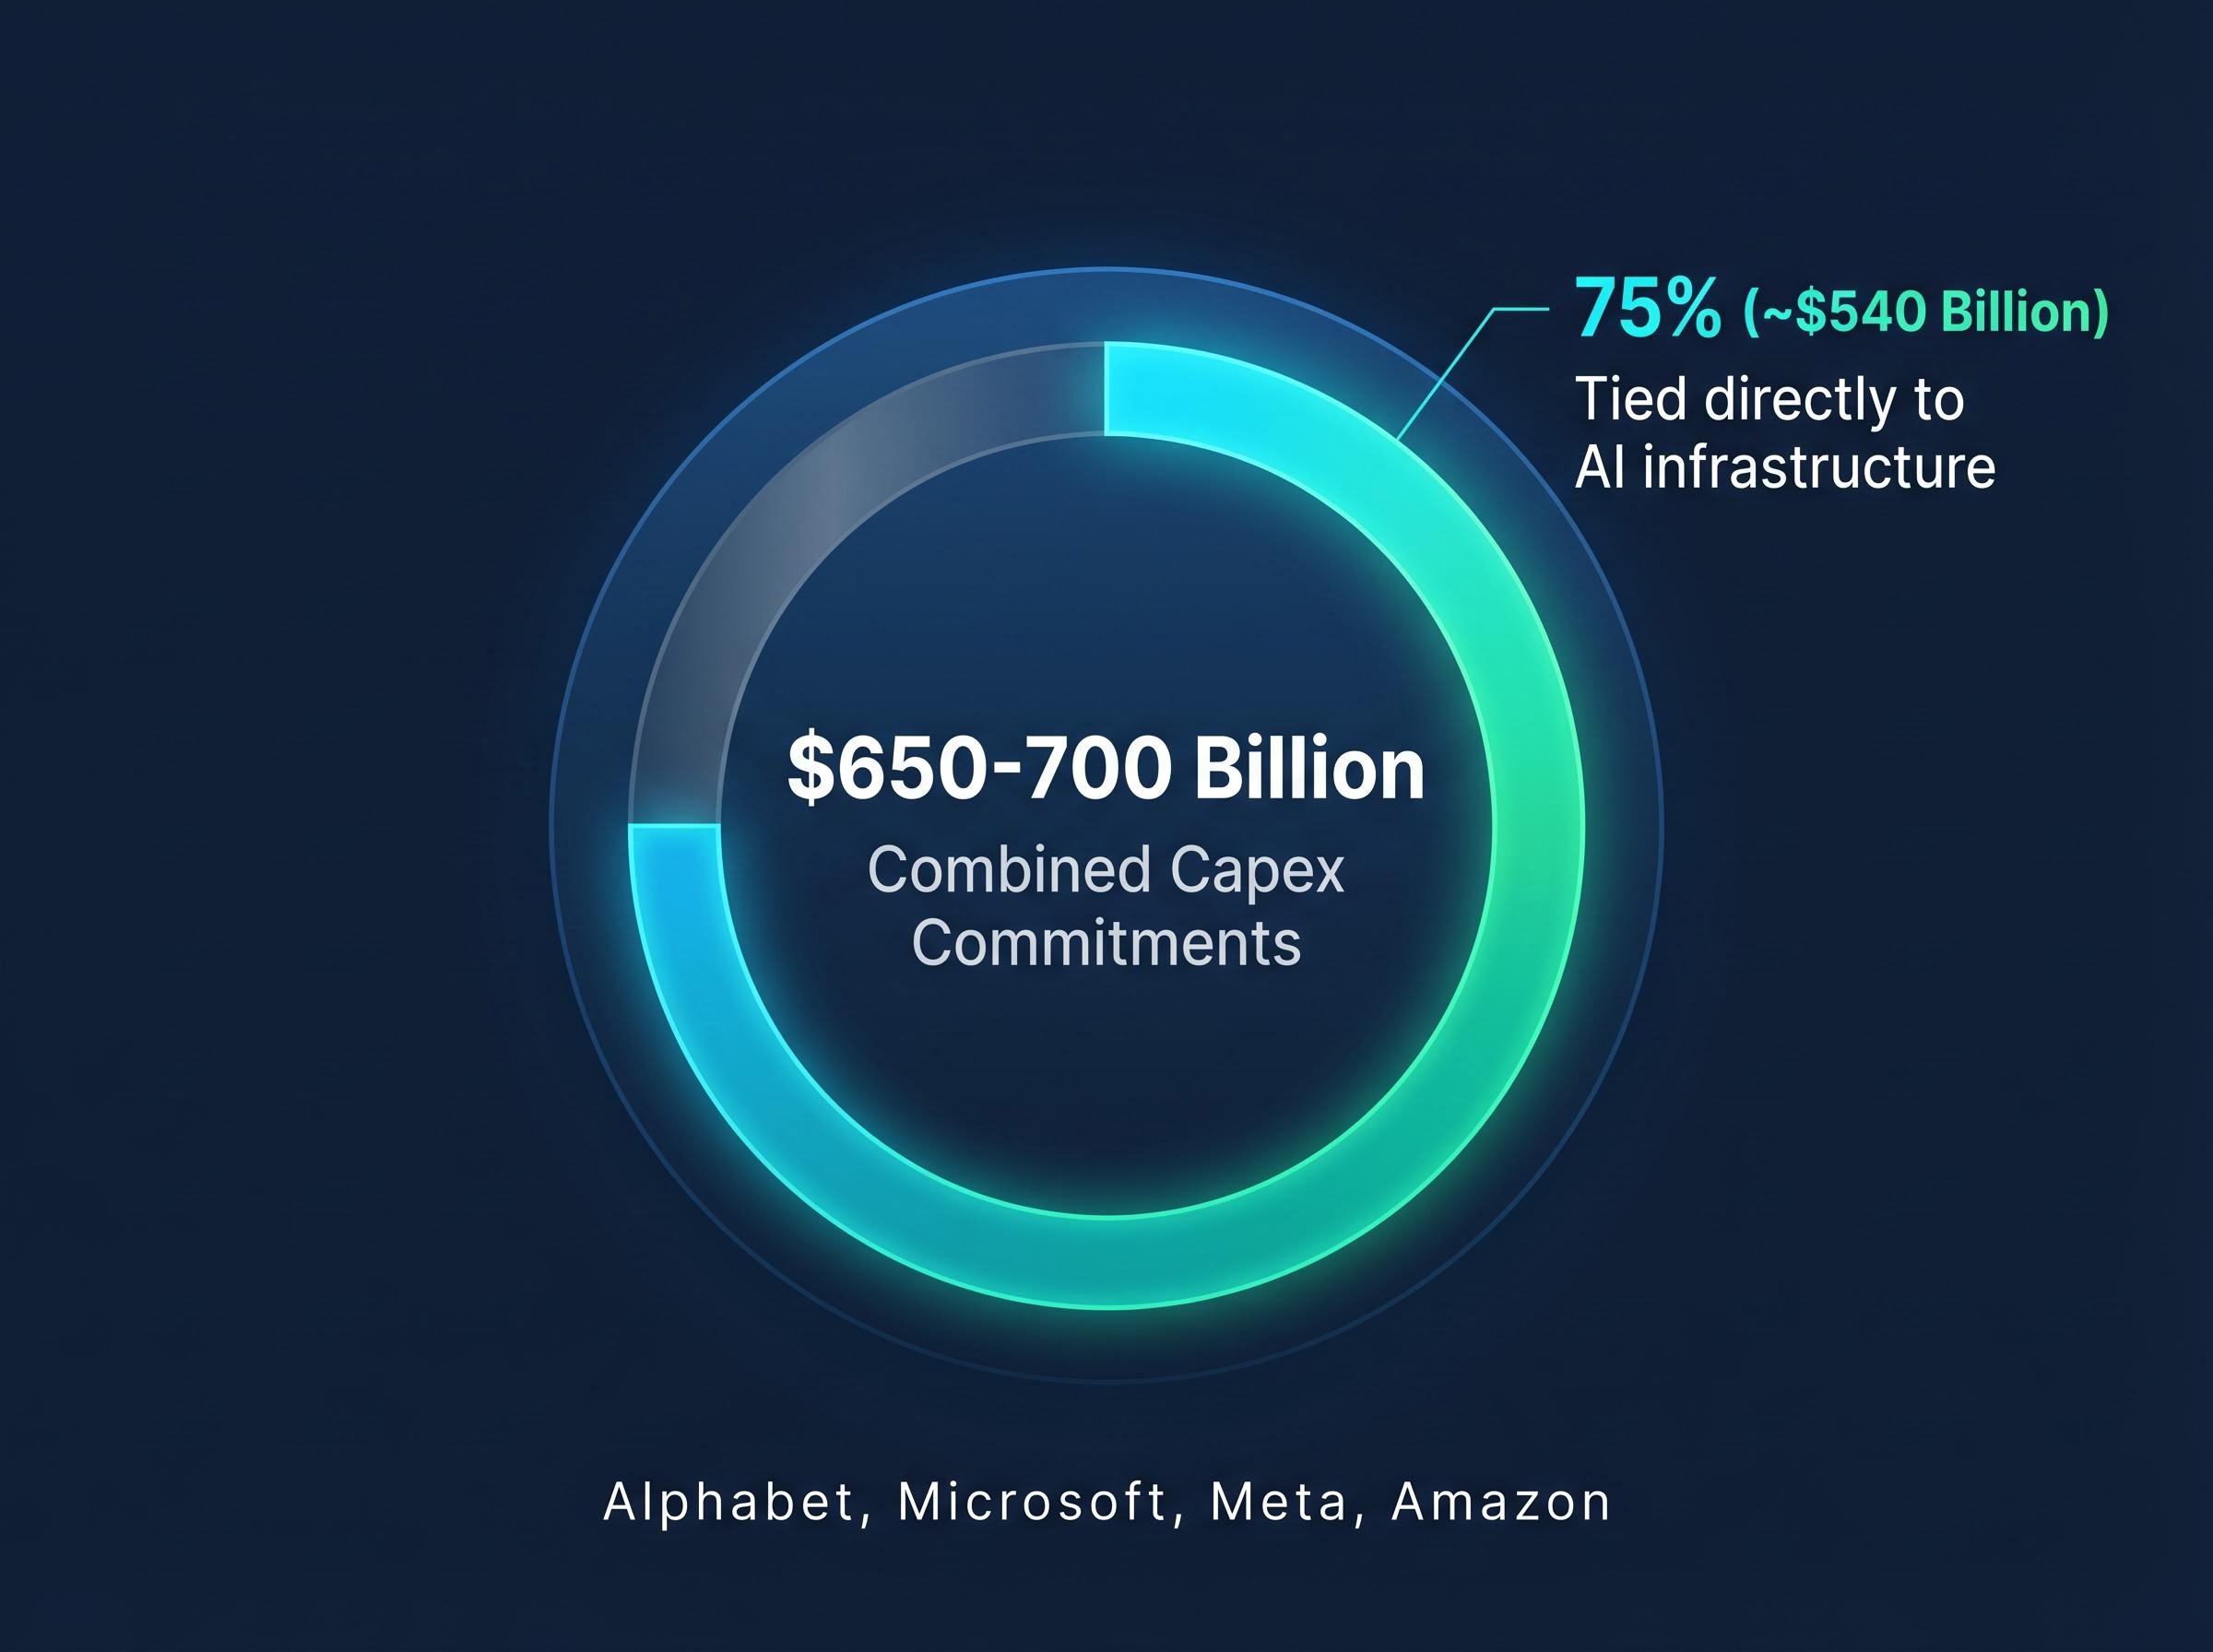
“`json { “fact_checked_full_article”: “Four companies that collectively represent more than 18% of the S&P 500 report earnings on the same day this week, and every one of them is deploying capital at a pace that would have drawn scepticism from their own boards two years ago. On 29 April 2026, Alphabet, Microsoft, Meta, and Amazon deliver Q1 results against a backdrop of $650-700 billion in combined capital expenditure commitments, a 75% year-over-year acceleration in hyperscaler infrastructure spending, and a market that has already punished all four stocks for the opacity of AI return timelines. These are not routine quarterly updates. They are the first major checkpoint in a multi-year spending cycle that is compressing near-term earnings while producing early, uneven signals that the money is finding its way to revenue. What follows is a structured framework for evaluating what each company is betting, where the scepticism is warranted, and which signals in the Q1 results will actually separate conviction from noise.\n\n## Why these four earnings reports matter more than usual right now\n\nThe concentration alone makes 29 April unusual. Microsoft, Amazon, Meta, and Alphabet account for more than 18% of the S&P 500 by weighting, meaning a single after-hours session could move the index in a way that no other earnings day this quarter can replicate.\n\nThat mechanical reality lands in a market already processing multiple sources of stress:\n\n- An AI and software sector rotation that pulled capital out of mega-cap tech names earlier in 2026\n- Geopolitical conflict and elevated oil prices adding macro uncertainty to forward guidance\n- Prior stock sell-offs tied directly to capex announcements across all four companies, with investors questioning whether spending is outpacing returns\n\nThe 75% year-over-year capex growth rate, per a February 2026 MUFG update, quantifies the scale of acceleration. The question investors are actually trying to answer on Tuesday evening is not whether AI matters. It is whether the pace and magnitude of current spending is producing anything in Q1 results that justifies the capital being deployed, or whether margins are being sacrificed for a payoff that remains years away.\n\n## The spending scoreboard: what each company has committed and why\n\nThe aggregate figure is staggering: $650-700 billion across four hyperscalers, with approximately 75% (roughly $540 billion) tied directly to AI infrastructure. But the number alone obscures meaningful differences in what each company is buying, and what each can already point to as evidence that the money is working.\n\n
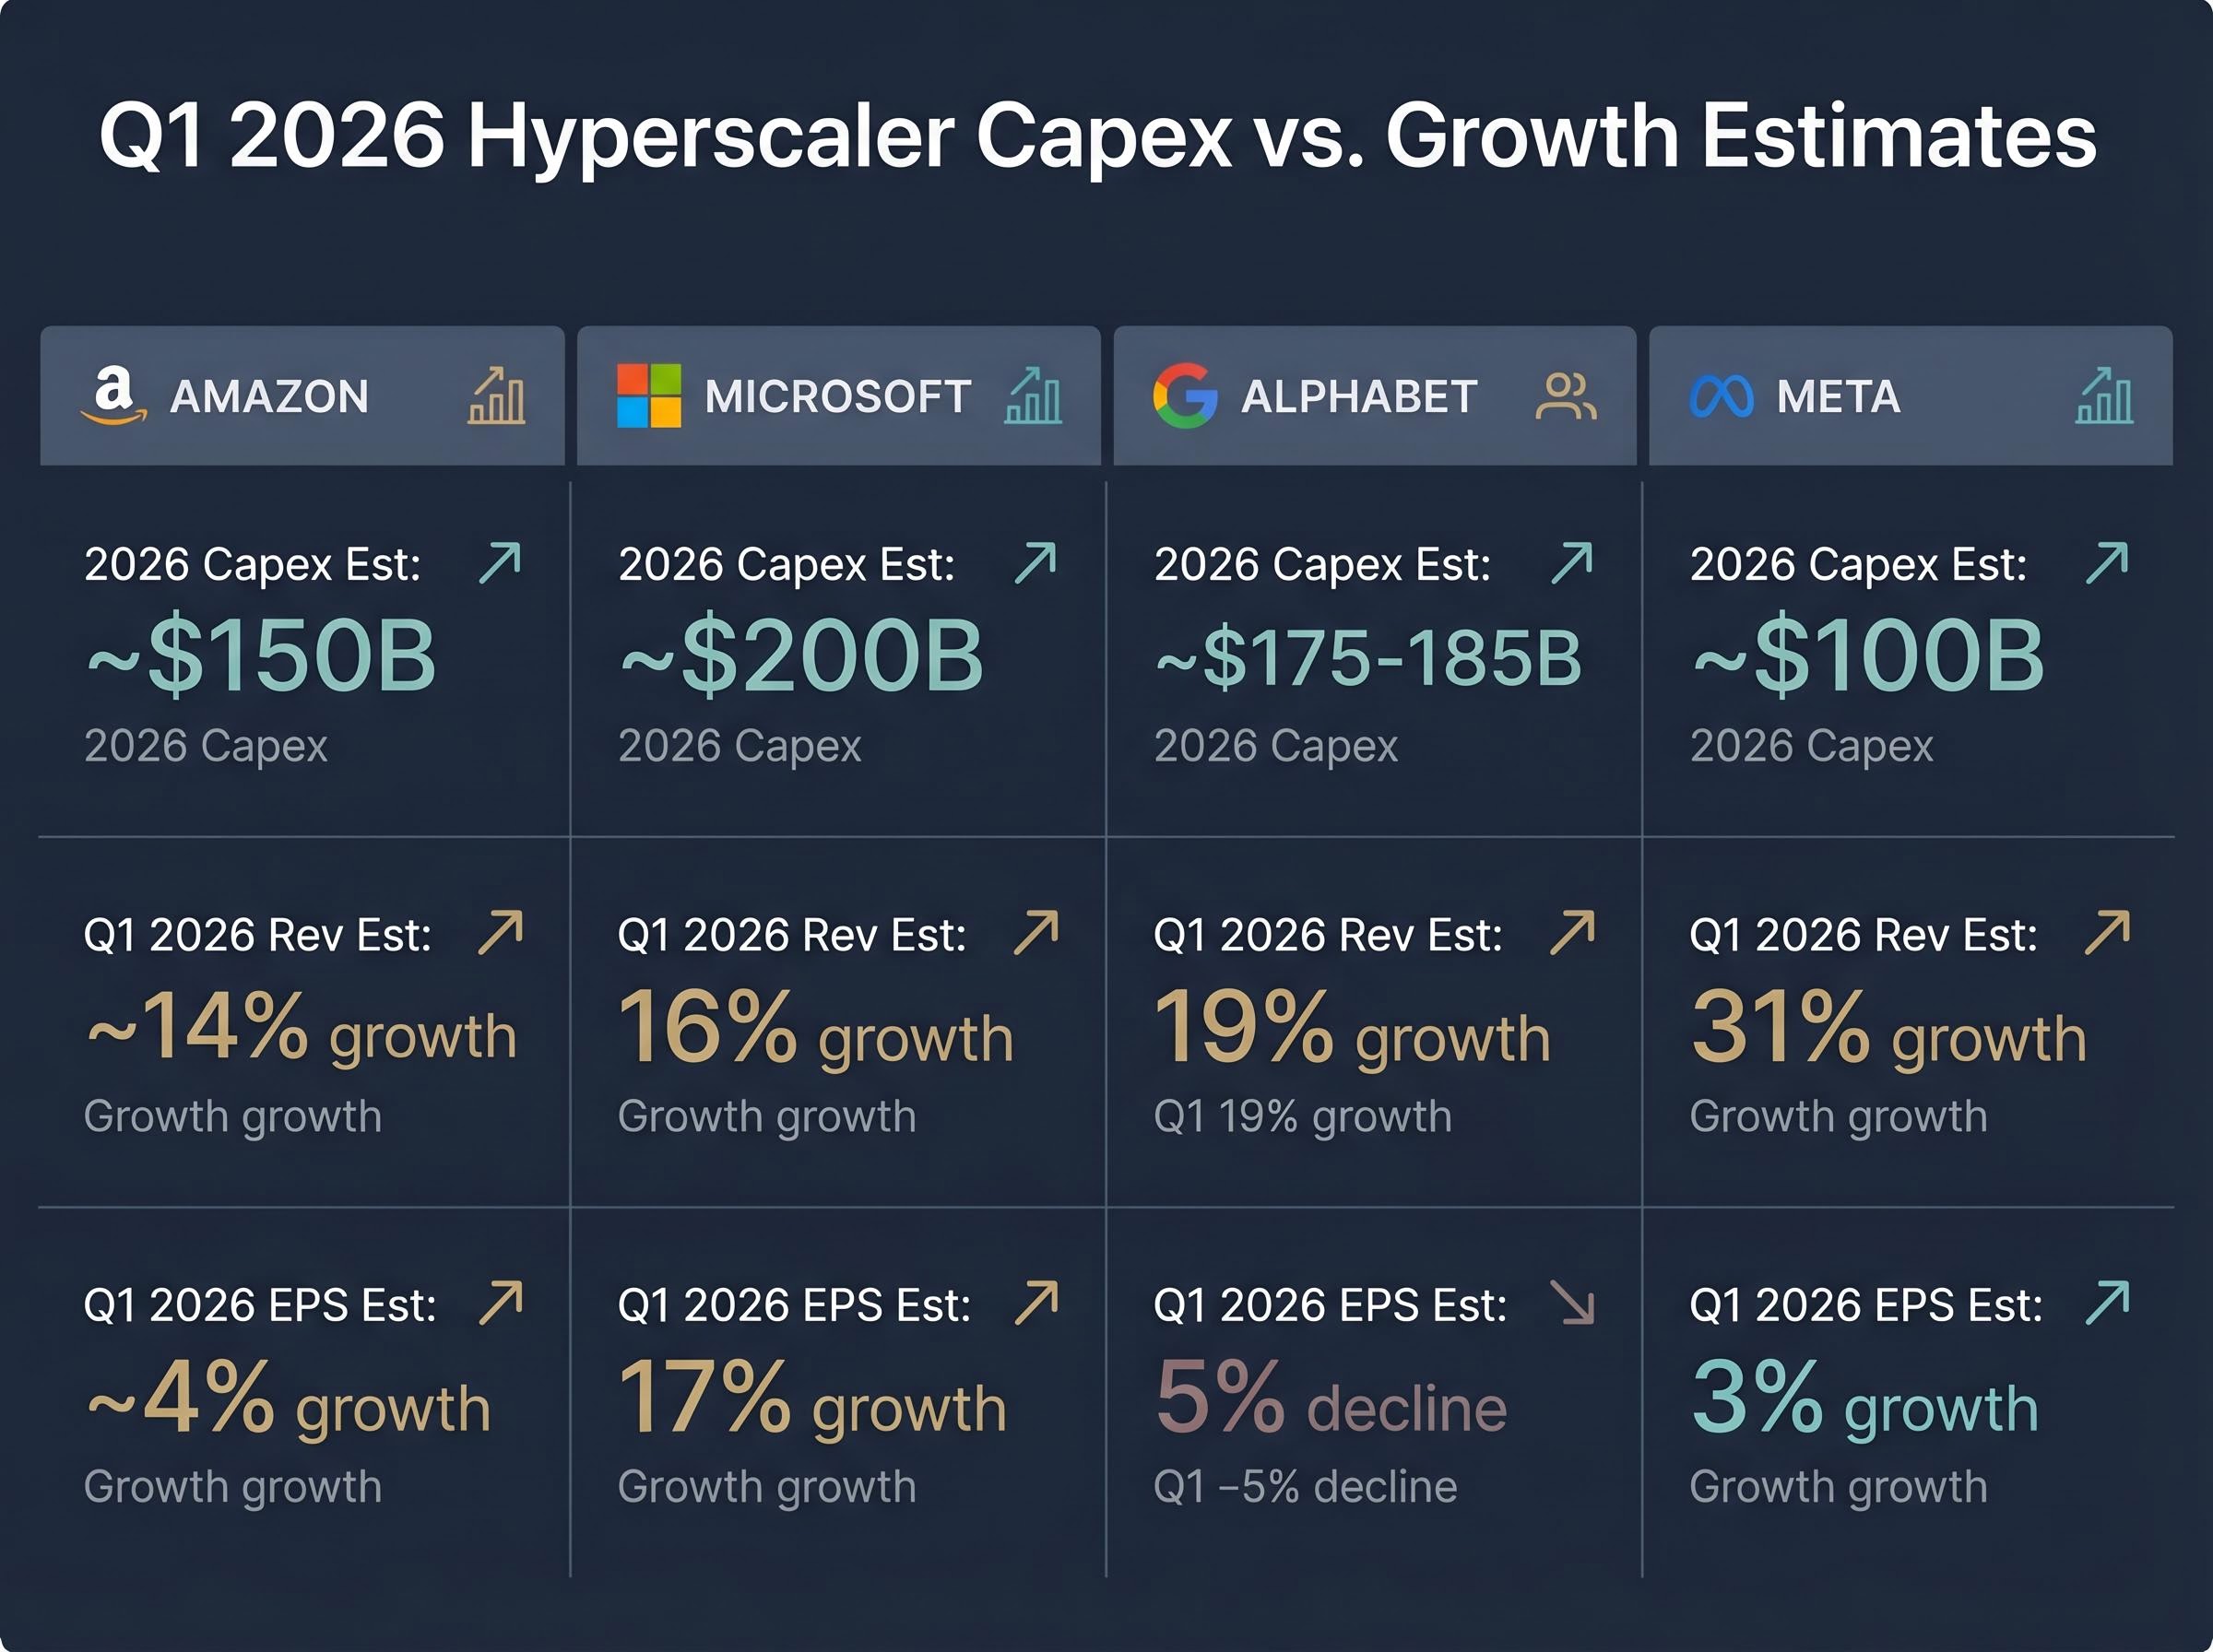
| Company | 2026 Capex Estimate | Q1 2026 Revenue Est. (YoY) | Q1 2026 EPS Est. (YoY) | Key Monetisation Signal |
|---|---|---|---|---|
| Amazon | ~$150B | ~14% growth | ~4% growth | AI chip segment at $50B annualised run rate, growing >100% annually |
| Microsoft | ~$200B (implied) | $81.4B (16% growth) | $4.06 (17% growth) | Copilot standalone product exceeding internal \”audacious\” sales targets |
| Alphabet | ~$175-185B | ~$107B (19% growth) | ~$2.62 (5% decline) | 14% Anthropic stake; potential $40B additional investment; TPU/Broadcom partnership |
| Meta | ~$100B | $55.57B (31% growth) | $6.65 (3% growth) | 31% revenue growth, offset by ~8,000 planned employee reductions signalling margin pressure |
\n
\n\nAmazon stands out as the strongest near-term monetisation case. CEO Andy Jassy’s annual shareholder letter cited an AI chip segment at a $50 billion annualised revenue run rate growing at more than 100% annually, a figure that tests the arms-race framing directly. Microsoft’s Copilot, sold as a standalone product, reportedly exceeded what Bloomberg described as the company’s own \”audacious\” internal sales targets, providing concrete evidence that enterprise AI revenue conversion is possible today, not just projected.\n\nAlphabet is running a dual-track approach: owned infrastructure through its TPU partnership with Broadcom alongside ecosystem positioning via a 14% stake in Anthropic, with a potential additional $40 billion Anthropic investment under consideration. Meta’s position is the most visually stark. The company plans approximately $100 billion in capex alongside a roughly 8,000-person workforce reduction, a pairing that expresses the margin squeeze in human terms.\n\n## How to actually evaluate an AI capex bet\n\nRaw spending figures and even double-digit revenue growth are insufficient on their own. The analytical question that separates informed positioning from reactive trading is whether capex is producing durable margin expansion on a predictable timeline. Three criteria, applied sequentially, structure that evaluation.\n\n1. Monetisation pathway clarity. Can management identify a specific revenue line item, product, or customer segment that is converting AI infrastructure spending into recurring income? Amazon’s statement that nearly all of its 2026 planned capex is already covered by existing customer commitments (per Andy Jassy’s shareholder letter) is the strongest example of demand-pull evidence currently available. Alphabet’s attribution of capex increases to \”strong demand from cloud customers\” provides a similar, if less specific, signal.\n\n2. Margin trajectory across multiple quarters. A single quarter of revenue acceleration means little if operating margins are compressing simultaneously. The relevant pattern is whether the gap between revenue growth and earnings growth is narrowing or widening over successive quarters.\n\n3. Demand pull versus competitive push. Is investment being pulled by identifiable customer demand, or pushed by competitive pressure that makes slowing down feel untenable regardless of return clarity? The 75% year-over-year capex growth rate raises this question directly: participants may feel they cannot afford to reduce spending, even if the ROI timeline remains uncertain.\n\n> IO Fund has framed the central analytical challenge as identifying \”who is translating that spend into measurable revenue and sustainable margins,\” characterising near-term monetisation as a question mark amid the scale of 2026 investment.\n\nInvestors who apply these three filters to Tuesday’s earnings commentary will be better positioned to distinguish companies with credible conversion timelines from those whose spending is primarily defensive.\n\n## The structural risks that could make the bet go wrong\n\nThree categories of risk are already visible in pre-earnings data, not hypothetical scenarios that might materialise later:\n\n- Supply-side constraints: GPU shortages, server lead times, and data centre construction capacity\n- Debt financing dependency: capex outstripping free cash flow, shifting the payback calculus\n- Margin compression: revenue growing while earnings stagnate or decline\n\n### Supply constraints and physical ceilings\n\nEven committed capex cannot deploy at will. Mandeep Singh of Bloomberg Intelligence has highlighted GPU and server supply constraints as an active bottleneck on hyperscaler capacity growth. Data centre construction timelines add a further lag between capital commitment and operational capacity. Singh’s framing carries a counterintuitive implication: the supply constraints are simultaneously a ceiling on near-term growth and a signal that underlying demand is strong enough to exhaust available supply.\n\n### Debt financing and the payback period problem\n\nMUFG’s February 2026 analysis identified a structural shift among hyperscalers toward debt financing as $700-plus billion in capex outstrips free cash flow generation. When companies move from self-funded growth to capital-markets-mediated growth, the return threshold changes. It is no longer sufficient for AI investments to cover operating costs; returns must also service the capital structure.\n\nThe arithmetic is already visible in Q1 consensus estimates. Alphabet is projected to deliver 19% revenue growth alongside a 5% EPS decline. Meta is expected to report 31% revenue growth against only 3% EPS growth. Amazon’s pattern is similar: 14% revenue growth with approximately 4% EPS growth. Across all four companies, revenue is expanding while earnings are being compressed by the weight of infrastructure investment. This is not a one-quarter anomaly; it is the structural signature of a multi-year capex cycle.\n\n## Value creation or arms race? What the evidence says heading into 29 April\n\nThe strongest bull case rests on specific, named data points. Amazon’s AI chip segment at a $50 billion annualised run rate growing at over 100% annually is not a projection; it is a disclosed revenue figure from the CEO’s shareholder letter. Microsoft’s Copilot exceeding internal sales targets, per Bloomberg reporting, demonstrates that enterprise customers are converting AI tools into paid subscriptions. These are genuine early-stage monetisation signals, not forward guidance or aspirational statements.\n\n> Andy Jassy characterised the market’s negative reaction to Amazon’s $200 billion capex announcement as premature, citing strong demand visibility and noting that nearly all planned spending is already backed by existing customer commitments.\n\nThe strongest bear case is equally specific. A 75% year-over-year capex growth rate, EPS compression across all four companies, and a structural shift to debt financing suggest that even if the investment thesis proves correct, the near-term cost is substantial and the timeline remains uncertain. Alphabet’s potential additional $40 billion Anthropic investment signals conviction, but its projected 5% EPS decline signals the price of that conviction in the current quarter.\n\nThe debate is structurally unresolvable from a single quarter’s data. What investors should track on Tuesday evening is whether monetisation signals are accelerating or plateauing relative to capex growth. The most useful data points in the earnings commentary will be management guidance on capex trajectory going forward, free cash flow and leverage disclosures that reveal the debt financing dynamic, and any acceleration or deceleration in AI-specific revenue line items.\n\nThe April 29 releases are the first major checkpoint, not the verdict. Nvidia’s results on 20 May will provide the supply-side counterpart to the demand-side signals these four companies reveal, completing the picture of whether $540 billion in AI-tied infrastructure spending is generating returns commensurate with its scale, or whether the arms race framing deserves more weight than the market currently assigns it.\n\n> The content of this article is intended for general informational use only and does not constitute financial or investment advice. Readers are encouraged to undertake their own due diligence and seek guidance from a qualified financial professional before making any investment decisions. Historical returns are not a reliable indicator of future performance, and forward-looking financial estimates remain subject to prevailing market conditions and a range of risk factors.\n\n—\n\n—” } “`
Selective stock picking across the Magnificent Seven has become the dominant analyst recommendation heading into this earnings week, with only three of the seven names carrying consensus Buy ratings and Alphabet standing out as the cheapest at 17x forward earnings despite its projected 5% EPS decline.
GPU and data centre supply constraints extend beyond the chip layer: US grid interconnection queues exceed 2,100 GW and take 3-7 years to clear, meaning 30-50% of planned 2026 data centre capacity may not become operational until 2028 or later regardless of how aggressively balance sheets are deployed.
Cloud infrastructure providers as the clearest AI beneficiaries is a thesis supported by the $562 billion in Big Tech capital expenditure flowing into IaaS and PaaS layers, where agentic AI adoption is projected to grow at a 119% CAGR and drive sustained compute demand that platform-layer revenue can actually capture.
A KPMG survey cited in broader institutional analysis found that 75% of large-company CEOs believe generative AI has been overhyped, yet nearly 80% still plan to allocate at least 5% of capital budgets to AI initiatives, a paradox that sits at the centre of AI capex ROI sustainability concerns heading into this earnings week.
Alphabet, Microsoft, Meta, and Amazon all report Q1 2026 earnings on 29 April 2026, making it the single most concentrated Magnificent Seven earnings day of the quarter.
Alphabet, Microsoft, Meta, and Amazon have committed a combined $650-700 billion in capital expenditure for 2026, with approximately $540 billion of that total tied directly to AI infrastructure.
Early signals are mixed but present: Amazon reports its AI chip segment is running at a $50 billion annualised revenue rate growing over 100% annually, and Microsoft's Copilot product has reportedly exceeded the company's own internal sales targets.
Alphabet is projected to deliver 19% revenue growth alongside a 5% EPS decline in Q1 2026 because the scale of its infrastructure investment, including $175-185 billion in planned capex, is compressing operating margins faster than revenue is expanding.
Investors should focus on management guidance for capex trajectory, free cash flow and leverage disclosures revealing the debt financing shift, and any acceleration or deceleration in AI-specific revenue line items across all four companies.


