Macquarie Group’s share price has climbed from roughly A$204 at the start of 2025 to A$240.20 as of 22 May 2026, a gain of approximately 17.9%. For investors who missed that run, the question is not whether it happened but whether the stock is still worth buying at this price.
The group’s FY25 results, released 2 May 2025, confirmed net profit after tax of A$3,715 million, ahead of consensus expectations of A$3.3-3.5 billion, and a full-year dividend of A$6.50 per share. That result anchored a fresh wave of broker commentary ranging from cautious hold to outperform. With the stock now trading at a trailing price-to-earnings (P/E) ratio of approximately 18.96x and a price-to-book (P/B) ratio of 2.54x, the Macquarie Group valuation debate is live.
What follows walks through the metrics that actually matter for evaluating Macquarie, explains why standard banking ratios can mislead, and translates broker and data signals into a clear picture of what the current price implies.
The 17.9% rally in context: what the share price move actually signals
A 17.9% gain over roughly seventeen months sounds like a momentum story. It is not, or at least not entirely. The FY25 net profit result of A$3,715 million came in well above the A$3.3-3.5 billion consensus range, which means a portion of the re-rating was earnings-driven rather than speculative.
The distinction matters. A share price rally tells investors nothing about whether a stock is cheap, fair, or expensive unless it is measured against what earnings and book value have done simultaneously. Consider the progression:
- Share price: approximately A$204 (early 2025) to A$240.20 (22 May 2026), a 17.9% gain
- FY25 NPAT: A$3,715 million, beating consensus by roughly 6-12%
- Trailing P/E: approximately 18.3x in May 2025, rising to approximately 18.96x by May 2026; P/B: approximately 2.1x to approximately 2.54x over the same period
The multiple has expanded modestly as the price has continued to appreciate beyond the earnings beat. That expansion is the valuation question this analysis addresses.
The AFR observed in May 2025 that Macquarie was “trading at a premium to global investment banking peers on earnings, but closer to fair value relative to Australian financials.”
Investors who anchor on price momentum rather than valuation multiples risk buying into a narrative rather than an asset. Understanding whether a rally reflects earnings-driven re-rating, multiple expansion, or both is the first step in assessing whether the current price is justified.
When big ASX news breaks, our subscribers know first
Why standard bank valuation metrics do not translate cleanly to Macquarie
The instinct when evaluating an ASX financial is to reach for the same ratios applied to Commonwealth Bank or Westpac. For Macquarie, that instinct produces misleading conclusions.
Macquarie is not a deposit-funded retail bank. Its business combines investment banking, asset management, commodities trading, and infrastructure ownership, a structure that changes the risk profile, the earnings volatility, and the capital framework in ways that standard banking ratios cannot capture.
The most common misread is the debt-to-equity ratio. Macquarie’s consolidated D/E sits at approximately 258.5% on an accounting basis. That figure sounds alarming in isolation. It is also a poor standalone metric for a diversified financial group whose leverage profile is governed by regulatory capital requirements, not simple balance sheet gearing.
What the CET1 ratio and surplus capital actually tell you
The Common Equity Tier 1 (CET1) ratio measures a bank’s highest-quality capital, ordinary shares and retained earnings, as a proportion of its risk-weighted assets. It is the metric regulators use to assess whether a financial institution can absorb losses without becoming insolvent.
Macquarie’s APRA Basel III CET1 ratio stood at 12.3% as of the FY25 Pillar 3 Report (2 May 2025), comfortably above the APRA minimum. The group also held A$9.8 billion in non-bank surplus capital, providing a buffer that simple accounting gearing ignores entirely.
| Dimension | Accounting Metric (D/E Ratio) | Regulatory Metric (CET1 Ratio) |
|---|---|---|
| What it measures | Total debt relative to total equity on consolidated accounts | Highest-quality capital relative to risk-weighted assets |
| Limitation / strength | Does not distinguish between types of debt or risk weighting; can mislead for diversified financials | Designed specifically for financial institutions; captures capital adequacy and loss-absorption capacity |
| Preferred by | General financial screening tools | APRA, ASIC (Report 807, December 2024), and institutional analysts |
ASIC Report 807 (December 2024) reinforced that regulatory capital ratios are the appropriate risk measure for diversified financials, not accounting gearing. The AFR (19 March 2025) cited both Morningstar and UBS making the same point: Macquarie’s leverage is in line with global peers when measured correctly.
Reading Macquarie’s ROE and dividend yield as a mature business
Two metrics anchor any quality assessment of a financial group: return on equity and dividend yield. For Macquarie, each number requires more interpretive context than it receives.
FY25 return on equity (ROE) came in at 11.2%, up from 10.4% in FY24, against a sector average of approximately 10.1%. That improvement is not a marginal beat. It represents a business deploying retained capital at improving rates of return across a period when several global investment banks reported flat or declining ROE.
The dividend breakdown tells a different story:
- Final dividend: A$3.90 per share (35% franked)
- Interim dividend: A$2.60 per share (35% franked)
- Total FY25 ordinary DPS: A$6.50 per share
- Payout ratio: approximately 67%
- Franking level: 35%
At the current share price of A$240.20, the A$6.50 full-year dividend implies a trailing yield of approximately 2.7%. That figure sits below the Big Four average of 4-6% and below Macquarie’s own five-year average yield of approximately 3.2%. The 35% franking level further reduces the after-tax advantage for Australian resident investors comparing yield options.
| Metric | MQG (FY25) | Big Four Average | Global IB Peers |
|---|---|---|---|
| ROE | 11.2% | ~10.1% | Varies; below MQG for most European universals |
| Trailing dividend yield | ~2.7% | 4-6% | 2-4% |
| Trailing P/E | ~18.96x | ~13-14x | ~9-11x (forward) |
For income-focused investors, Macquarie’s yield is demonstrably lower than the major banks. The ROE trajectory, however, indicates retained earnings are being deployed at improving rates of return, which supports the argument for a growth premium rather than a yield comparison.
How Macquarie’s valuation stacks up against peers
The peer comparison data tells its own story when sequenced from cheapest to most expensive.
Global investment banks, Goldman Sachs, Morgan Stanley, UBS, and Barclays, trade at forward P/E multiples of approximately 9-11x and P/B ratios of 1.0-1.3x. The Big Four Australian banks sit at trailing P/E multiples of approximately 13-14x with a sector-average P/B of roughly 1.5x. Macquarie, at a forward P/E of approximately 18.5x and a P/B of 2.54x, trades at a clear premium to both groups.
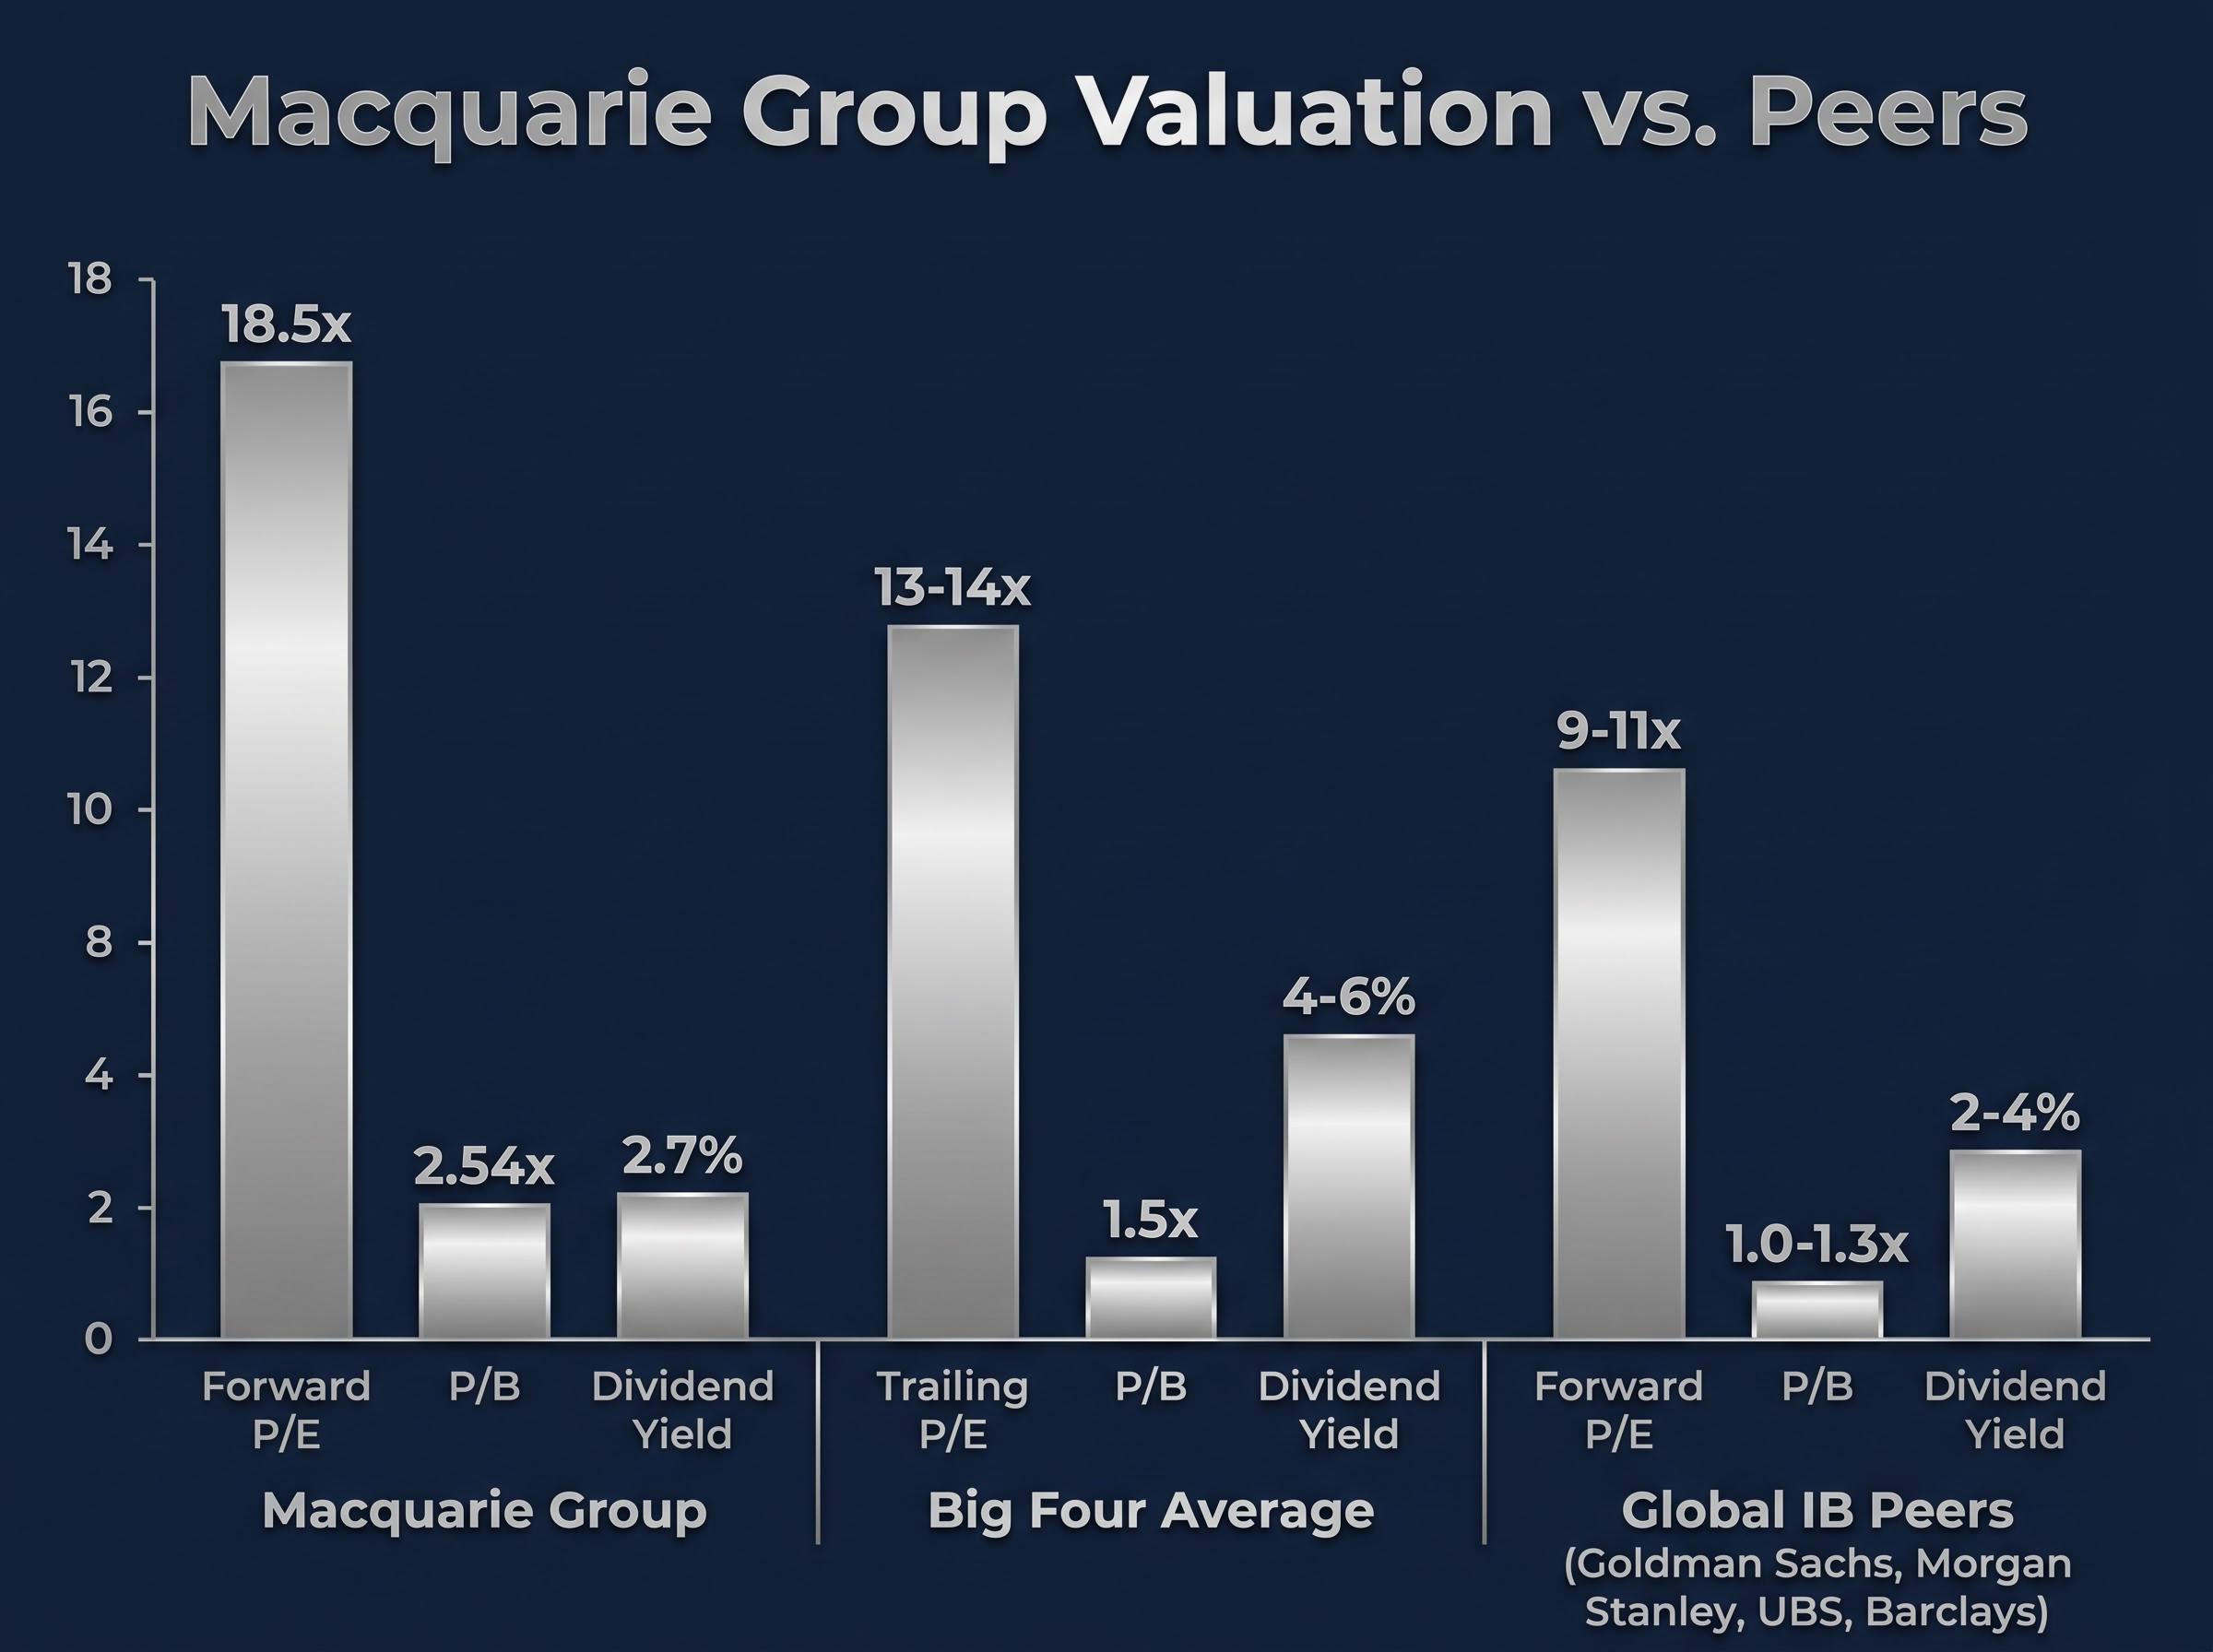
| Metric | MQG (May 2026) | Big Four Average | Global IB Peers |
|---|---|---|---|
| Forward P/E | ~18.5x | ~13-14x | ~9-11x |
| P/B | ~2.54x | ~1.5x | ~1.0-1.3x |
| Dividend yield | ~2.7% | 4-6% | 2-4% |
| ROE | 11.2% | ~10.1% | Varies by institution |
Bloomberg Intelligence, via the AFR (22 January 2025), placed Macquarie “between the big US investment banks and pure-play asset managers” on P/E and P/B, with the premium “justified by higher recurring revenues from asset management and infrastructure.”
Reuters (8 May 2025) noted that Macquarie trades “at a significant premium to global investment banks” but “closer to asset-manager peers such as BlackRock.”
The structural reason for that positioning is the earnings mix shift. Macquarie Asset Management (MAM) accounted for 36% of group profit in FY25, up from 32% in FY24. Recurring fee income from asset management and infrastructure is the reason analysts apply a higher multiple to Macquarie than to trading-heavy global investment banks. Macquarie Equities Research (Outperform, A$235 target) cited “superior ROE and growth options in green infrastructure” as the justification.
One figure provides a reality check. The consensus 12-month average price target stood at approximately A$224.60 as of 21 May 2025 (Market Index). Macquarie now trades at A$240.20, roughly 6-7% above that consensus level.
The asset management flywheel and what it means for the valuation multiple
The premium multiple rests on a specific thesis: that MAM’s recurring fee income will continue to grow, reducing Macquarie’s dependence on volatile markets and commodities earnings. Three recent transactions provide concrete evidence for that thesis.
- GIP VI final close (March 2025): MAM closed Macquarie Global Infrastructure Partners VI at US$23 billion in commitments, one of the world’s largest infrastructure funds, focused on transport, energy transition, and digital infrastructure. Reuters (11 March 2025) noted strong institutional demand for long-term real asset exposure.
- Nordic Renewables AG acquisition (September 2024): MAM’s Green Investments team acquired a majority stake in this European onshore wind and solar developer, adding contracted, long-duration revenue to the asset management platform.
- US toll roads portfolio (June 2024): A MAM-led consortium acquired a 49% interest in a US toll roads portfolio featuring long concession life and inflation-linked revenue, precisely the type of asset that generates annuity-style income.
The FY25 results presentation emphasised a strategic focus on “growing annuity-style income” from asset management and infrastructure platforms. Long-duration assets with inflation-linked or contracted revenue reduce earnings volatility compared to the markets and commodities businesses that historically drove Macquarie’s profit.
The AFR (3 May 2025) noted that the earnings mix shift “should support valuation multiples as investors place a higher premium on stable, capital-light earnings.”
The risk side of this thesis warrants equal attention. UBS cautioned (AFR, 6 May 2025) that growing infrastructure exposures “increase sensitivity to interest rates and regulatory changes.” Infrastructure assets are valued on discounted cash flows; rising rates compress those valuations. Investors pricing in the MAM flywheel need to price in this sensitivity as well.
Expensive, fairly priced, or a value hiding in plain sight?
Broker targets published in May 2025, following the FY25 result, now sit below the current share price:
- Morgan Stanley: Equal-weight, A$215 target; views Macquarie as “fairly valued after the recent run-up”
- UBS: Neutral, A$220 target; supported by “solid capital buffers and recurring fee income”
- Citi: Buy, A$230 target; believes the market underestimates “earnings leverage to a recovery in commodities and capital markets”
- Macquarie Equities Research: Outperform, A$235 target; justified by “superior ROE and growth options in green infrastructure”
The consensus average target of approximately A$224.60 (Market Index, 21 May 2025) implies that the stock has run roughly 6-7% above consensus fair value estimates set after the FY25 result. The consensus rating stood at Hold, with 7 buy, 6 hold, and 2 sell recommendations.
What needs to go right for the current multiple to hold
Three conditions underpin the current valuation. MAM fee income growth needs to continue, requiring infrastructure deployment at scale across the GIP VI mandate and subsequent funds. The interest rate environment needs to remain stable enough that infrastructure asset valuations are not compressed. And Macquarie’s commodities and markets businesses need to avoid a material earnings miss that would push the trailing P/E higher without a corresponding share price adjustment.
Macquarie’s 55-plus years of unbroken profitability provides a quality floor. The track record does not prevent multiple compression, but it does suggest the franchise can sustain earnings through cycles, which limits downside relative to peers with shorter or more volatile operating histories.
Macquarie’s price tag is high, but the premium has a defensible logic
At 18.96x trailing earnings and 2.54x book value, with a market capitalisation of A$91.55 billion, Macquarie is priced for quality and continued earnings growth from asset management. It is not priced for a value recovery or a yield harvest.
The bull case is specific: an 11.2% ROE that is improving, a recurring fee income base that now accounts for more than a third of group profit, and a global infrastructure deployment pipeline that supports long-duration earnings. The bear case is equally specific: the stock trades at A$240.20, above every May 2025 broker target, and 6-7% above the consensus fair value estimate of A$224.60. The premium requires continued execution to sustain.
For Australian investors, the framing is straightforward. Macquarie is neither a high-yield defensive in the mould of the Big Four nor a cheap cyclical recovery play. It is a quality compounder trading at a quality compounder’s price. Whether that price is worth paying depends on conviction in the asset management flywheel and tolerance for a multiple that leaves limited room for disappointment.
This article is for informational purposes only and should not be considered financial advice. Investors should conduct their own research and consult with financial professionals before making investment decisions. Past performance does not guarantee future results.