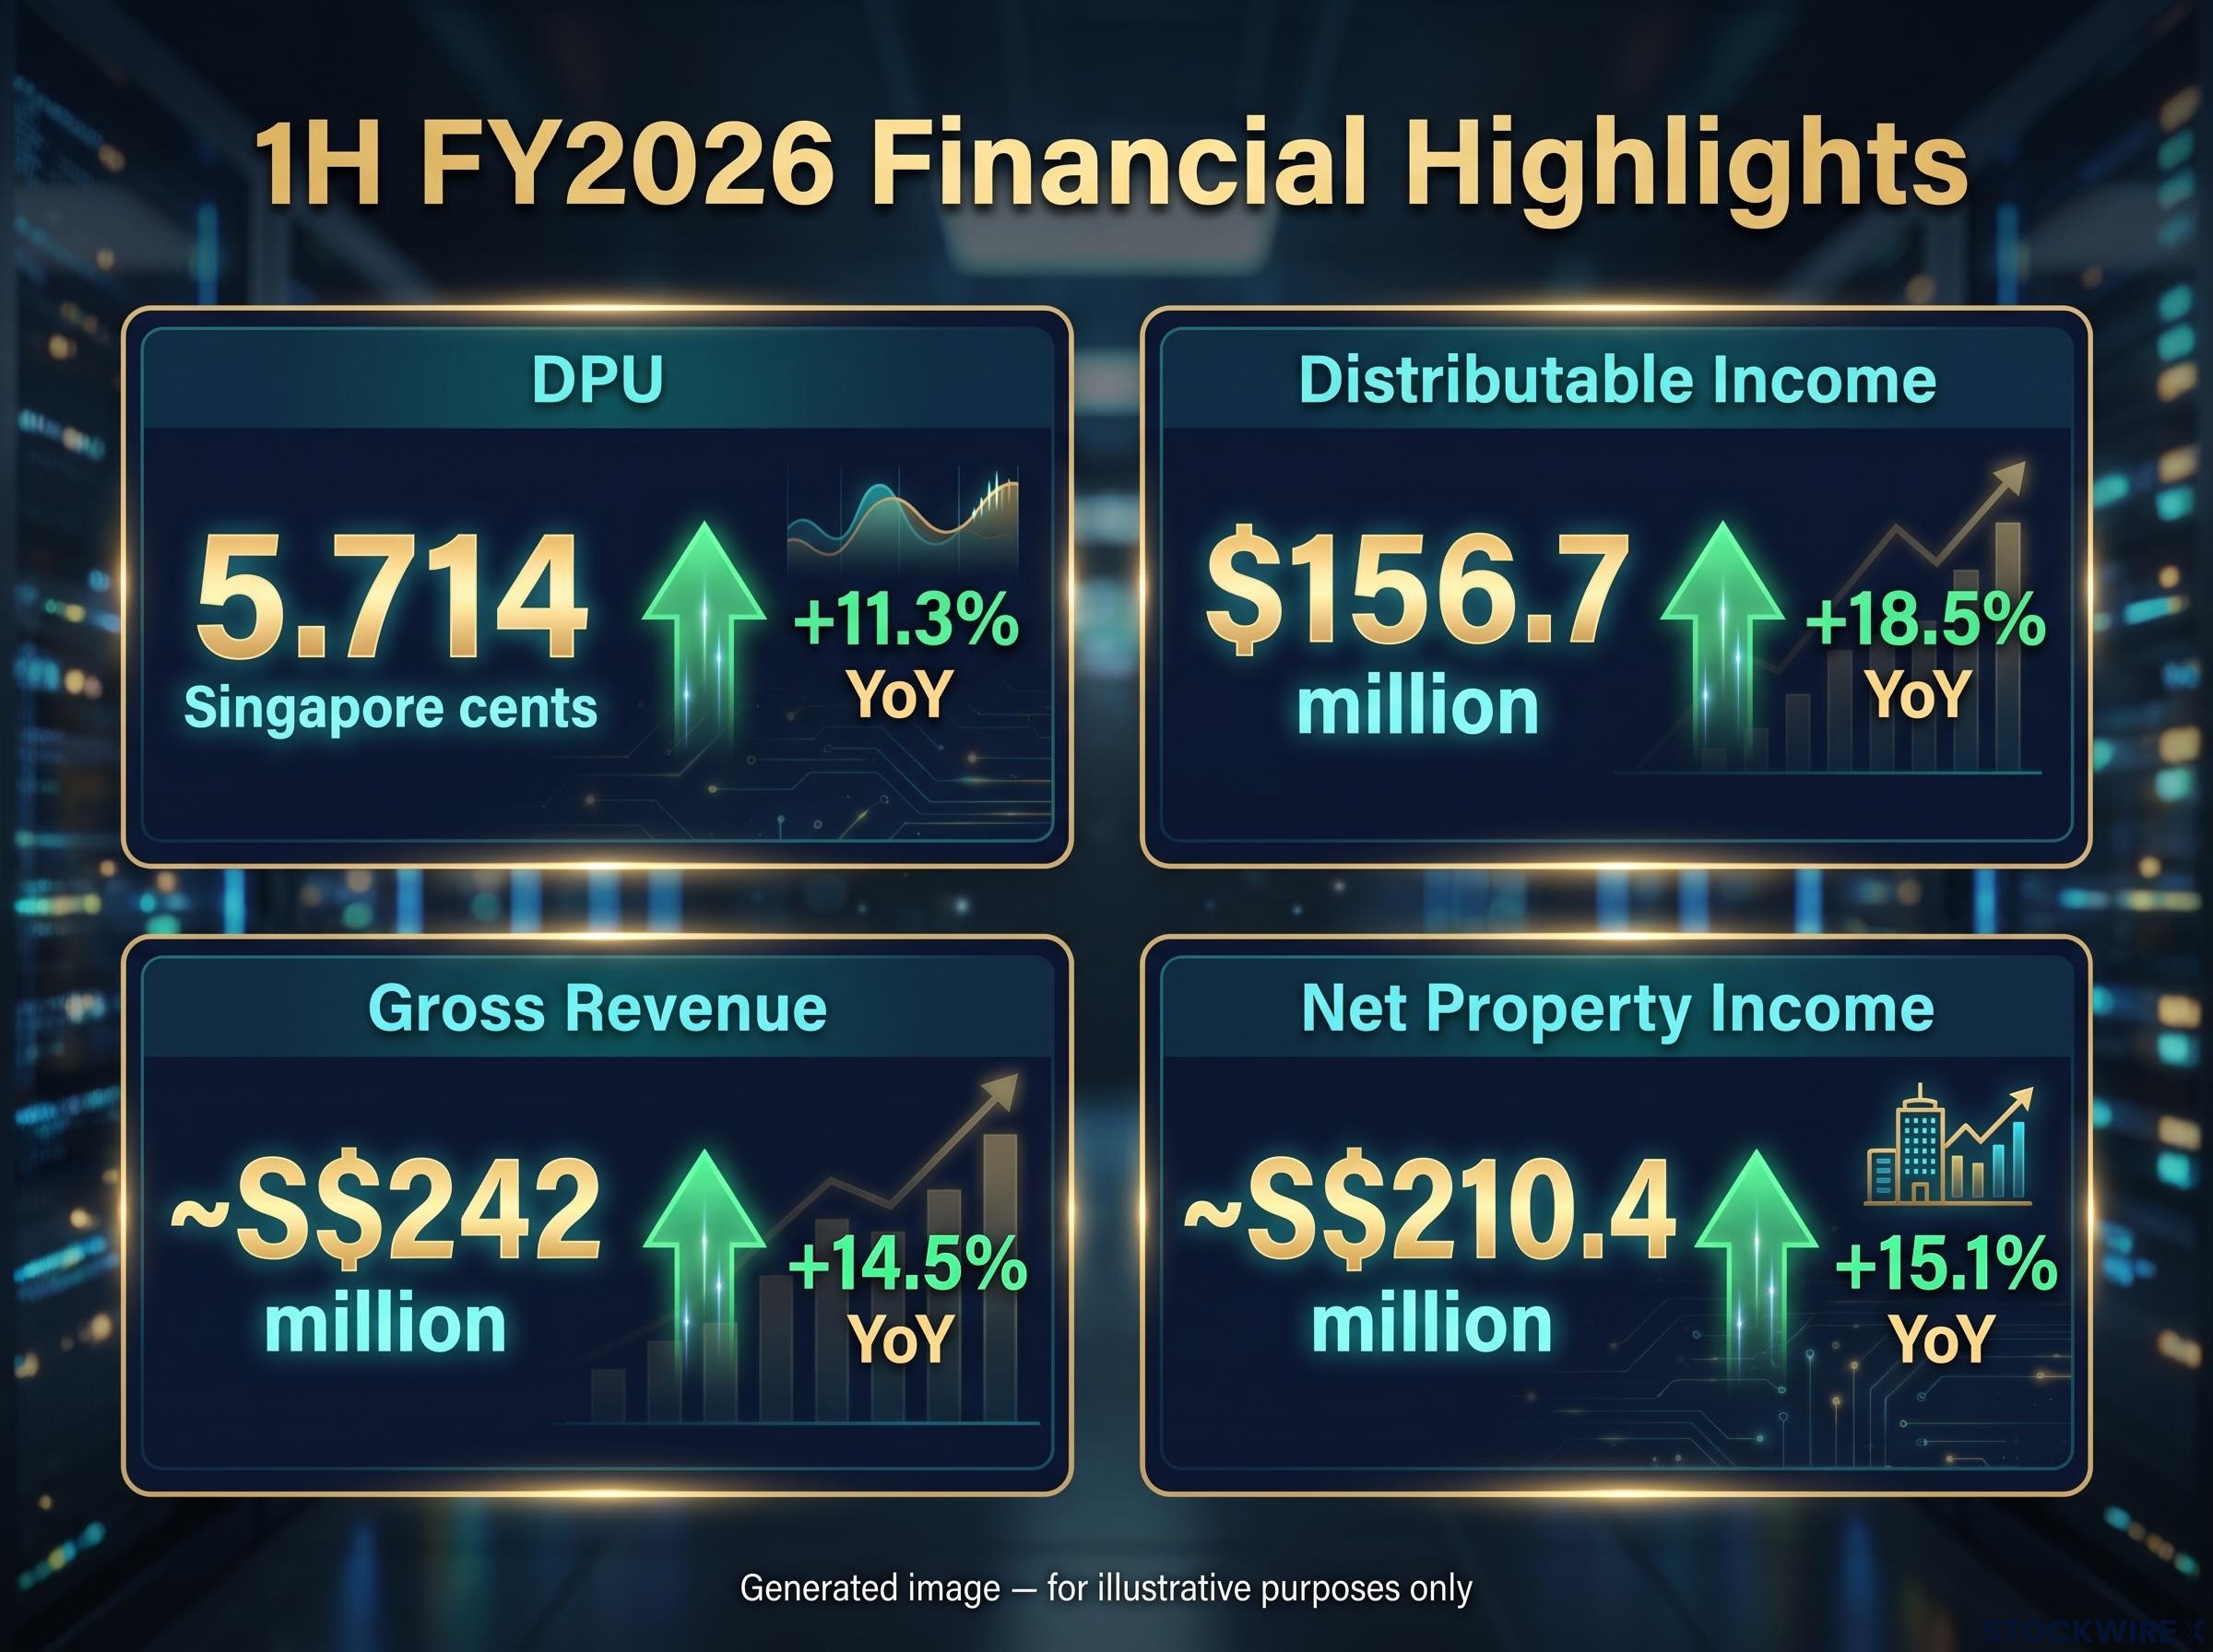
Keppel DC REIT has just delivered a 5.714 Singapore cent distribution per unit for the first half of FY2026, an 11.3% jump year-on-year and the sharpest DPU growth the trust has posted in recent memory. The result was powered by two forces working simultaneously: the yield-accretive acquisition of Tokyo Data Centre 3 and portfolio-wide rental reversions running at approximately 10%.
The numbers arrive at a moment when income investors are scrutinising data centre REITs with a specific question: can these vehicles deliver acquisition-led growth and organic rental uplift at the same time, or does one come at the expense of the other? Keppel DC REIT’s 1H FY2026 result suggests it is delivering on both fronts, though a headline occupancy dip from 95.6% to 92.5% has given some observers pause.
Here is what these results actually tell you if you are evaluating Keppel DC REIT today: which headline figures confirm the income trajectory, which require context before drawing conclusions, and what the forward variables are that will determine whether this momentum holds.
Two engines behind Keppel DC REIT’s 11.3% DPU increase in 1H FY2026
11.3% year-on-year DPU growth in 1H FY2026, the trust’s strongest half-year income expansion in recent periods.
The headline number is clear. DPU reached 5.714 Singapore cents for the half, a gain that flowed directly to unitholders. Distributable income rose by 18.5% year-on-year, outstripping the DPU growth rate. That divergence reflects the mechanics of acquisition-funded growth: when new equity is raised to finance deals, the unit base widens, so aggregate income advances more quickly than the income each unitholder receives. If you see the 18.5% and 11.3% side by side and wonder where the difference went, that is your answer.
Two distinct engines produced this result. The first is acquisition-driven: the Tokyo Data Centre 3 purchase and incremental stakes in Keppel DC Singapore 3 and 4 added new revenue streams that did not exist in the prior corresponding period. The second is organic: rental reversions across the portfolio averaged approximately 10%, lifting income from existing assets.
Key financial metrics for 1H FY2026:
- DPU: 5.714 Singapore cents, up 11.3% year-on-year
- Distributable income: up 18.5% year-on-year
- Gross revenue: approximately S$242 million, up approximately 14.5% year-on-year
- Net property income: approximately S$210.4 million, up approximately 15.1% year-on-year
Management attributed the result to organic growth, acquisition contributions, and disciplined capital management. The combination matters: DPU growth driven by only one of these engines would be harder to sustain.
When big ASX news breaks, our subscribers know first
What rental reversions and lease renewals tell you about future income
Portfolio-wide rental reversions averaged approximately 10% across 1H FY2026. That is the backward-looking number. The forward-looking number is more compelling: analyst projections from Phillip Securities point to high-teens percentage reversions for the full year, once second-half contributions flow through.
At Gore Hill Data Centre in Australia, the recently completed lease renewal saw rents reported to have more than doubled, with that uplift set to start feeding into income from 3Q FY2026 onwards, meaning the most significant reversion gains remain ahead. A weighted average lease expiry (WALE), which measures the average remaining term across all leases, extended to 6.7 years in the half. Only approximately 2.6% of rental income is due for renewal through the remainder of FY2026.
Those two figures together tell you something specific: the income base is well-locked, and the rental gains already achieved in 1H are not at risk of being unwound by a wave of expiries in the second half. The reversion story here is durable, not a single-period snapshot.
Goldman Sachs revised its global data centre capacity forecast to 217 GW by 2030 on 24 July 2026, nearly double its prior base case, a demand outlook that contextualises the structural tailwind supporting lease renewal pricing power across Asia-Pacific and European portfolios like Keppel DC REIT’s.
| Metric | WALE | 1H FY2026 rental reversion | Full-year reversion projection | Remaining FY2026 renewal exposure |
|---|---|---|---|---|
| Portfolio | 6.7 years | ~10% | High-teens % (Phillip Securities estimate) | ~2.6% of rental income |
Understanding the occupancy dip and why contracted power capacity matters more
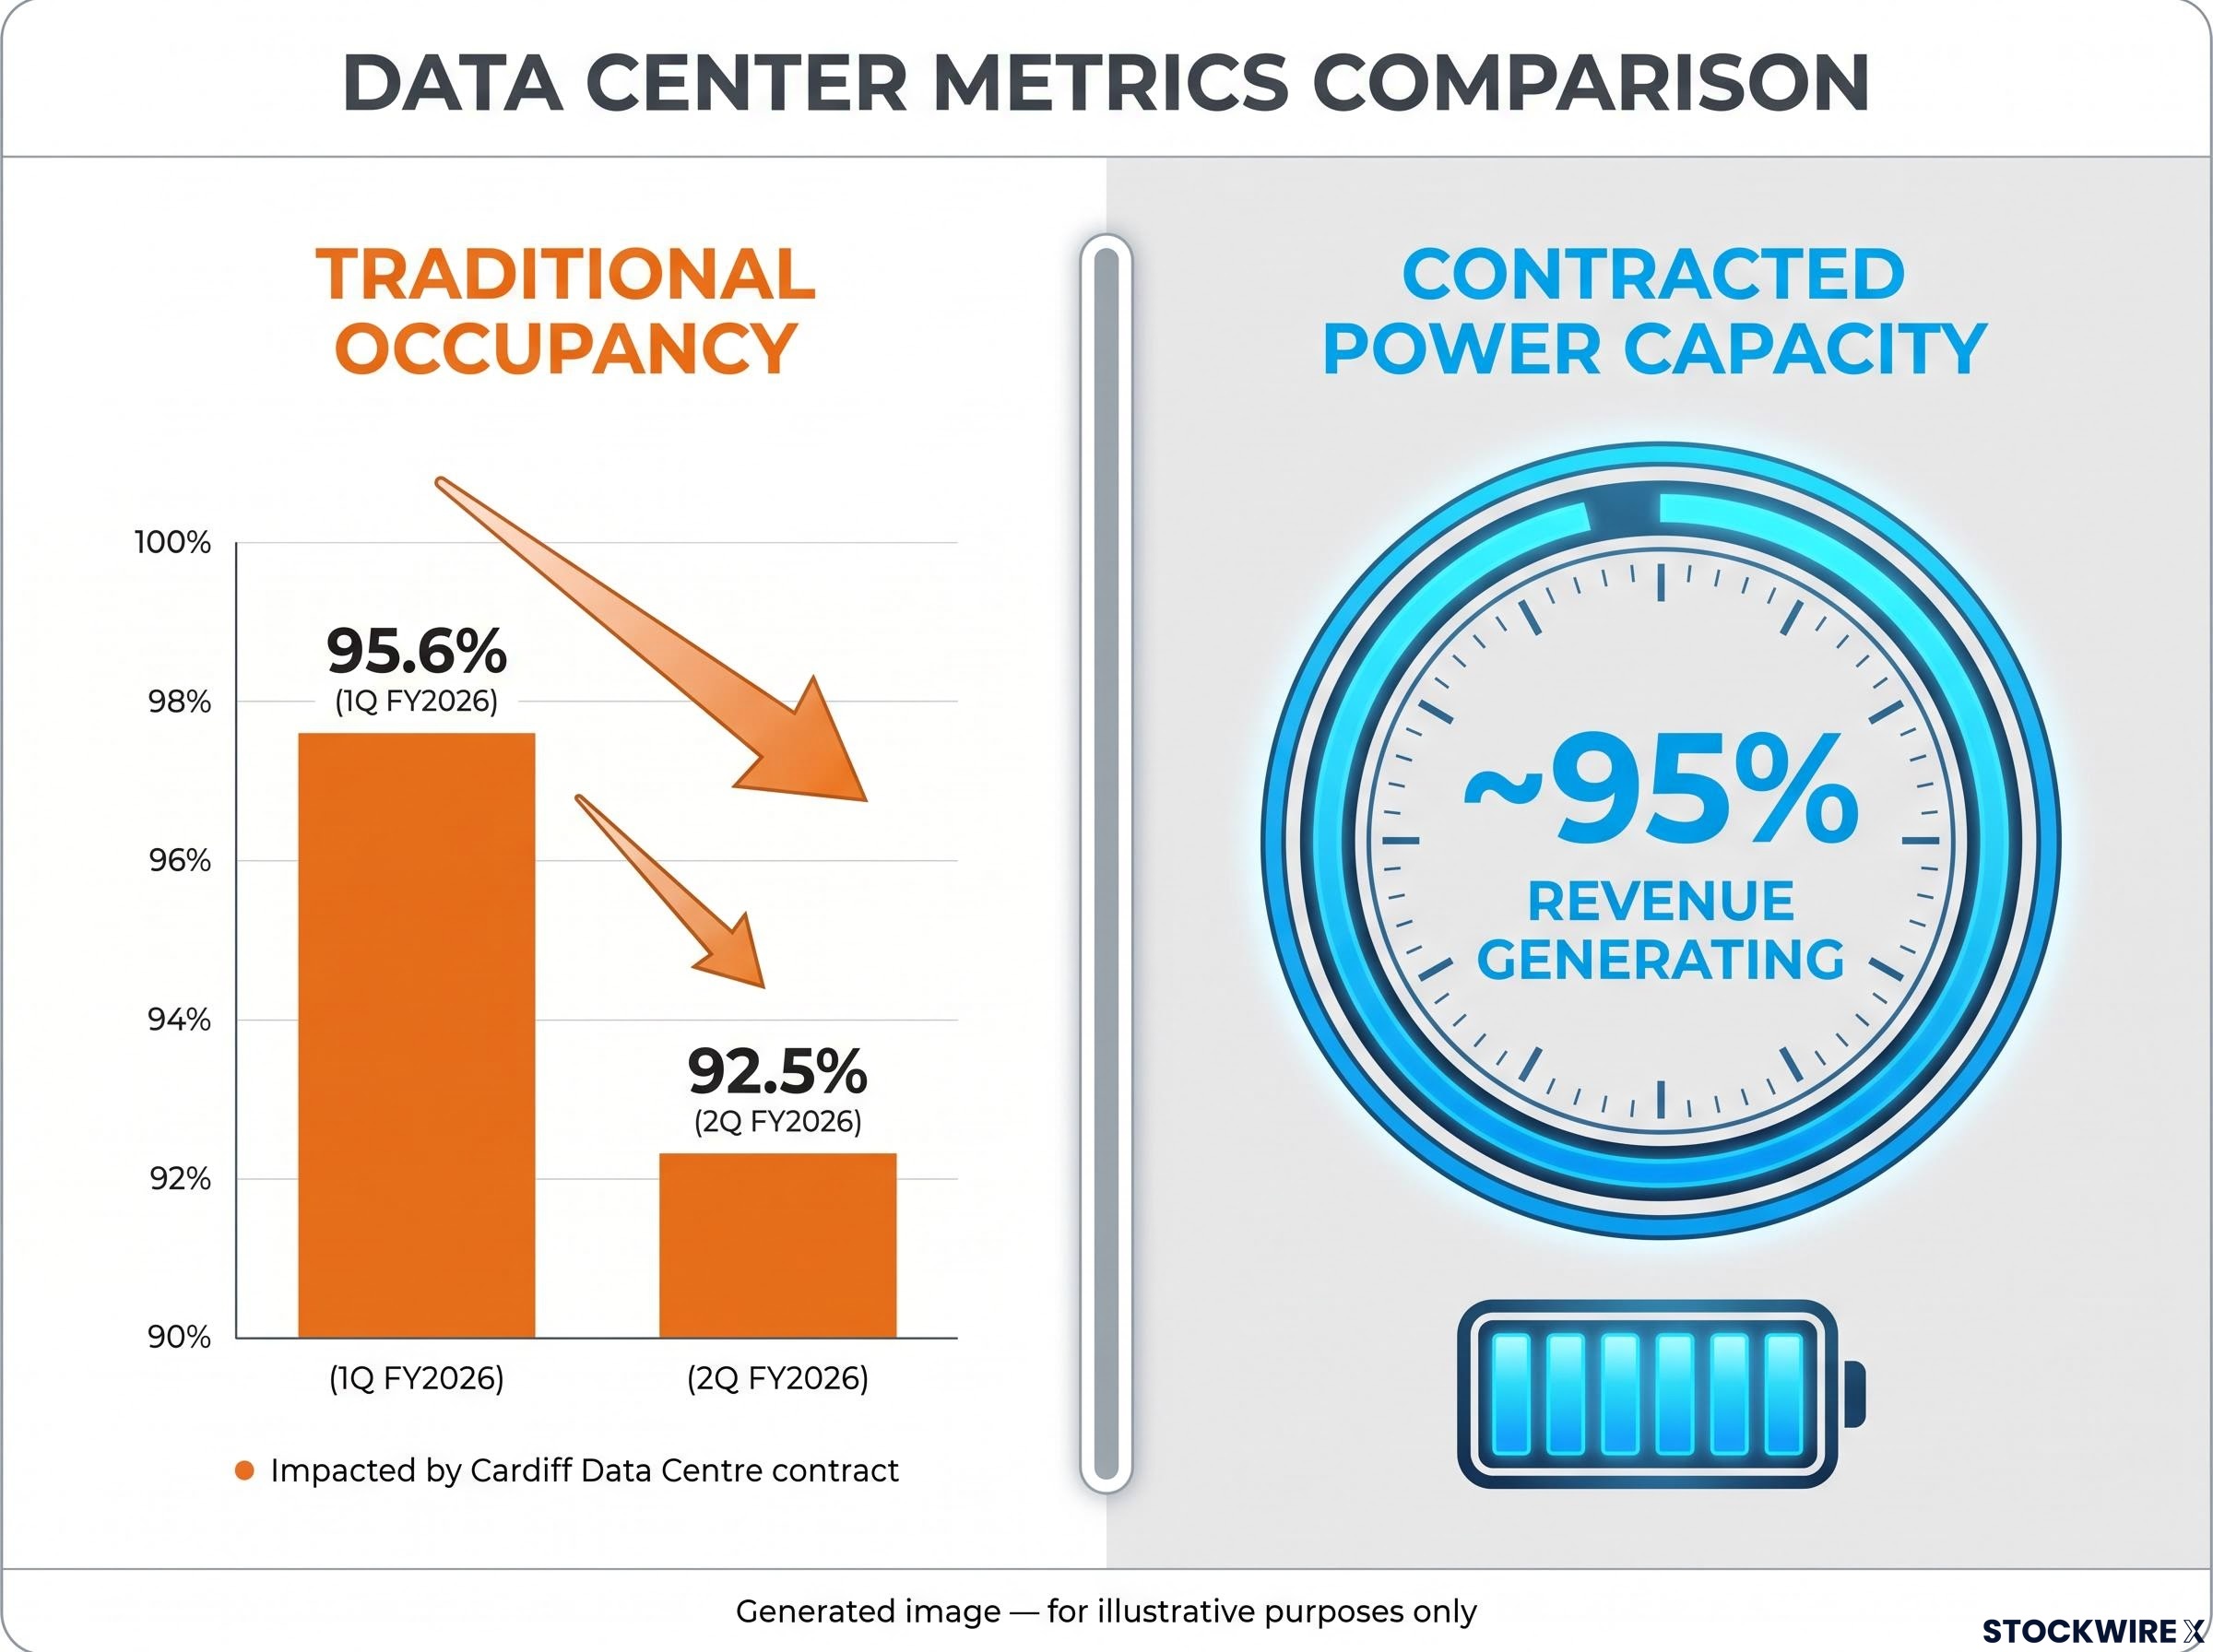
Portfolio occupancy fell from 95.6% in 1Q FY2026 to 92.5% in 2Q FY2026, a decline of approximately 310 basis points. If you are evaluating this REIT through a traditional property lens, that number looks like a concern. It should not be your primary metric.
The fall traces back to the Cardiff Data Centre contract running its course, an asset-level development rather than evidence of weakening demand across the portfolio. Separately, management chose this result to introduce a new utilisation measure: contracted power capacity. The data shows that close to 95% of the portfolio’s power infrastructure is currently under contract and actively generating revenue.
~95% of portfolio power capacity is under contract and revenue generating, a more precise measure of income visibility than traditional occupancy.
The distinction matters because data centre revenue is tied to power provisioning, not floor space. Two metrics tell you different things:
- Traditional occupancy measures physical space leased as a percentage of total space. It can decline when a contract expires at a single asset even if the portfolio’s revenue-generating capacity remains near-full.
- Contracted power capacity measures the percentage of power infrastructure that is under contract and producing income. For data centres, this is the more accurate proxy for earnings visibility.
The first-time disclosure of this metric is a signal that management wants investors to shift their lens. For anyone evaluating data centre REITs, understanding this distinction is more useful than the headline occupancy number alone.
How data centre REITs generate income and why their metrics differ from traditional REITs
Data centre REITs own and lease mission-critical digital infrastructure to technology companies, cloud providers, and enterprises. The income model differs from a conventional property REIT in a fundamental way: tenants pay for power and connectivity capacity, not just floor space. Revenue is typically structured around power provisioning measured in megawatts, which is why contracted power capacity has emerged as a more relevant utilisation metric than square metres leased.
Three characteristics define the asset class and explain why its metrics do not map neatly onto traditional real estate:
- Revenue structure: Income is anchored to long-term power and space contracts rather than conventional tenancy arrangements. A megawatt under contract is the unit of revenue, not a square metre.
- WALE profile: Lease terms tend to be long. Keppel DC REIT’s portfolio WALE of 6.7 years is characteristic of an asset class where tenants sign extended agreements reflecting the cost and complexity of relocation.
- Switching cost dynamics: Relocating data centre operations involves significant capital expenditure, technical migration risk, and potential downtime. These high switching costs create tenant stickiness that underpins lease renewal rates and supports rental reversion power.
Keppel DC REIT’s portfolio spans assets across Asia-Pacific and Europe, positioning it within the structural growth in global digital infrastructure demand. A reader who understands that rents are anchored to power contracts rather than physical space will interpret the occupancy, lease renewal, and acquisition data in this result with far greater accuracy than one applying a conventional property REIT framework.
Goldman Sachs has characterised data centre capacity as contract-backed infrastructure assets, pointing to lease rates that have nearly tripled since 2021 to a CBRE-reported average of $196/kW/month in primary markets, a pricing environment that underpins the reversion momentum Keppel DC REIT is now capturing across its portfolio renewals.
Balance sheet headroom signals capacity for the next deal
The trust’s aggregate leverage came in at 34.0% at the close of 2Q FY2026, a reduction of 110 basis points quarter-on-quarter that followed the settlement of the consumption tax financing taken on when Tokyo Data Centre 3 was acquired. That places the trust comfortably below its internal 40% leverage ceiling.
The MAS REIT leverage requirements, updated in November 2024, establish a single aggregate leverage limit of 50% for all Singapore-listed REITs alongside a minimum interest coverage ratio of 1.5 times, setting the regulatory ceiling within which Keppel DC REIT’s 34% aggregate leverage sits.
According to Phillip Securities estimates, the gap between 34% and the 40% ceiling translates to approximately S$673 million in available debt headroom. That is a broker-derived figure rather than a company disclosure, but it is consistent with the kind of capacity analysts typically estimate at this leverage level.
| Balance sheet metric | Figure |
|---|---|
| Aggregate leverage (2Q FY2026) | 34.0% (down 110 bps QoQ) |
| Internal leverage ceiling | 40% |
| Estimated debt headroom | ~S$673 million (Phillip Securities estimate) |
| Average cost of debt | 2.6% (company-disclosed) |
| FX hedge horizon | Substantially hedged through 1H FY2027 |
The average cost of debt remains at 2.6% per the company’s own disclosure (Phillip Securities reports 2.7% in its own model). Currency hedges on overseas income streams extend substantially into 1H FY2027 per broker analysis, limiting the exposure to near-term foreign exchange movements.
Leverage at 34% against a 40% ceiling, with a cost of debt still below 3%, means Keppel DC REIT could complete a meaningful acquisition without requiring a new equity issuance. That matters to existing unitholders directly, because equity-funded deals dilute DPU in the short term. Debt-funded deals, when the cost is this low, can be immediately accretive.
Broker upgrades target price to S$2.46 and maintains ACCUMULATE call on Keppel DC REIT
S$2.46 new target price from Phillip Securities Research, up from S$2.37, with an ACCUMULATE rating maintained.
Phillip Securities Research, in a note published 31 July 2026, revised its target price on Keppel DC REIT upward to S$2.46 from S$2.37, while keeping its ACCUMULATE rating in place.
The three elements of the broker’s view:
- Rating: ACCUMULATE (maintained)
- New target price: S$2.46, up from S$2.37
- Key upgrade drivers: Revised upward assumptions for rental reversions and ongoing income from NetCo Bonds flowing through the model
The basis of the upgrade is worth noting. The target price increase is driven by rental reversion assumptions rather than a single acquisition effect. That tells you the analyst’s conviction is anchored in the organic growth story, specifically the expectation that Gore Hill and other renewals will lift portfolio-wide reversions into the high-teens for the full year. It implies confidence in a repeatable income trajectory, not just a one-off deal boost.
This is a single broker’s proprietary view and is not separately confirmed in company or exchange filings. Analyst target price revisions provide a reference point for evaluating shifts in market sentiment, but they should be weighed as one input among several rather than treated as a standalone signal.
REIT return drivers in the current environment extend well beyond the rate-cutting narrative, with sector dispersion exceeding 34 percentage points in 2024 and the 10-year Treasury yield path mattering more than the federal funds rate for valuation; data centre REITs benefit from secular demand tailwinds that partially insulate them from the macro interest rate debate.
What the 1H FY2026 results change for investors evaluating Keppel DC REIT
Three pillars are now confirmed by 1H FY2026. Income growth is real and dual-sourced, coming from both acquisitions and organic rental uplift. The balance sheet retains meaningful capacity for further deals without requiring dilutive equity issuance. The occupancy dip is an asset-specific event at Cardiff, not a portfolio-wide trend, and the 95% contracted power capacity metric provides a more accurate reading of true utilisation.
Two forward variables matter most from here:
- Gore Hill rental contribution: The lease renewal, with rents reportedly more than doubling, is expected to flow through from 3Q FY2026. The timing and magnitude of this contribution will shape second-half DPU.
- Next acquisition deployment: With approximately S$673 million in estimated debt headroom (per Phillip Securities), the question is whether management identifies and executes a yield-accretive transaction before leverage conditions or pricing dynamics shift.
The combination of a 6.7-year WALE, approximately 95% contracted power capacity, and a cost of debt at 2.6% creates a relatively stable income profile in the context of accelerating global data centre demand. For an income-focused investor, the most actionable insight from this half is not the DPU number itself but the lease lock-in, power contract security, and balance sheet headroom that make the next twelve months of income more predictable than any single headline metric would suggest.
For investors wanting a structured methodology to apply these metrics across multiple S-REITs, our dedicated guide to evaluating Singapore REITs walks through the seven-part analyst framework covering gearing, ICR, debt structure, WALE, and rental reversion in the current rate environment.
This article is for informational purposes only and should not be considered financial advice. Investors should conduct their own research and consult with financial professionals before making investment decisions. Analyst projections and target prices cited are subject to change based on market developments and company performance.