Why Seeing Machines Trades Below 5p Despite EU Mandate Wins
9 hrs ago

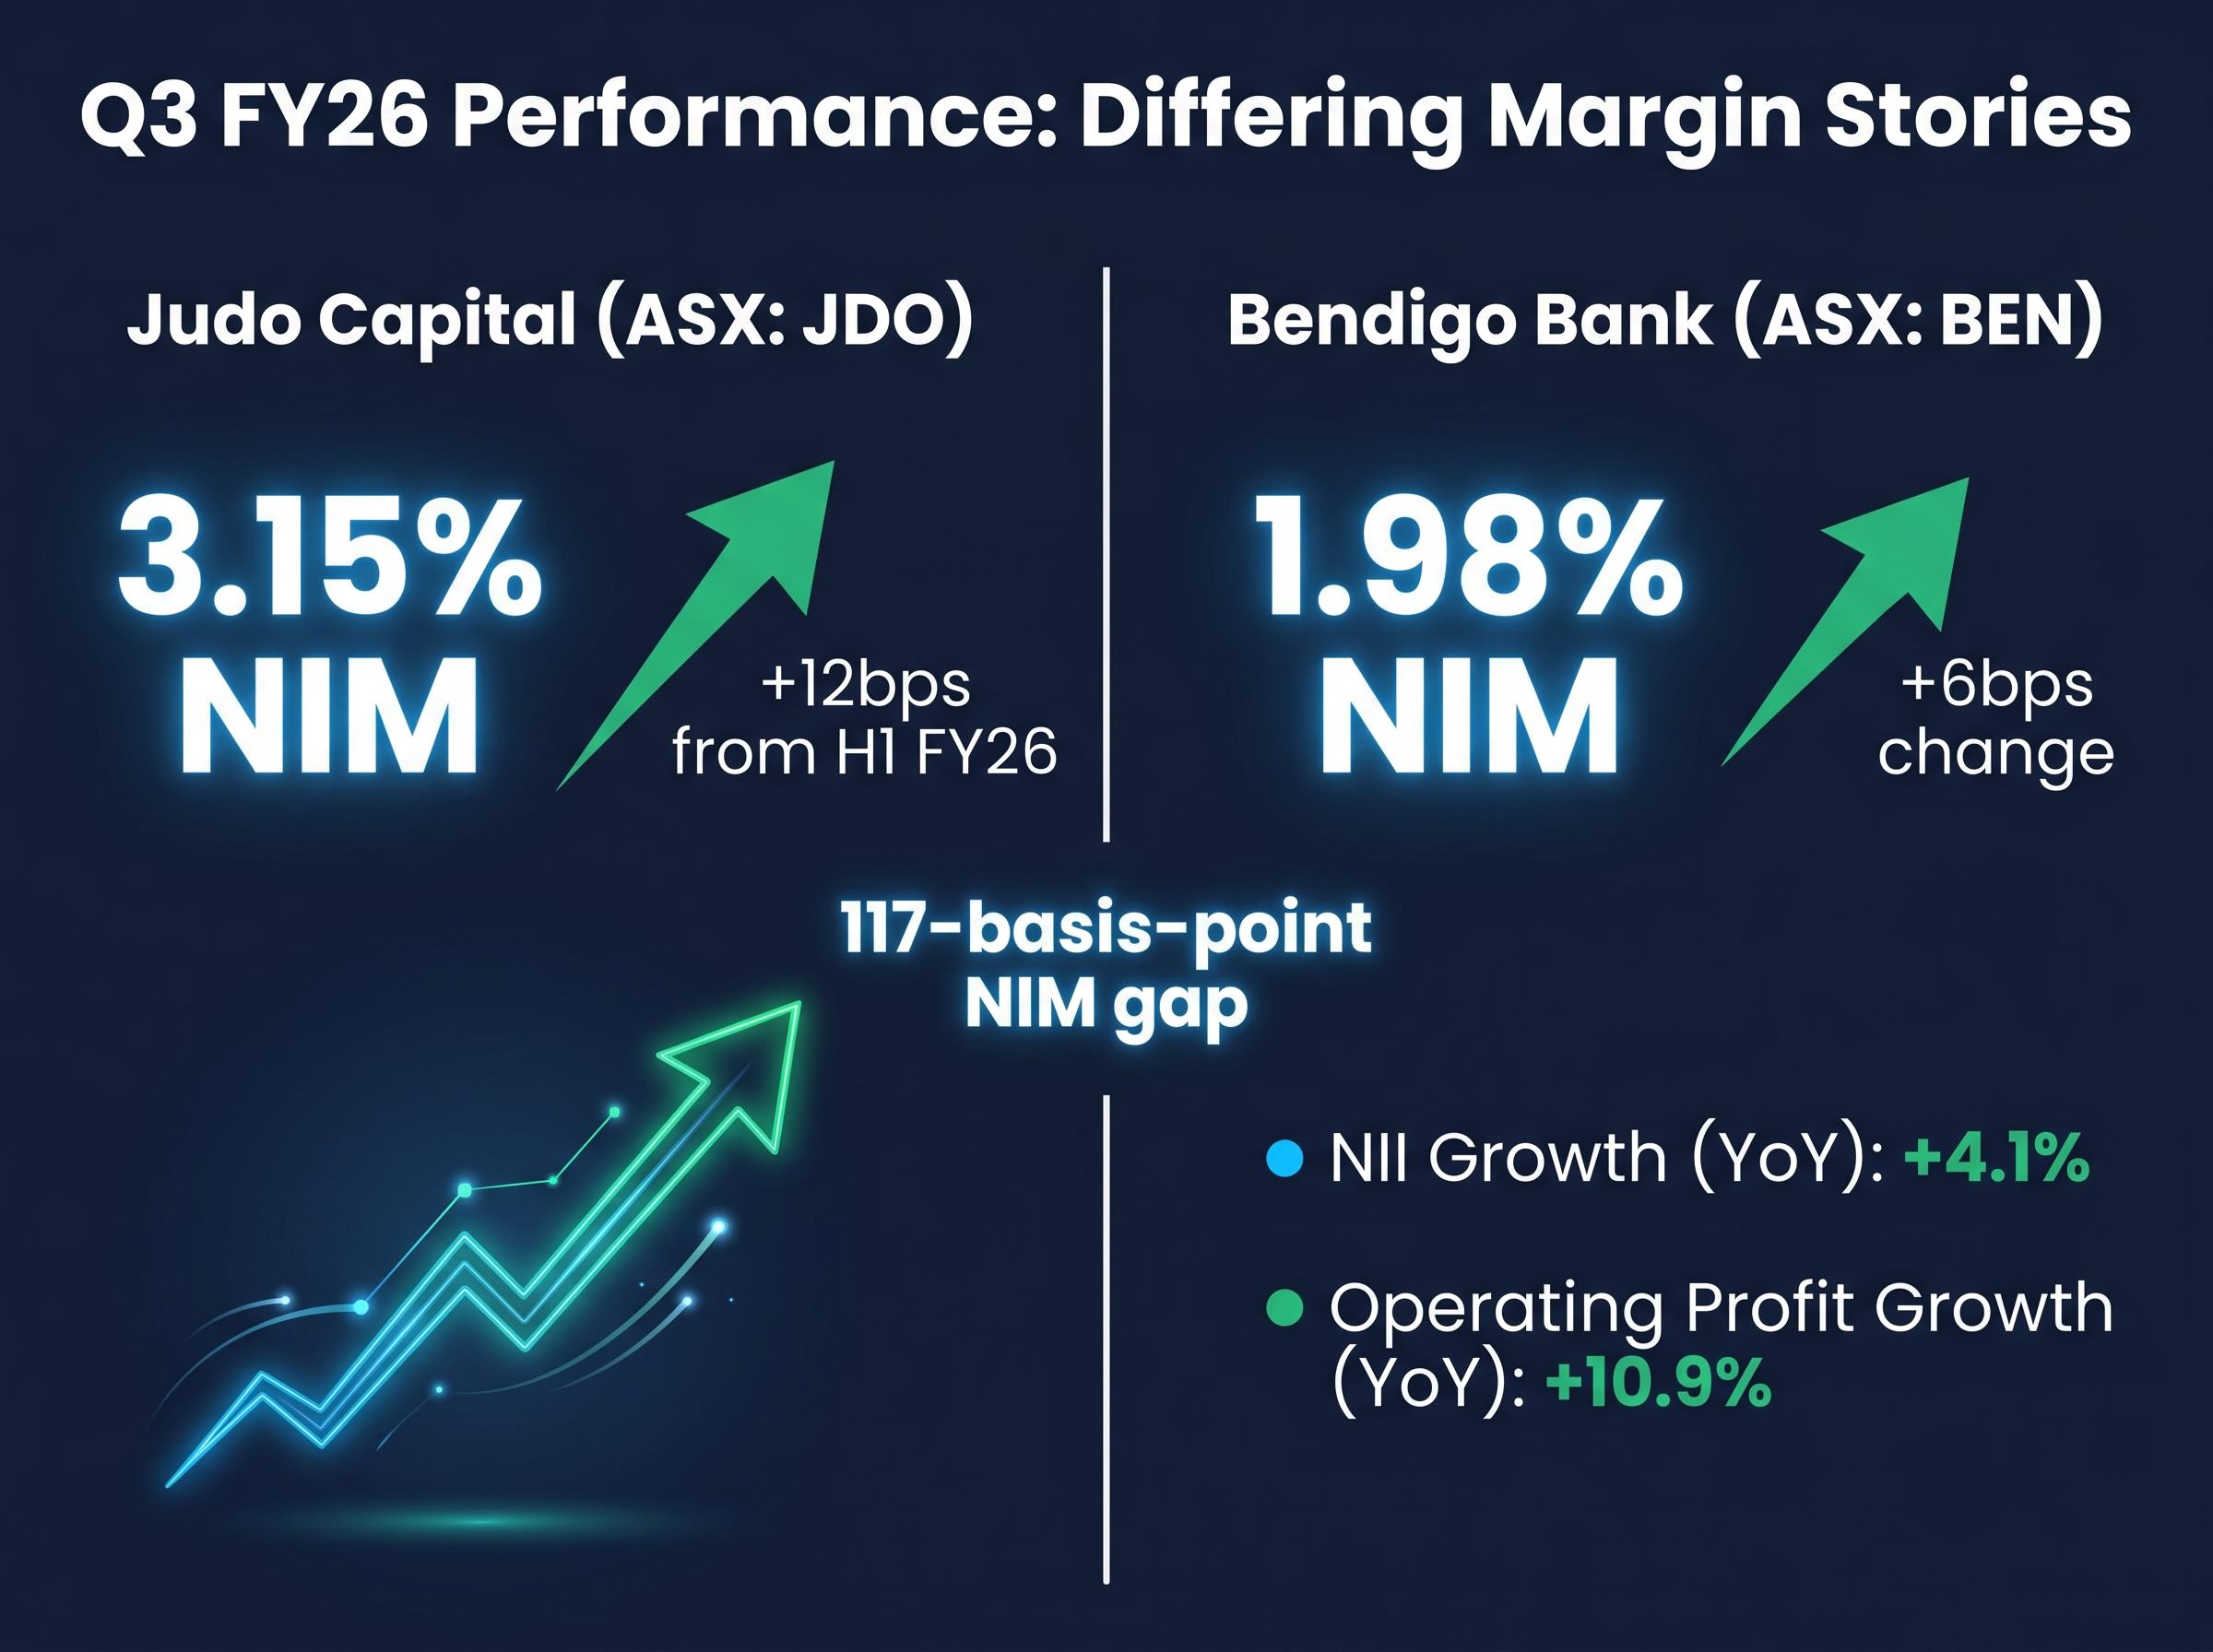
When the Reserve Bank of Australia (RBA) lifted the cash rate for the third time in 2026 on 6 May, not every ASX-listed bank stood to benefit equally. Judo Capital Holdings (ASX: JDO) reported a Q3 FY26 net interest margin (NIM) of 3.15%. Bendigo and Adelaide Bank (ASX: BEN) posted a NIM of 1.98%. Same rate cycle, two very different earnings stories. With the cash rate now at 4.35% following hikes in February, March, and May 2026, investor attention is shifting from the Big Four toward the mid-tier cohort, where the most differentiated rate-cycle dynamics are playing out. This analysis provides ASX investors with a structured framework for evaluating both stocks on their own terms: the mechanics behind each bank’s margin trajectory, what Q3 FY26 results signal, where valuations sit today, and which type of investor each thesis suits.
The inflation dynamics driving the tightening cycle are more nuanced than the 4.6% headline suggests: trimmed mean CPI held at 3.3% for the year to March 2026, meaning the acceleration was concentrated in volatile energy categories rather than spreading through the broader price level, a distinction that matters for how long the RBA’s tightening mandate is likely to persist.
The Big Four banks dominate Australian lending, but their sheer scale and mortgage-heavy balance sheets dilute the impact of each RBA rate hike on their margins. Westpac, for example, reported H1 FY26 statutory net profit of $3.4 billion with lending and deposits growing 7% year-on-year, yet residential mortgages account for 69% of its loan book. Fixed-rate mortgage buffers and intense refinancing competition compress the NIM uplift that each 25-basis-point hike delivers.
Mid-tier banks capture more of that uplift for three structural reasons:
Westpac’s loan book: 69% residential mortgages. That concentration means each RBA hike flows through a fixed-rate buffer before reaching the margin. Mid-tier lenders with floating-rate SME books face no such delay.
Choosing mid-tiers over the Big Four is only half the decision, however. Within the mid-tier cohort itself, balance sheet composition determines who benefits most. JDO’s 3.15% NIM and BEN’s 1.98% NIM reflect fundamentally different business models responding to the same 4.35% cash rate. The comparison that follows explains why.
Judo Capital operates an almost exclusively SME-focused lending model. The floating-rate structure of its loan book means each RBA hike reprices lending revenue in near-real time, without the fixed-rate lag that slows pass-through in mortgage-heavy portfolios. The sequence is mechanical: the RBA lifts the cash rate, JDO’s floating-rate loans reprice upward within weeks, and net interest income rises before deposit costs fully adjust. That is NIM expansion by design, not by luck.
Q3 FY26 confirmed the model is working. JDO’s NIM reached approximately 3.15%, up from 3.03% in H1 FY26, an improvement of roughly 12 basis points.
NIM trajectory: 3.03% (H1 FY26) to 3.15% (Q3 FY26). A 12-basis-point expansion in a single quarter, driven by floating-rate repricing flowing directly to the margin.
The company’s market capitalisation sits at $1.65 billion as of 8 May 2026, with a forward price-to-earnings (P/E) ratio of approximately 10.43x and estimated earnings growth of 23.72%. The share price is approximately $1.48 (indicative and unverified via live ASX data), down roughly 7% year-to-date.
Despite the strong NIM result, JDO’s share price fell approximately 19% in April following the Q3 FY26 trading update. The gap between a positive margin outcome and a negative price reaction suggests the market had been pricing in even faster NIM expansion or more aggressive loan book growth. When the update delivered margin improvement without the volume acceleration some investors expected, the repricing was swift.
The disconnect between bank results and share price reactions is a recurring feature of Australian banking reporting cycles, not a JDO-specific anomaly: NAB’s share price fell nearly 3% on 5 May 2026 despite underlying profit growth of 6.4%, confirming that markets are pricing what they expected rather than what was delivered, a dynamic that explains why JDO’s April selloff can coexist with improving NIM momentum.
Broker conviction, however, held. UBS maintained a Buy rating with a $2.20 price target, and Macquarie retained its Buy at $1.85. The April selloff widened the gap between broker targets and the trading price, creating the kind of entry point that tends to attract institutional attention.
Net interest margin measures the spread between what a bank earns on its loans and what it pays on its deposits, expressed as a percentage of its earning assets. In plain terms, it captures how much profit a bank extracts from its core lending activity for every dollar deployed.
NIM is the single most consequential metric for evaluating mid-tier bank rate sensitivity because it reveals how efficiently a bank’s specific business model converts interest rate movements into earnings. A bank starting from a higher NIM compounds each rate hike differently from one rebuilding from a lower base. A 10-basis-point improvement on a large, diversified loan book and a 10-basis-point improvement on a smaller, specialist one produce very different absolute dollar impacts on the bottom line.
APRA’s quarterly ADI statistics provide industry-segment level data on net interest margins, lending composition, and capital ratios across major banks and other domestic institutions, offering the authoritative baseline against which individual bank NIM disclosures can be benchmarked.
The table below places JDO and BEN side by side on the metrics that matter most.
| Metric | JDO (Q3 FY26) | BEN (Q3 FY26) |
|---|---|---|
| NIM | 3.15% | 1.98% |
| NIM change (period) | +12bps (from H1 FY26) | +6bps |
| NII growth (YoY) | Not disclosed | +4.1% |
| Operating profit growth (YoY) | Not disclosed | +10.9% |
That 117-basis-point gap between the two NIMs is not a quality judgement. It reflects two entirely different lending portfolios responding to the same cash rate. The sections that follow explain how each bank’s model shapes the margin story investors are actually buying.
Bendigo and Adelaide Bank operates a community and regional banking model structurally distinct from JDO’s specialist SME focus. Its loan book is broader, its deposit base is more diversified, and its NIM starting point is lower. None of that makes the margin story weaker. It makes it different.
Q3 FY26 results confirmed that BEN’s investment thesis rests on operational leverage, not rate-cycle acceleration. Net interest income grew 4.1% year-on-year, but operating profit grew 10.9% over the same period. That gap is the signature of genuine cost discipline: revenue grew modestly, but expenses grew more slowly still, amplifying the profit outcome.
Operating profit: +10.9% year-on-year, on NII growth of just 4.1%. The spread between those two figures is the cost discipline thesis in action.
BEN’s NIM of 1.98% (up 6 basis points in the quarter) will not match JDO’s rate-cycle velocity. It is not designed to. The investment thesis for BEN is built on three pillars:
The share price trades in an approximate range of $10.78-$10.85 (indicative, unverified via live ASX data). Simply Wall St estimates a fair value of $12.77, while Rask Media’s dividend-based valuation methodology produces a range of $13.32-$13.75. Estimated earnings growth sits at 29.33% (indicative, sourced from prior Simply Wall St data). BEN also displayed notably less volatility than JDO during the April mid-tier selloff.
The analyst picture for JDO is anchored by two specific broker targets. UBS holds a Buy rating with a $2.20 target, implying approximately 49% upside from the indicative $1.48 price. Macquarie holds a Buy at $1.85, implying roughly 25% upside. Across 13 analysts, the consensus average target is $2.09, with a high of $2.50 and a low of $1.75, translating to approximately 41% average implied upside.
That level of broker conviction, maintained through a 19% selloff, signals institutional confidence in the NIM trajectory. The forward P/E of approximately 10.43x and estimated earnings growth of 23.72% position JDO as a growth-oriented mid-tier play with a valuation that has not yet priced in the margin expansion analysts expect.
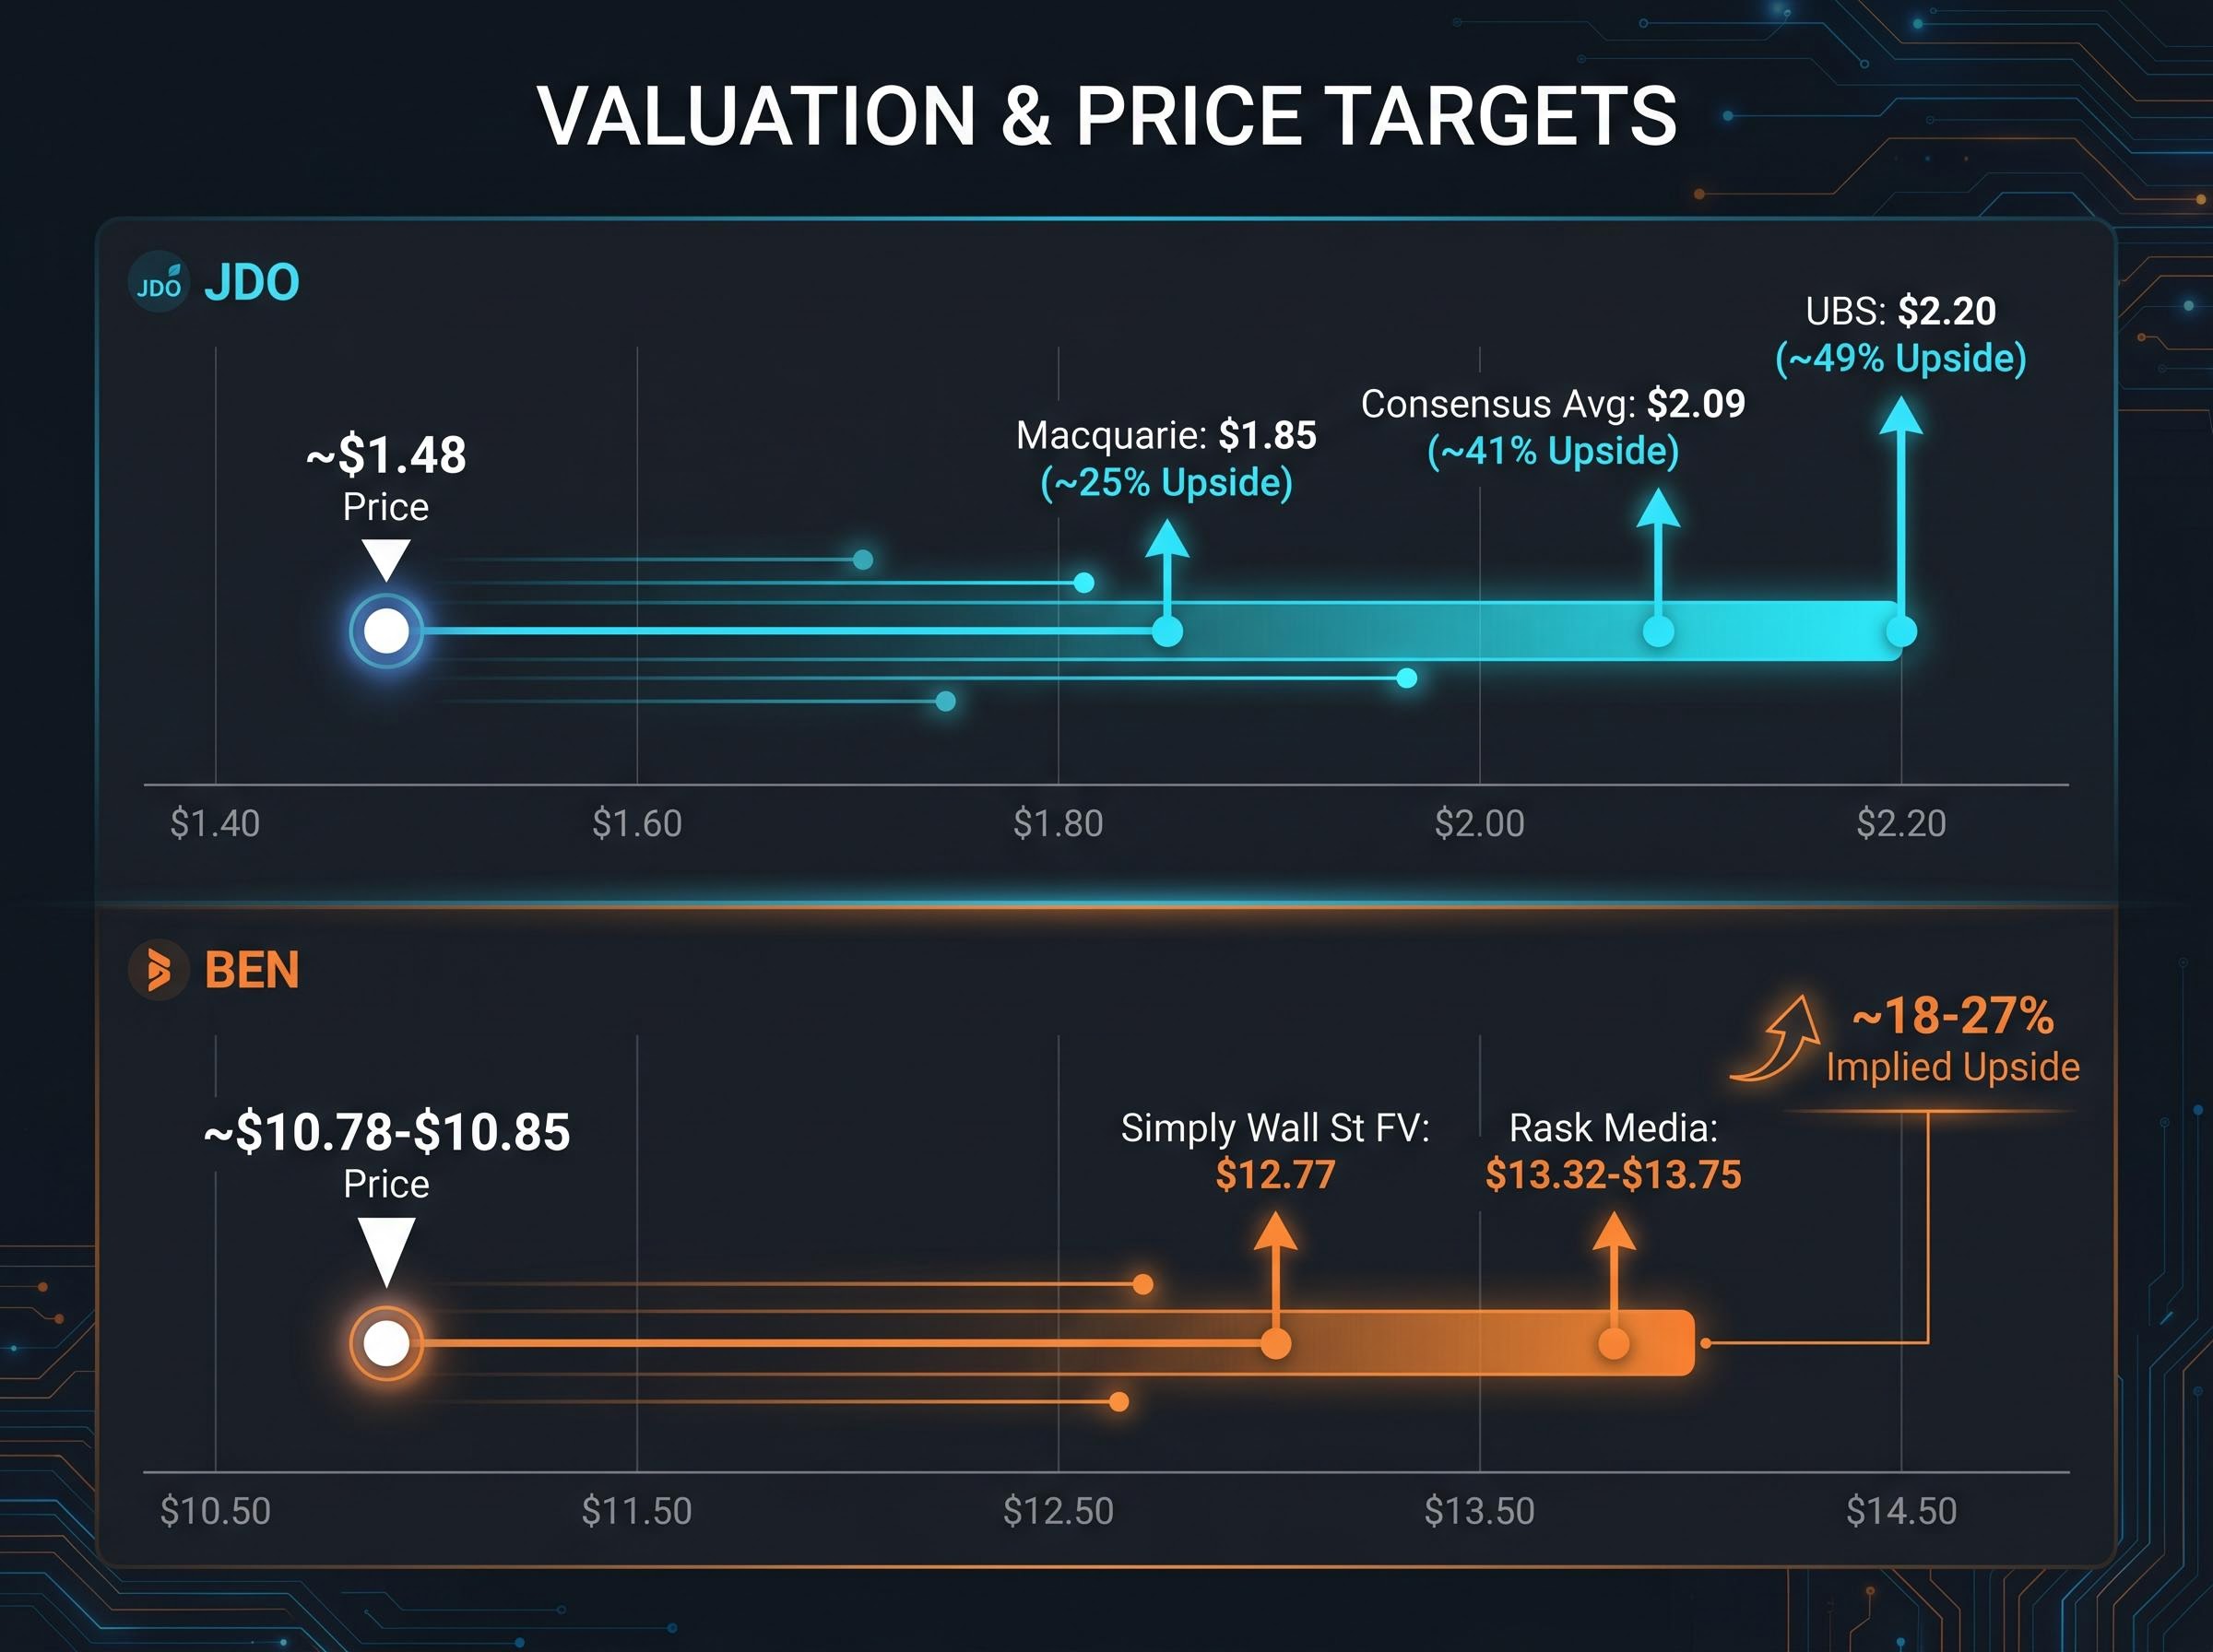
BEN’s valuation picture draws from a different source set. No confirmed post-Q3 FY26 broker consensus targets are available. The reference points are independent estimates: Simply Wall St’s fair value of $12.77 and Rask Media’s range of $13.32-$13.75. These are model-derived valuations rather than broker price targets, and investors should weight them accordingly. BEN’s forward P/E sits at approximately 9-10x.
| Metric | JDO | BEN |
|---|---|---|
| Approx. price | ~$1.48 | ~$10.78-$10.85 |
| Key price target(s) | UBS $2.20 / Macquarie $1.85 / Consensus $2.09 | Simply Wall St $12.77 / Rask $13.32-$13.75 |
| Implied upside | ~41% (consensus avg) | ~18-27% (independent estimates) |
| Forward P/E | ~10.43x | ~9-10x |
| Earnings growth est. | 23.72% | 29.33% (indicative) |
The distinction is clear. JDO suits investors seeking rate-cycle growth leverage who are willing to tolerate elevated short-term volatility; the April selloff demonstrated that price swings can be severe even when underlying metrics are improving. BEN suits investors seeking a steadier income-generating mid-tier bank with lower NIM but a more stable earnings trajectory and dividend support.
The macro assumptions behind ASX bank valuations do more work than any single metric: the same model applied to NAB produces a range from $19.00 to $85.50 per share depending entirely on growth rate and discount rate inputs, a spread that illustrates why JDO at 10.43x forward P/E and BEN at 9-10x forward P/E are only as useful as the economic scenario an investor attaches to them.
Forward guidance beyond the May 2026 hike remains unclear. No explicit RBA signals on whether further increases or a pause are forthcoming have been confirmed, which means the pace of additional NIM expansion for both JDO and BEN is an open question rather than a certainty.
The RBA rate path beyond May remains genuinely open: futures markets are pricing one further 25-basis-point move by December 2026, implying a terminal cash rate near 4.68%, with the Federal Budget on 12 May and late-May CPI data functioning as the two most consequential inputs before the July meeting.
Both stocks, however, retain structural advantages that have not fully unwound. JDO’s floating-rate repricing mechanism and BEN’s cost-discipline leverage are persistent features of the current cycle, not one-quarter phenomena. The two stocks function as complementary rather than mutually exclusive exposures within a mid-tier bank allocation.
Three conditions that would strengthen the case for JDO:
Three conditions that would favour BEN:
The key decision variable for investors is whether the RBA’s tightening cycle has further to run. If it does, JDO’s rate-cycle acceleration holds more near-term upside. If it pauses, BEN’s operational leverage becomes the more reliable margin story.
The distinction this analysis has built is specific: JDO’s floating-rate SME model delivers faster NIM expansion with higher volatility, while BEN’s cost-discipline regional model delivers slower but more stable margin growth with income support. Q3 FY26 results confirmed both theses are working, but on different timelines and through different mechanisms.
Two variables warrant monitoring from here. The first is RBA forward guidance: any signal on whether the 4.35% cash rate holds or moves higher will directly shape the NIM trajectory for both banks. The second is each bank’s next quarterly NIM disclosure, which will reveal whether the Q3 momentum is sustaining or plateauing.
Mid-tier Australian bank stocks offer a differentiated exposure that the Big Four cannot replicate in this rate environment. The question is not whether to hold mid-tier exposure, but which type of margin story matches the investor’s own risk and income preferences.
This article is for informational purposes only and should not be considered financial advice. Investors should conduct their own research and consult with financial professionals before making investment decisions. Past performance does not guarantee future results. Share prices cited are indicative and were not verified via live ASX data at the time of publication.
Net interest margin (NIM) measures the spread between what a bank earns on its loans and what it pays on deposits, expressed as a percentage of earning assets. It is the single most important metric for evaluating how efficiently a bank converts interest rate movements into earnings, making it central to comparing mid-tier Australian bank stocks during a rate cycle.
Judo Capital's loan book is almost entirely floating-rate SME loans, meaning each RBA rate hike reprices lending revenue within weeks without the fixed-rate lag that slows pass-through in mortgage-heavy portfolios. This mechanism drove JDO's NIM from 3.03% in H1 FY26 to 3.15% in Q3 FY26, a 12-basis-point expansion in a single quarter.
JDO's share price fell approximately 19% in April 2026 following its Q3 FY26 trading update because the market had priced in faster NIM expansion or stronger loan book volume growth than was delivered. The margin improvement was real, but the absence of accelerating volume growth triggered a swift repricing.
Bendigo Bank's investment thesis rests on cost discipline rather than rate-cycle acceleration: operating profit grew 10.9% year-on-year in Q3 FY26 on NII growth of just 4.1%, with the gap between those two figures reflecting genuine expense control. An interim dividend of $0.30 per share and lower share price volatility than JDO make it better suited to income-focused investors.
JDO trades at a forward P/E of approximately 10.43x with broker consensus targets averaging $2.09, implying around 41% upside from its indicative $1.48 price, while BEN trades at roughly 9-10x forward earnings with independent fair value estimates of $12.77 to $13.75 against an indicative price of $10.78-$10.85, implying 18-27% upside.