
Gold is supposed to rise when the world gets more dangerous. This week, with tankers being struck near the Strait of Hormuz, the original source behind this story put the gold price fall at about 6.2% over the week. Most investors assume conflict lifts gold. Here it did not.
The reason was in the bond market, not the shipping lanes. Sticky October inflation and hawkish comments from US Federal Reserve officials pushed the 10-year Treasury yield to roughly 5%. Oil swung hard in both directions at the same time.
If you treat gold as a simple conflict hedge, a week like this can catch you on the wrong side. Rates, energy and safe-haven assets are pulling on each other, and each pull follows rules.
Here is a working model of why these three markets sometimes move together and sometimes move against each other. It will help you read the next headline more accurately.
What drove the gold price fall as yields neared 5%?
Start with the screens. According to the original source, which drew on Bloomberg, Reuters and TheStreet, the 10-year yield reached 5.103% on 12 November 2026. The 2-year yield jumped 14 basis points. A basis point is one hundredth of a percentage point.
Gold fell about 2.7-2.85% that day to roughly $3,874-3,880 an ounce, a 6.2% drop for the week. Copper slipped 1.57%, Bitcoin lost 4.06% and the Australian dollar eased to 0.6806 against the US dollar.
A later snapshot from Order Flow Futures looked calmer. The two sources captured different moments, so they should not be blended.
| Source (12 November) | 10-year yield | 2-year yield | Gold |
|---|---|---|---|
| Original source (Bloomberg, Reuters, TheStreet) | 5.103% | Up 14 bp | About $3,874-3,880, down 6.2% on the week |
| Order Flow Futures | 4.99% | 4.77% | $3,946.82, down 1.34% intraday |
Bloomberg, Reuters and TheStreet reported the 10-year yield above 5% at 5.103%, while Order Flow Futures put it just under that level at 4.99%. Either way, the direction is the same, and the geopolitical risk did not ease during the week.
Why higher yields weigh on gold
Gold pays no interest. When a US government bond pays close to 5%, holding gold means giving up that income. This lost return is called opportunity cost, and it rises with every lift in yields.
Higher US yields also tend to strengthen the dollar. Gold is priced in dollars, so a firmer dollar makes it more expensive for buyers using other currencies.
The World Gold Council (WGC) treats the 10-year Treasury Inflation-Protected Securities (TIPS) yield as a key historical gauge of this cost. That figure is a real yield, meaning the return left after inflation is taken out.
A real yield strips inflation expectations out of the nominal rate, which is why gold held up through the 2022-2023 hiking cycle while headline rates climbed; the real yield, not the policy rate, sets the true cost of holding bullion.
What this tells you is that gold responds to the cost of holding it, not to the tone of the news. A yield near 5% works against gold whatever is happening in the Gulf.
When big ASX news breaks, our subscribers know first
How divided are Fed officials on a half-point hike?
The yield move had a trigger. October consumer price index (CPI) data showed headline prices up 0.4% for the month after 0.6% in September, with core CPI, which strips out food and energy, up 0.3%. Annual figures were not published because the 2025 government shutdown left a gap in the base-period data.
That gave the hawks their argument. The Fed is agreed on direction. It is split on speed.
| Official | Stance | Date |
|---|---|---|
| Christopher Waller, Fed governor | Hike in December regardless; consider 50 bp if core CPI rose 0.3% | 10 November |
| Lorie Logan, Dallas Fed | Two further increases needed | 11 November |
| Austan Goolsbee, Chicago Fed | Everything on the table, including a half-point move | 11 November |
| Mary Daly, San Francisco Fed | More tightening likely, but no need to hurry | 12 November |
| Beth Hammack, Cleveland Fed | Restrictive, but prefers smaller and more frequent steps | 12 November |
Waller’s condition was met: core CPI came in at 0.3%. Goolsbee was blunt on CNBC.
Austan Goolsbee, President, Chicago Fed Called the October inflation report “borderline disturbing.”
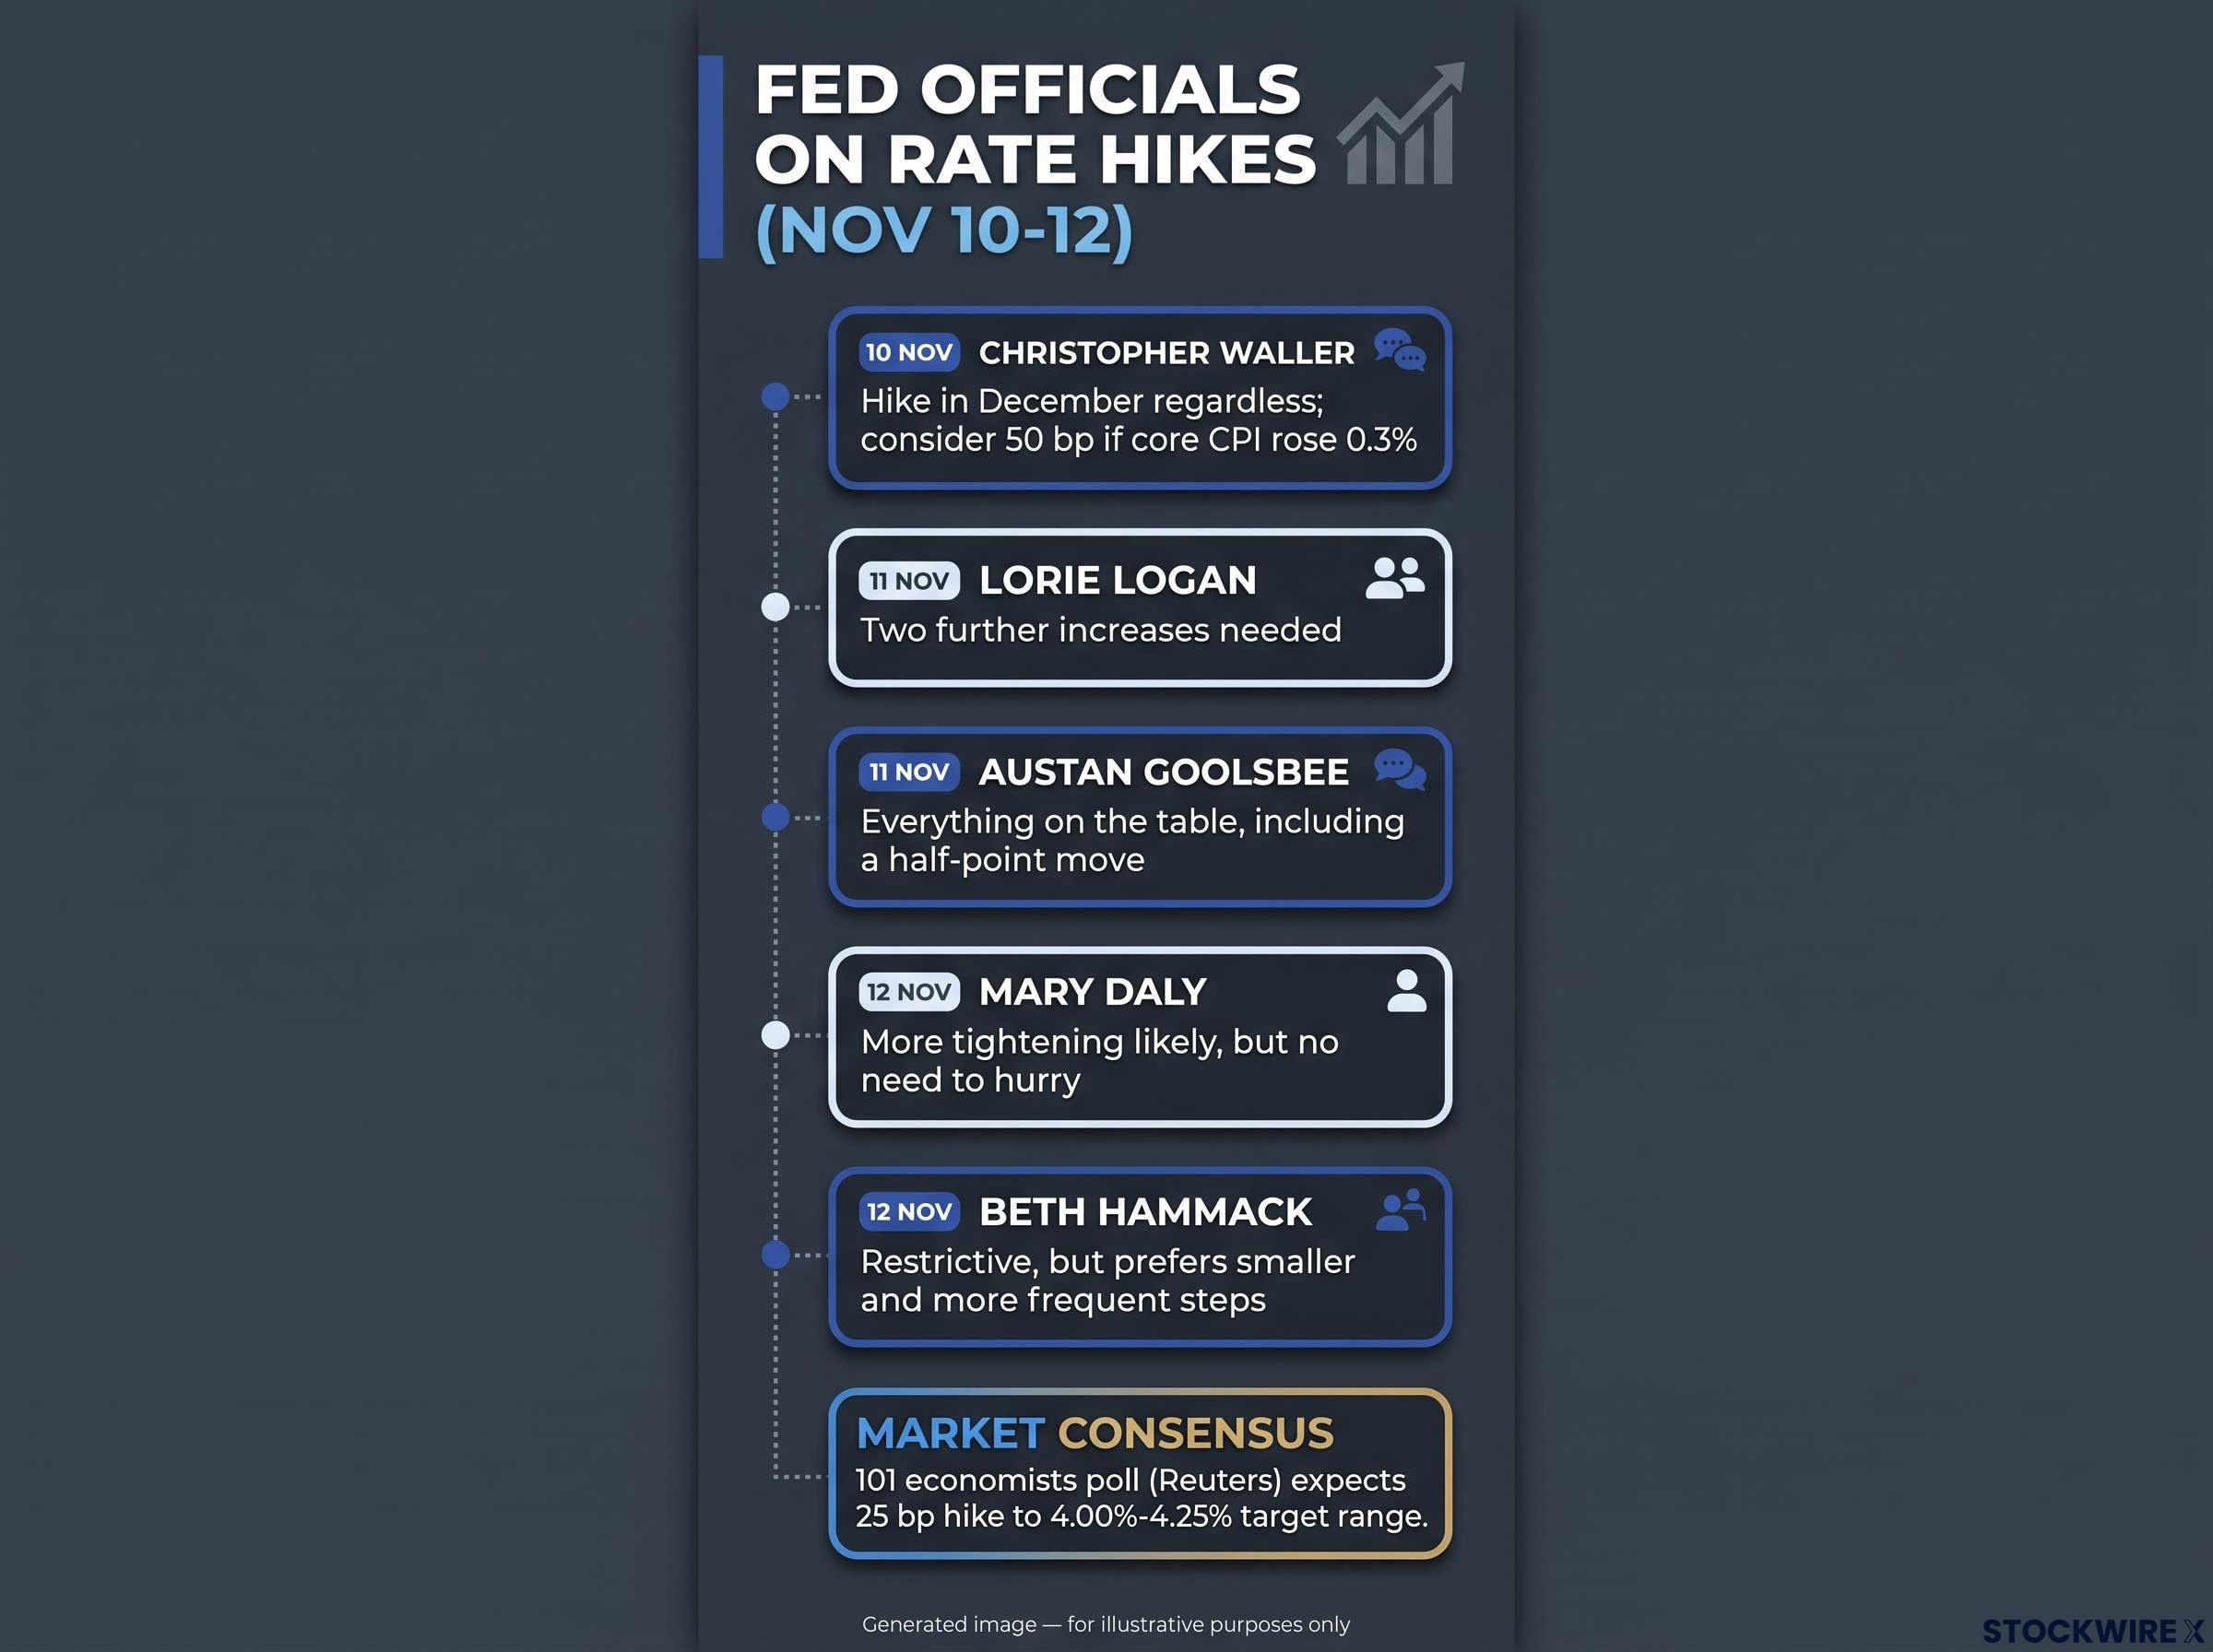
Between Nov 10 and 12, Fed officials weighed a 50 bp hike, while a Reuters poll of 101 economists expected a 25 bp move to 4.00%-4.25%.
Daly, speaking to Reuters, said inflation was spreading into services but that the Fed needed more data on “exactly how much” and “exactly when.”
Markets have settled the first question. A 25 basis point December hike is fully priced, and all 101 economists in a Reuters poll expect one, taking the target range to 4.00%-4.25%. Just 56 of them expect it to end the cycle. A 50 basis point move carries a probability of about 10% (Reuters) to 15% (CNBC).
Growth data offers no clean answer. Jobless claims sit at 200,000, still low, while existing home sales slowed to 3.75 million annualised.
For you, the risk to gold is not the quarter-point hike. That is already in the price. The risk is any signal that the pace could quicken, because that would push yields and the dollar higher again.
Why is Brent rebounding while longer-dated oil stays elevated?
Inflation is where oil enters the story, and oil has been whipsawing. Brent crude fell about 16% in the week ending 6 November, its largest weekly fall since the start of the pandemic, according to Reuters. The original source measured a fall of nearly 25% over 10 days, a different window.
Markets were pricing de-escalation and returning Saudi supply. Then the attacks kept coming.
Reuters, citing the Washington Institute for Near East Policy, counted 37 ships attacked in October, the highest monthly total since the conflict began. At least 10 more were hit in the first 10 days of November. Brent settled at $98.29 on 5 November, up 3.88%, and at $92.76 on 11 November with WTI at $86.53.
On 12 November, the original source put Brent near $96 and WTI at $88.98. Order Flow Futures showed $93.44 and $87.15. Again, these are different timestamps.
Near-term supply versus longer-dated transport risk
Prices for prompt delivery follow the barrels available now. Returning Middle East supply pulls them down. Contracts for later months carry the cost of moving oil safely: tanker insurance, freight rates, rerouting and war-risk premiums.
Speaking to CNBC, Real Macro‘s Jeffrey Currie argued that prompt oil prices ought to remain subdued while Middle East barrels come back, but that steep insurance costs and tanker rates are holding up prices further out on the curve. That gap shows up in the futures curve, the line of prices across delivery dates:
- Contango: later prices sit above near-term prices.
- Backwardation: near-term prices sit above later ones, signalling immediate scarcity.
- Mixed or kinked: prompt prices are pushed down by supply while later prices hold a risk premium, which describes November 2026.
Oil is running on two clocks. The second one, transport risk, keeps shipping costs and headline inflation worries alive, and that keeps hawkish Fed talk alive with them. A single Brent headline tells you neither peace nor escalation.
US oil dominance changes how a price spike travels through the economy, since higher prices now recirculate income domestically, though lower-income households and energy-intensive manufacturers still bear a regressive cost.
When does rising yield pressure gold, and when might it not?
The simple rule that higher yields mean lower gold held this week. It does not always hold. What matters is why yields are rising.
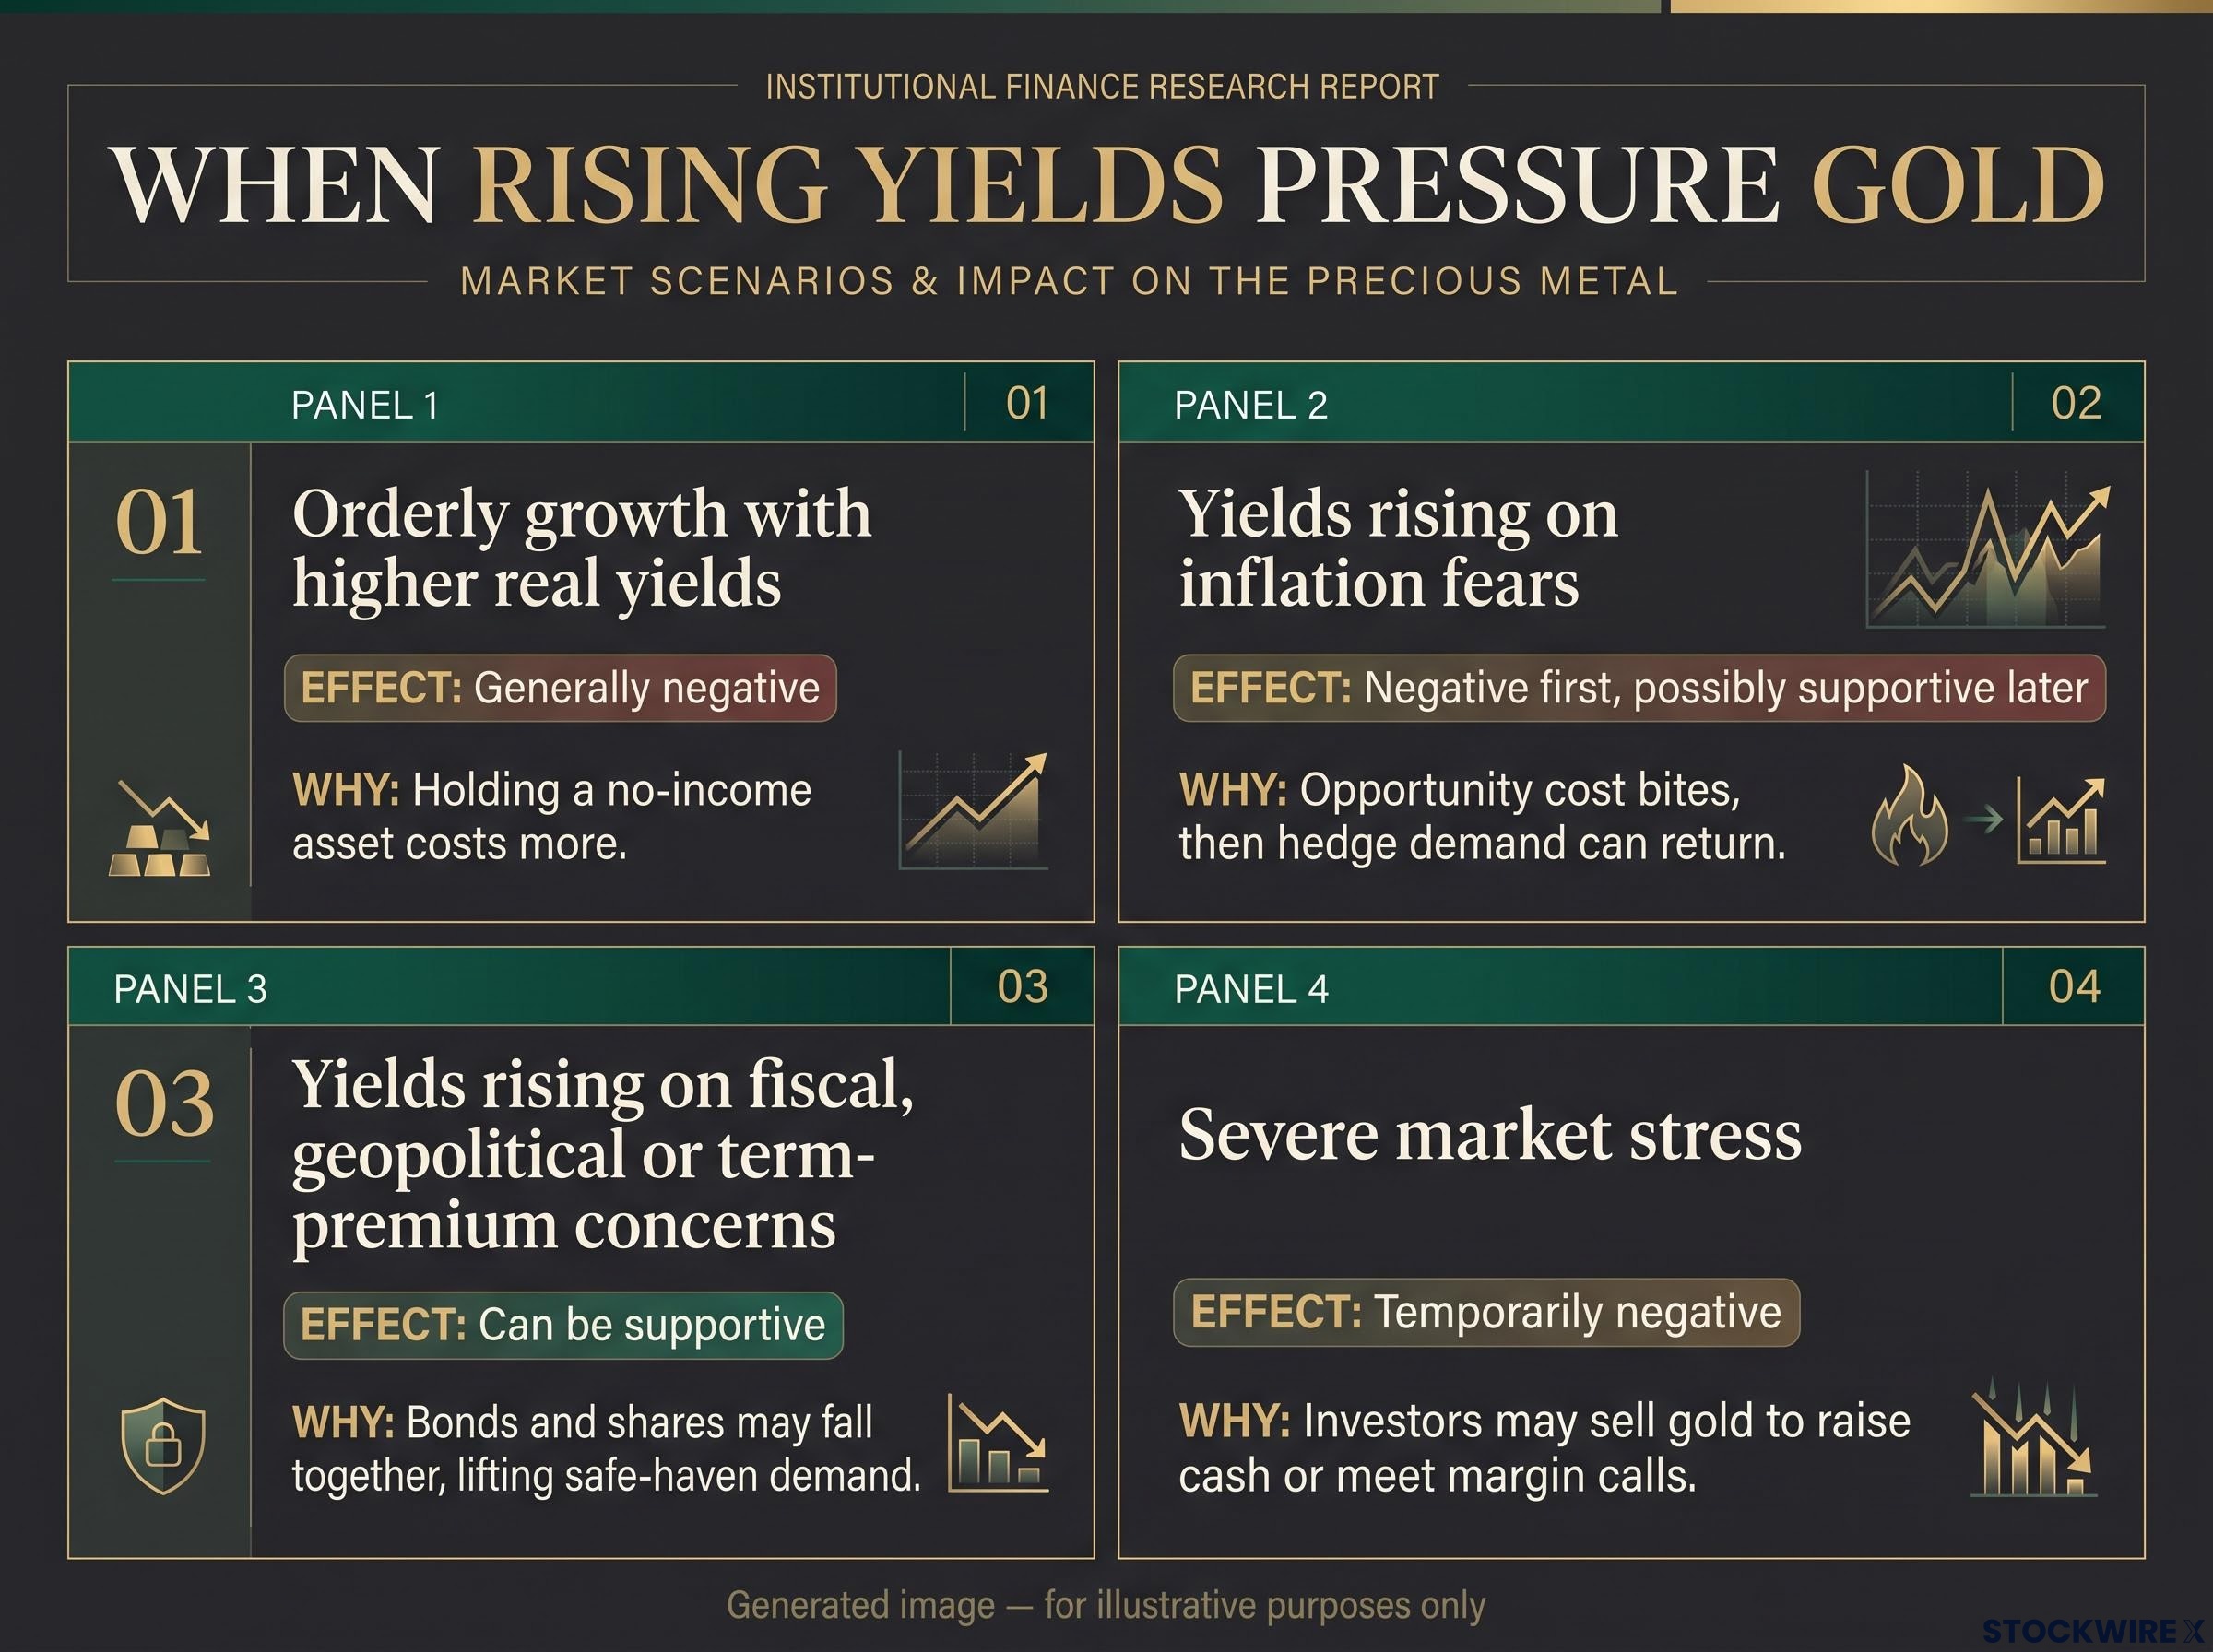
Rising yields affect gold differently across 4 key scenarios, depending on whether driven by growth, inflation, geopolitics, or stress.
| Scenario | Effect on gold | Why |
|---|---|---|
| Orderly growth with higher real yields | Generally negative | Holding a no-income asset costs more |
| Yields rising on inflation fears | Negative first, possibly supportive later | Opportunity cost bites, then hedge demand can return |
| Yields rising on fiscal, geopolitical or term-premium concerns | Can be supportive | Bonds and shares may fall together, lifting safe-haven demand |
| Severe market stress | Temporarily negative | Investors may sell gold to raise cash or meet margin calls |
A term premium is the extra yield investors demand for lending over a longer period. When it climbs on worries about government debt or conflict, the bond sell-off itself can send money towards gold.
2022 shows how the rule can bend. The WGC found the 10-year TIPS yield rose about 250 basis points and the dollar gained more than 8%, yet gold still posted a small annual gain. Geopolitics, inflation and central-bank buying offset the yield pressure.
The WGC’s 2026 outlook makes the same point in time terms: a hawkish turn can hurt gold in the near term, while persistent inflation and financial stress can lift hedge demand over the medium term.
The bear case rests on higher real yields, a stronger dollar and money rotating back into riskier assets. The bull case rests on central-bank purchases and fiscal and geopolitical uncertainty. Growth signals are mixed too, with claims at or below 200,000 for nine weeks while housing weakens.
The read you should take from this is that a rising yield is a question, not an answer. Watch real yields, the dollar and the Fed’s pace, and ask what is driving them, rather than reacting to conflict headlines alone.
What to watch next as rates, oil and gold stay linked
This week’s gold decline reflects yields near 5% and a December hike that markets have fully priced. Oil’s two-speed pricing keeps inflation risk alive beneath the surface.
Three variables matter most from here:
- Fed pace signals before December, especially any shift in the odds of 50 rather than 25 basis points.
- Real yields and the dollar, which set gold’s opportunity cost.
- Hormuz attacks, and whether they persist or ease, since they drive the transport premium in longer-dated oil.
Two practical habits follow. Do not assume gold hedges every kind of stress, because the cause of a yield move decides its effect. And check a source’s timestamp before comparing levels, since this week alone produced two credible but different readings.
This article is for informational purposes only and should not be considered financial advice. Investors should conduct their own research and consult with financial professionals before making investment decisions.