
Options traders went into Intel’s third-quarter result pricing a move of about 9.4% in either direction. Intel then slumped to a premarket $69.40 and opened near $65.76, an earnings gap down roughly two and a half times larger than the market expected.
The quarter itself was good. Intel beat expectations when it reported after the close on 29 October 2026, and the stock still collapsed on 30 October.
That combination is the signal many bullish traders miss. A strong set of results gives no protection to a position held overnight through the announcement. If you carry exposure into an earnings release, the amount you can lose is decided by how you built the trade, not by whether the company “did well”.
Here is how four bullish positions fared through Intel’s gap, why one defined-risk spread kept its loss to $120, and how to size a trade before the next earnings date so the worst case is one you can absorb.
What happened to Intel, and why did a beat still trigger an earnings gap down?
On paper, Intel delivered. Third-quarter revenue reached $16.5B, up about 21% year on year, and adjusted earnings per share (EPS, the profit attributed to each share) came in at $0.52 against consensus of roughly $0.40-$0.41.
Then the fourth-quarter guidance arrived, and each number was worse than the last.
| Measure | Result or guidance | Consensus | Gap |
|---|---|---|---|
| Q3 revenue | $16.5B | ~$16.48B | Slight beat |
| Q3 adjusted EPS | $0.52 | ~$0.40-$0.41 | Clear beat |
| Q4 revenue guidance | $15B-$16B | ~$17.3B | Below at the top of the range |
| Q4 adjusted EPS guidance | $0.25 | ~$0.43-$0.44 | Well below |
| Q4 adjusted gross margin guidance | ~38% | Q3 was 44.1% | Sharp step down |
From a pre-earnings close of $92.07, the stock was quoted at $69.40 at 8:04 a.m. ET, down $22.67 or 27.62% on CNBC market data cited by Financial Express. Calculated directly from those two prices, the fall is about 24.6%; the quoted percentage uses a different reference point. The open near $65.76 reported by the original source implies a drop of roughly 28.6% from the close.
Why the Q4 outlook outweighed the Q3 beat
- PC demand: Reports cited a possible 25%-30% sequential fall in Q4 PC shipments. Bank of America’s Vivek Arya said the weakness was more severe than investors appreciated.
- Margin compression: Guidance of about 38% marked a steep retreat from 44.1%.
- Factory disruption: Morningstar estimated a reported accident in Israel could cost about $300 million of revenue and 200 basis points of gross margin in Q4.
- Foundry losses: Foundry revenue reached $6.7B, yet the unit lost about $1.9B at the operating level.
- High expectations: The prior rally had priced in a substantial recovery.
Bank of America downgraded Intel to Neutral and cut its target from $145 to $100. Morningstar cut fair value from $105 to $85, calling the sell-off largely justified because PCs make up roughly 50%-60% of revenue in a normal quarter.
What this tells you is that the quarter just reported rarely moves the stock. A bullish case built on the last results can be overturned by the next set of forecasts in a single session.
The expectations gap explains why a strong print can still sell off: with 84% of S&P 500 companies beating EPS estimates in Q1 2026, markets have learned to expect beats and give them little credit.
When big ASX news breaks, our subscribers know first
Why can an earnings gap down exceed the options-implied move?
Many traders treat the implied move as a boundary. It is not one.
The options-implied move is the price change the options market is pricing in for an event. It is roughly derived from a near-term at-the-money straddle, which is buying a call and a put at the strike closest to the current share price. Cboe explains that it reflects the expected size of the reaction without predicting direction.
TipRanks put Intel’s implied move at about 9.4%, a range of $84.91-$102.57 from the 27 October close of $93.74. EarningsWatcher estimated about 9.2% and BigGo Finance about 10.54%.
The implied move is an estimate, not a maximum.
CME describes the expected move as roughly one standard deviation, meaning the market assigns about a two-thirds probability to the stock finishing inside the range. That leaves about one chance in three of landing outside it. Intel’s 24.6% fall to the premarket level was about 2.6 times the implied move.
Nike’s own earnings history shows how unreliable options market signals can be as predictors, with a realised move of +21.1% against an 8.1% implied in June 2025 and a -0.3% move against 9.4% implied a year later.
The mechanics usually unfold in four steps:
- Implied volatility builds. Fidelity’s Cboe material notes that earnings uncertainty pushes implied volatility (IV, the market’s estimate of future price swings) and option prices higher.
- The news lands. Results arrive after the close, when after-hours liquidity is thin and spreads are wide.
- The stock gaps. CME notes stop orders may not execute near their intended price when the share price jumps overnight.
- IV collapses. Known as IV crush, this can cut the value of calls and puts even if the stock moves the way you expected.
What the options market cannot price
Guidance cuts, production disruptions and demand shocks generate the tail moves that a one-standard-deviation estimate does not capture. Intel had all three in one release.
The pattern is not new. Meta fell about 26% in February 2022 after a weak forecast, and nearly 20% in October 2022 after another soft outlook and rising projected costs. In both cases guidance drove the gap.
For you, the lesson is direct: sizing a position to survive the implied move is a mistake. Plan for the move beyond it.
How did four bullish positions fare after the Intel gap?
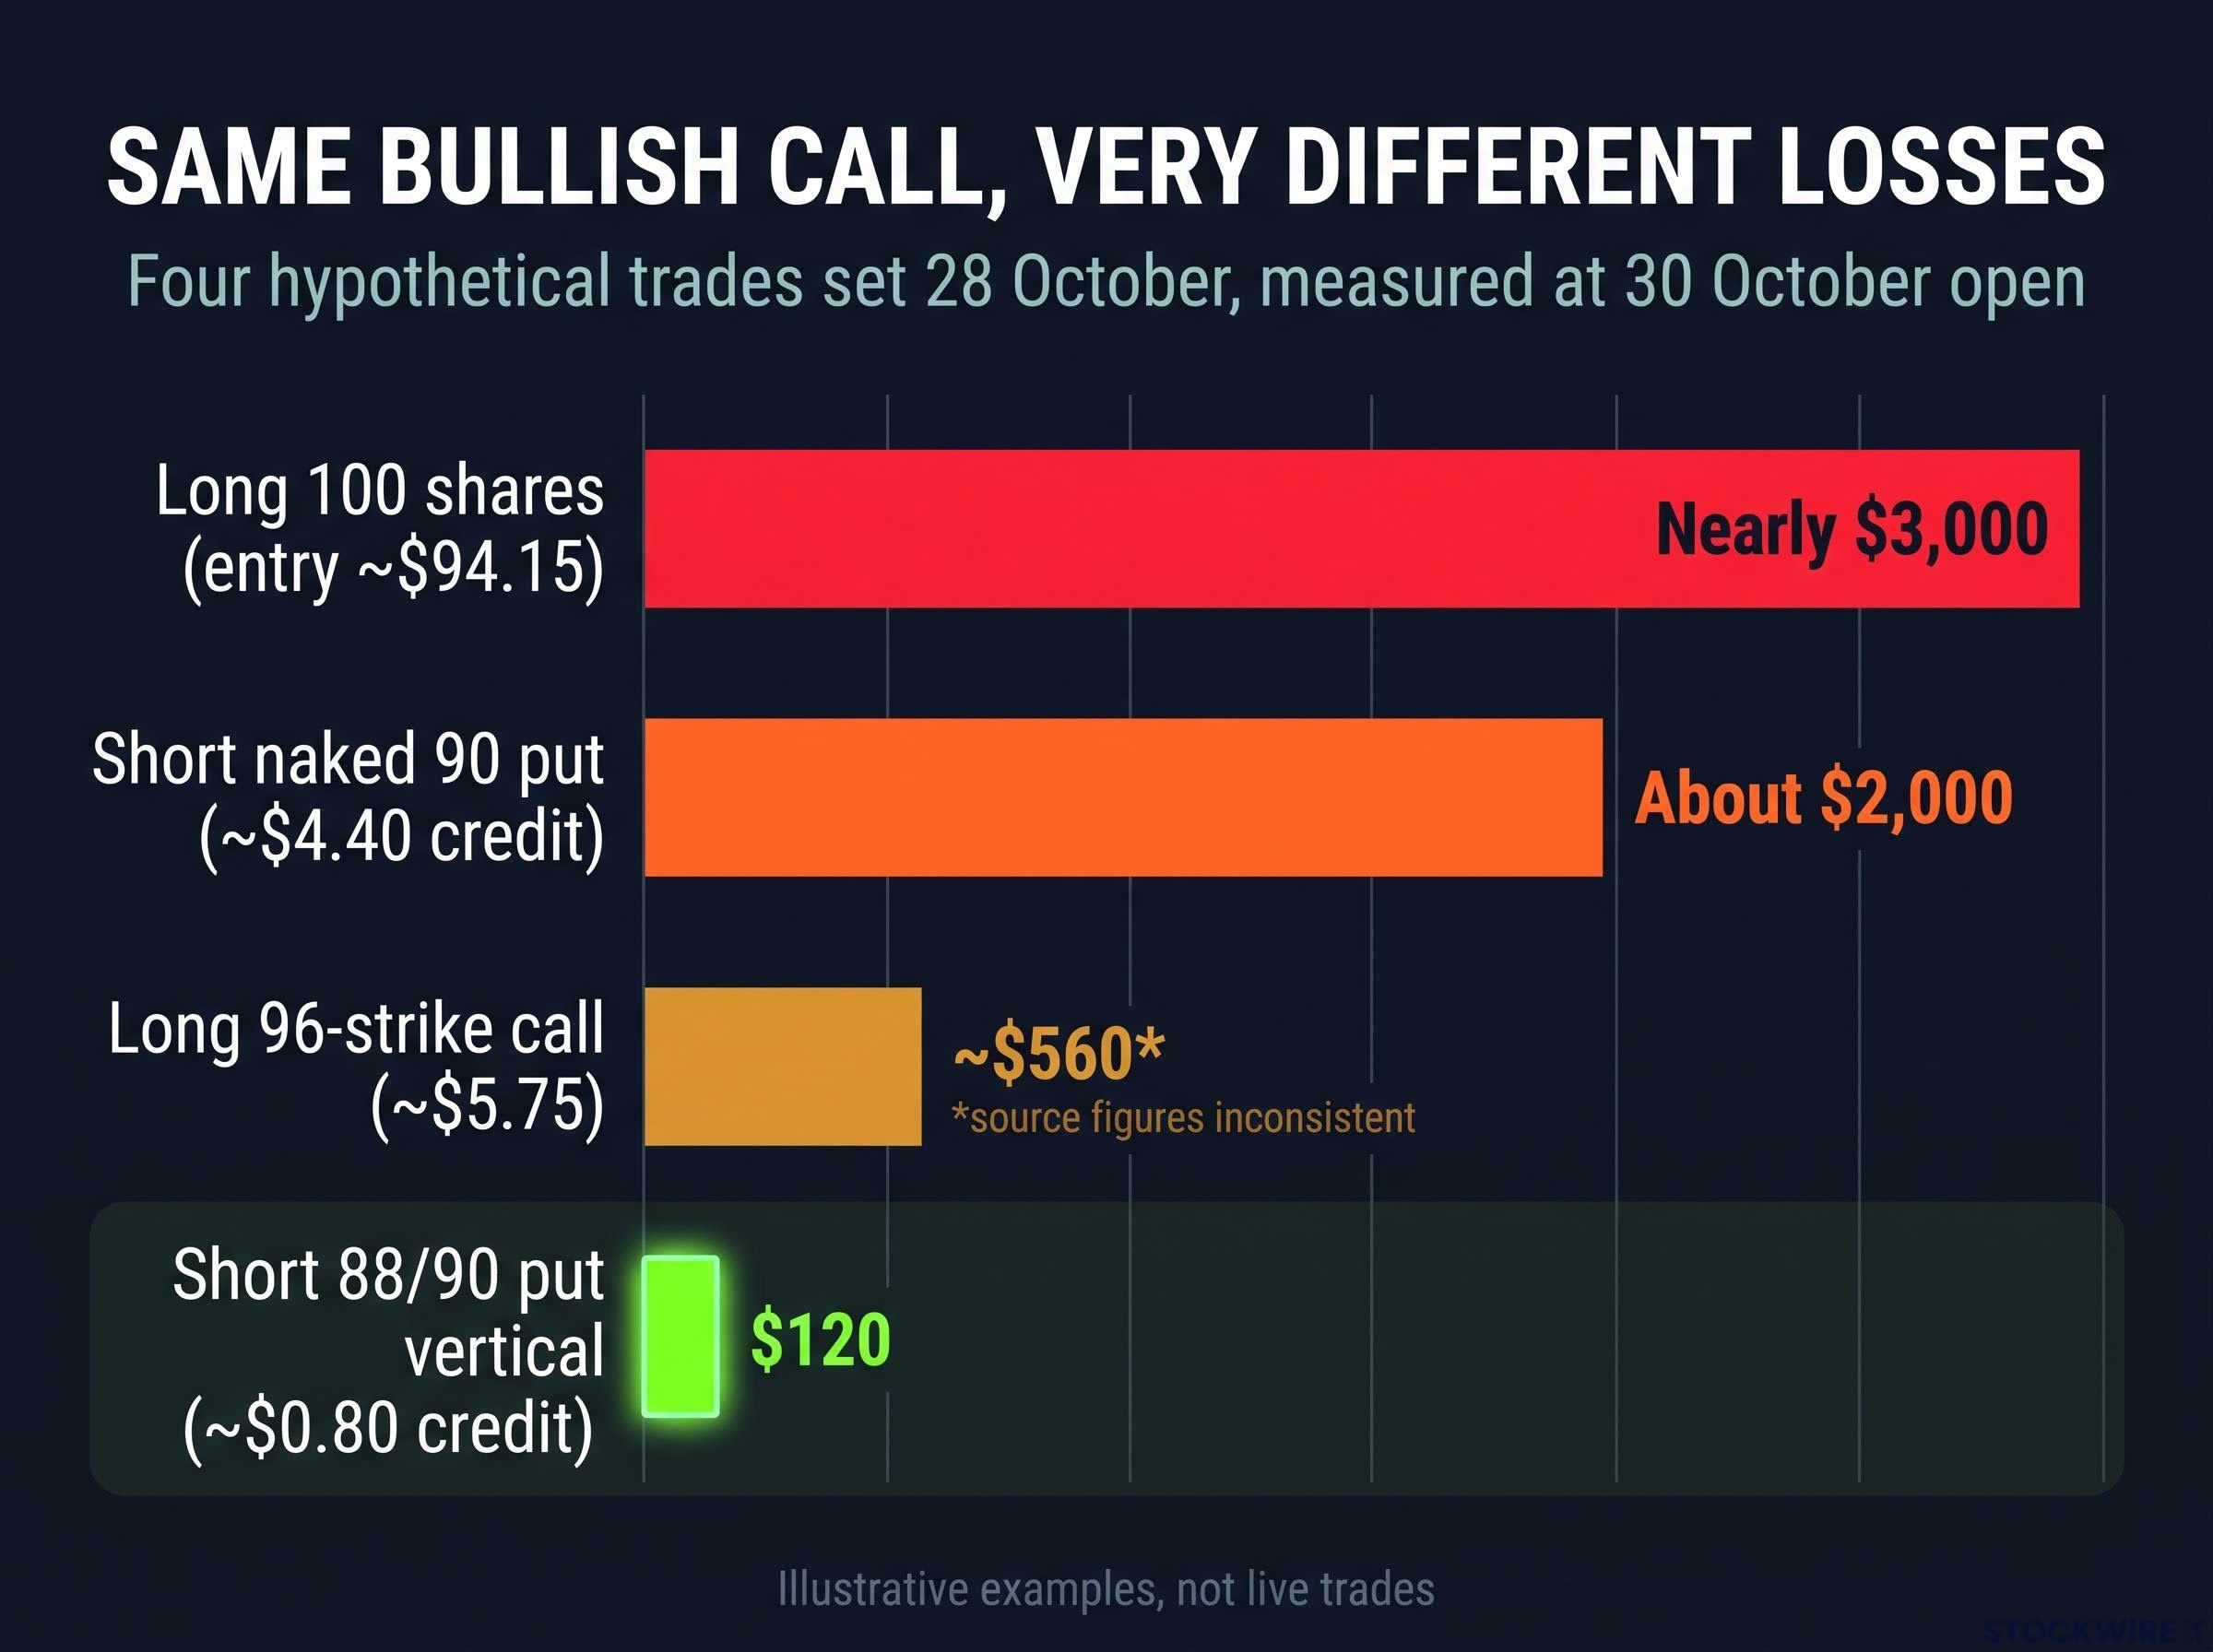
The original source compared four hypothetical bullish trades set on 28 October and measured at the 30 October open. They are the speaker’s illustrative examples, not live trades.
| Strategy | Entry | Result at 30 October open | Loss | Maximum-loss profile |
|---|---|---|---|---|
| Long 100 shares | ~$94.15 | Stock opened near $65 | Nearly $3,000 | No built-in cap; potentially almost the full investment |
| Long 96-strike call | ~$5.75 | Speaker said worth about $13 | ~$560 (source figures inconsistent) | Premium paid |
| Short naked 90 put | ~$4.40 credit | Worth about $25 | About $2,000 | Very large; approaches the strike value if the stock goes to zero |
| Short 88/90 put vertical | ~$0.80 credit | Gapped through both strikes | $120 | Spread width minus credit |
The shareholder lost nearly $3,000 with no mechanism to stop the bleeding overnight. The naked put seller, who collected $4.40 for a put about $4 out of the money, watched it swell to roughly $25 for a loss near $2,000.
The call figures need a caveat. The speaker described the call as worth about $13 and a loss of roughly $560, but a call bought for $5.75 and worth $13 would be a gain, so the source’s numbers do not reconcile. What holds either way is that a long call’s loss is limited to the premium paid.
Then there is the spread: a $120 loss on a trade that could have made $80.
Why the put vertical limited the damage
Maximum loss on the spread: $2 width minus $0.80 credit equals $120 per spread.
- Sell the 90 put and collect premium, taking on the obligation to buy at $90.
- Buy the 88 put, which gains value one for one as the stock falls below $88.
- Below $88, losses stop growing, because the long put offsets the short put.
- The worst case is fixed: $2 of width less $0.80 of credit, or $120 per spread.
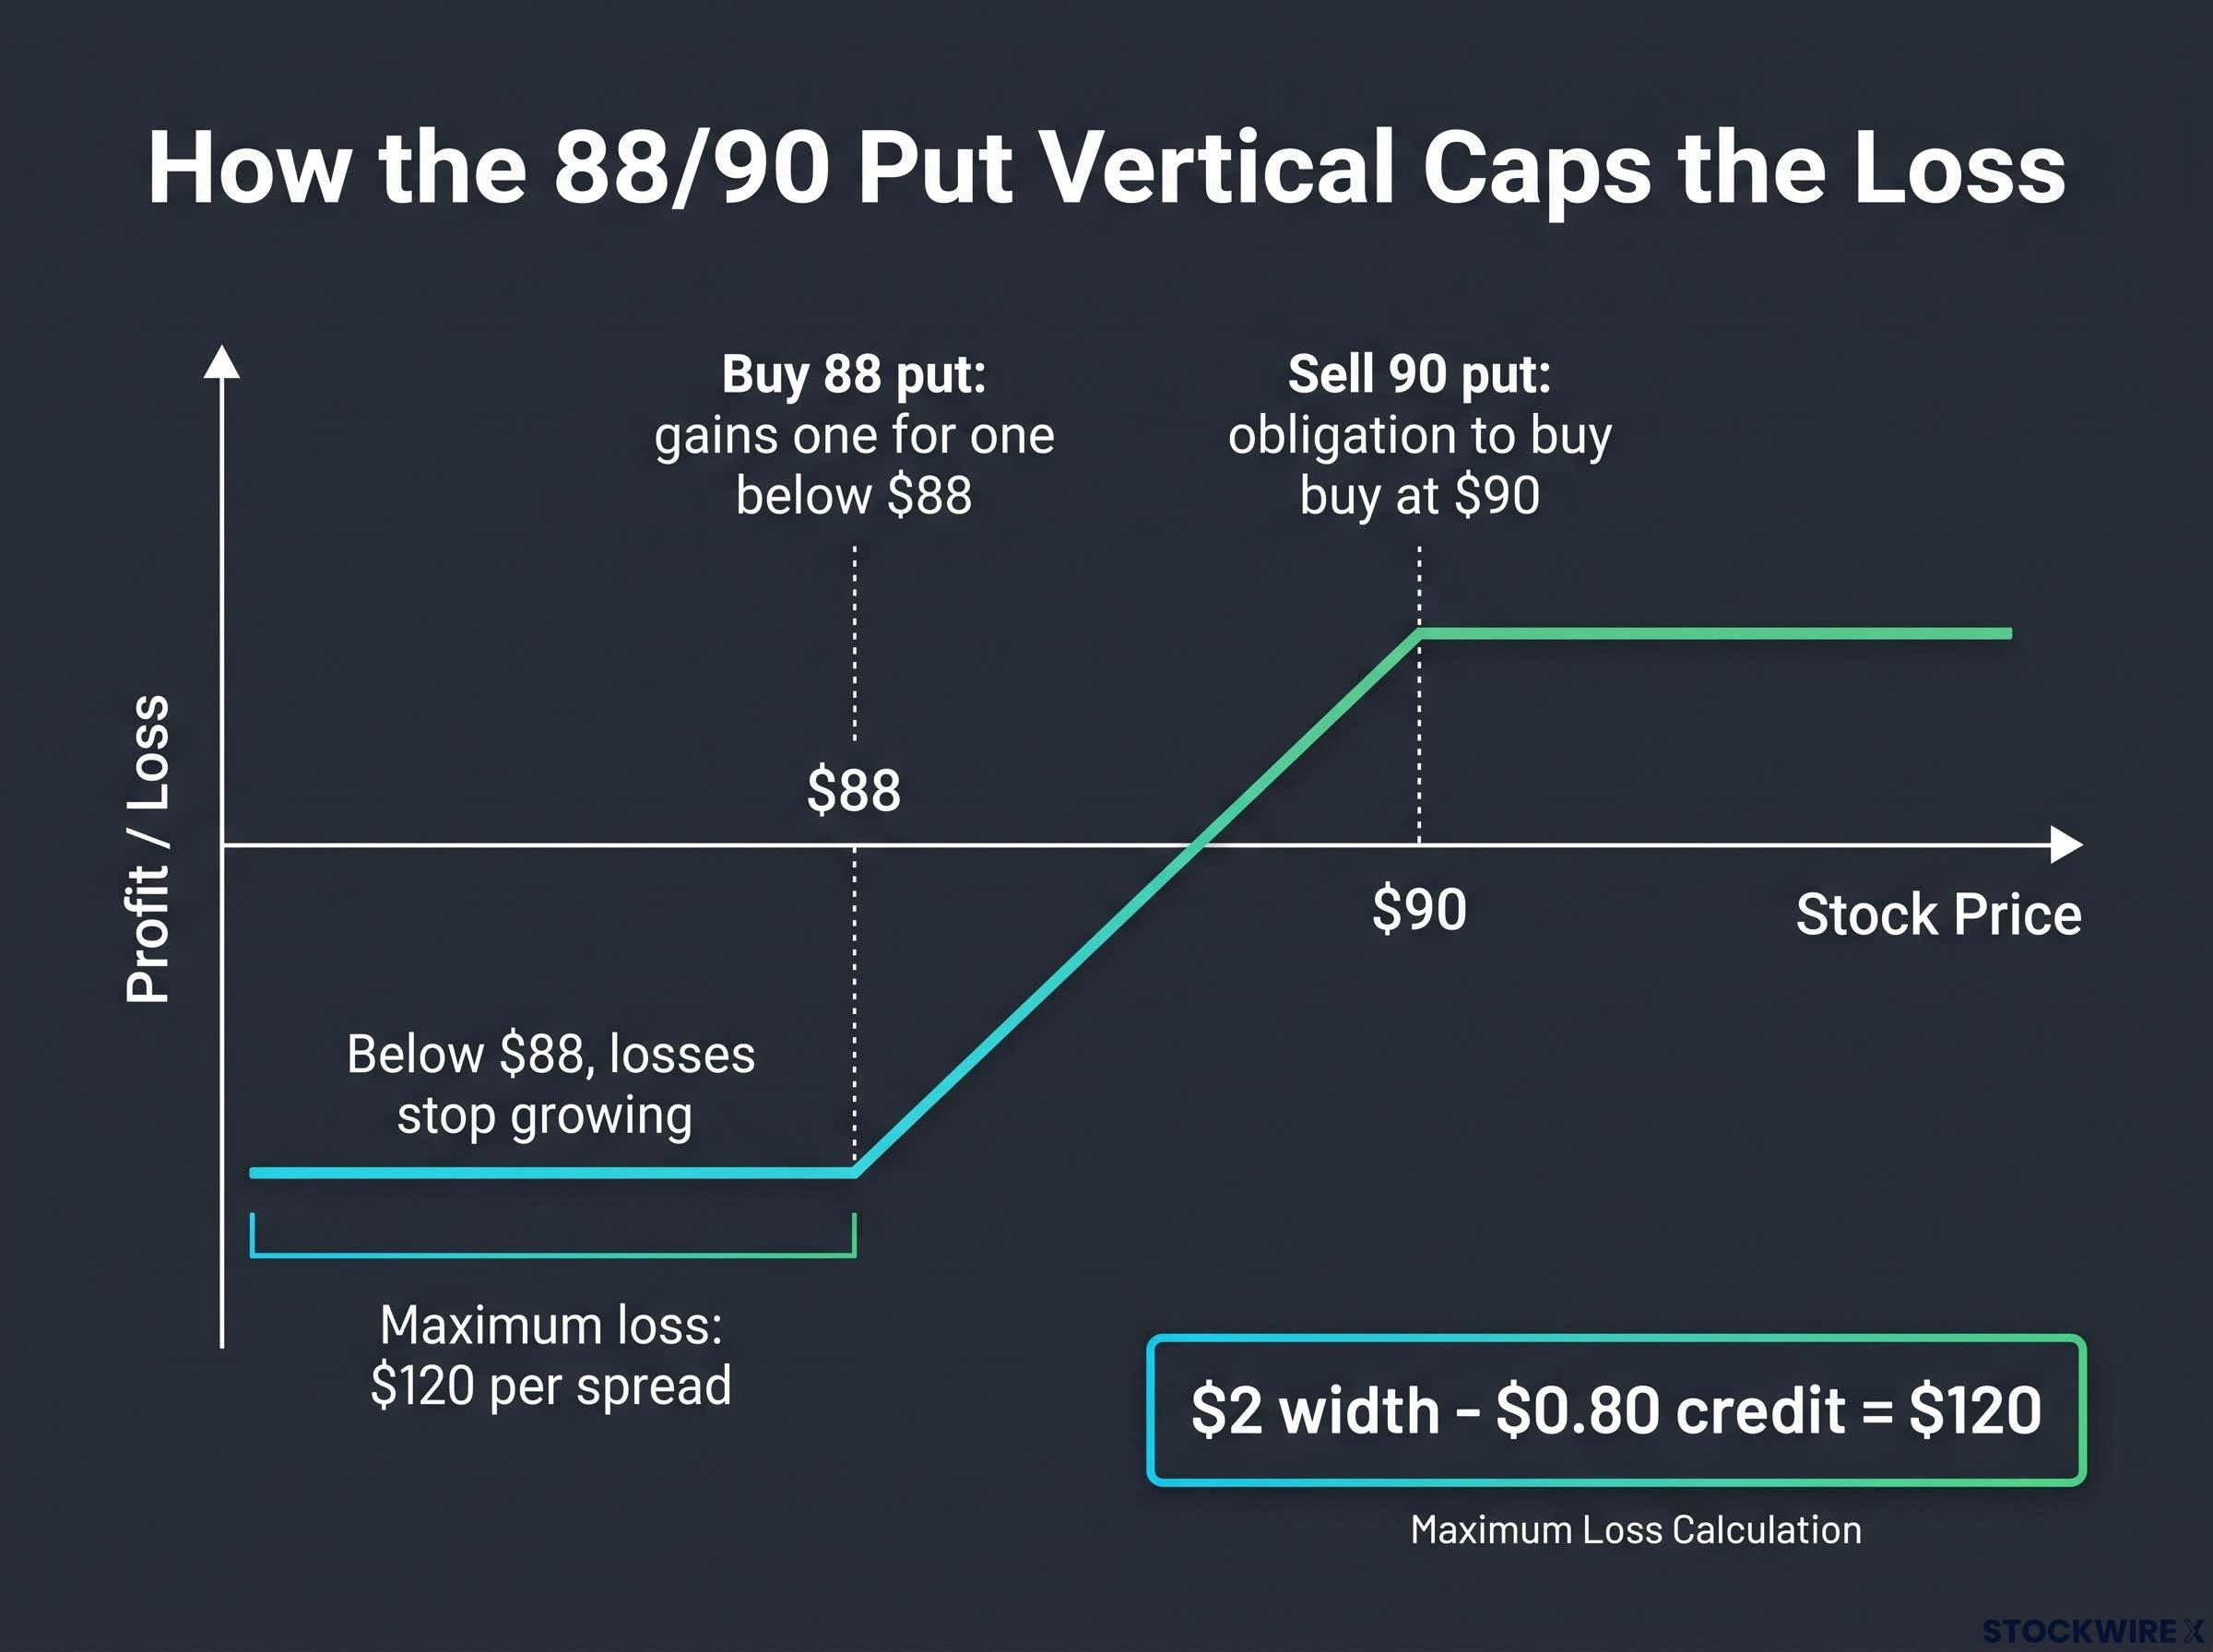
A generic version shows the same logic. Sell a $90 put and buy an $80 put for a $2 credit, and your maximum loss is $8 per share ($800 per contract) whether the stock lands at $70 or $30.
All four traders made the same bullish call and were equally wrong. Structure, not direction, decided how much each lost, so how you express a view matters as much as the view itself.
What are the limits of defined-risk spreads, and how should you size them?
The spread did not escape. It hit its maximum loss.
That distinction matters. A gap can pass straight through both strikes, so a vertical offers no protection from losing; it makes the loss knowable before you enter. The worst case becomes known, not pleasant.
There are practical caveats:
- Early assignment: The Options Clearing Corporation (OCC) says American-style short options can be assigned on any business day, with risk rising deeper in the money and closer to expiry.
- Temporary stock exposure: If your short leg is assigned before you act on the long leg, you may briefly hold unhedged shares or face a margin call.
- Margin differences: OCC states uncovered put writers must maintain substantial margin, while purchased options are generally paid for in full.
- Width trade-off: Wider spreads give more room but raise the maximum dollar loss; narrower spreads cap loss but usually pay less credit.
- Credit versus width: Maximum profit is the credit, so a small credit against a wide spread is a poor bargain.
Bullish traders can use a short put vertical or a long call vertical; bearish traders a short call vertical or a long put vertical. A commonly cited guideline, not an established standard, is to size each trade so its maximum loss is about 2%-5% of capital.
Before the next release, run a short checklist:
- Confirm the maximum loss using width minus credit.
- Check the credit against the width to judge whether the reward justifies the risk.
- Size to the loss, so losing the full amount would not damage your account.
- Check assignment and margin rules with your broker.
Whether to trade earnings at all remains your decision. If you do, the question to ask is “what is my maximum loss, and can I accept it?”
Traders exploring other defined-risk ways to play earnings can read our dedicated guide to earnings calendar spreads, which explains the front-to-back IV ratio that decides whether a setup is worth taking.
What the Intel gap changes about how you plan for earnings
Three lessons come out of last week. Guidance, not the reported quarter, moves the stock. The implied move describes a likely range, not a ceiling. And the structure of your trade sets the size of your loss long before the result is published.
That reorders the decision. Most traders start with a view on direction and then pick a trade to express it. A sturdier habit is to start with the loss you can absorb in full, then choose the structure that keeps you inside it, whether that is a vertical spread, a smaller position or no position at all.
Before the next earnings date on your watchlist, write down your maximum loss first. If you cannot name it, the trade is not ready.
This article is for informational purposes only and should not be considered financial advice. Investors should conduct their own research and consult with financial professionals before making investment decisions.