
SpaceX IPO Hits $3 Trillion Market Cap in 72 Hours
2 hrs ago

Hub24 has fallen roughly 15% since the start of 2025, and yet it still trades at a price-to-sales multiple 53% above its own five-year average. Zip Co, meanwhile, sits more than 109% above its 52-week low and yet trades at a 28% discount to its historical norm. Both companies occupy the broad fintech and wealth-tech space on the ASX, but they currently sit at opposite extremes relative to their own valuation histories. That divergence raises a pointed question for investors evaluating entry points: which stock’s gap to its own history reflects genuine mispricing, and which reflects a structural shift in what the market is willing to pay? What follows uses the historical price-to-sales framework to surface the divergent risk-reward profiles of HUB and ZIP, profiles each company’s business quality, and translates the valuation gap into a clear set of trade-offs.
Price-to-sales ratios strip out the noise of earnings volatility, making them a useful lens for growth-stage companies where profitability is either immature or recently established. For Hub24 and Zip Co, the P/S framework reveals two stocks sitting on opposite sides of their own valuation histories.
| Metric | Hub24 (HUB) | Zip Co (ZIP) |
|---|---|---|
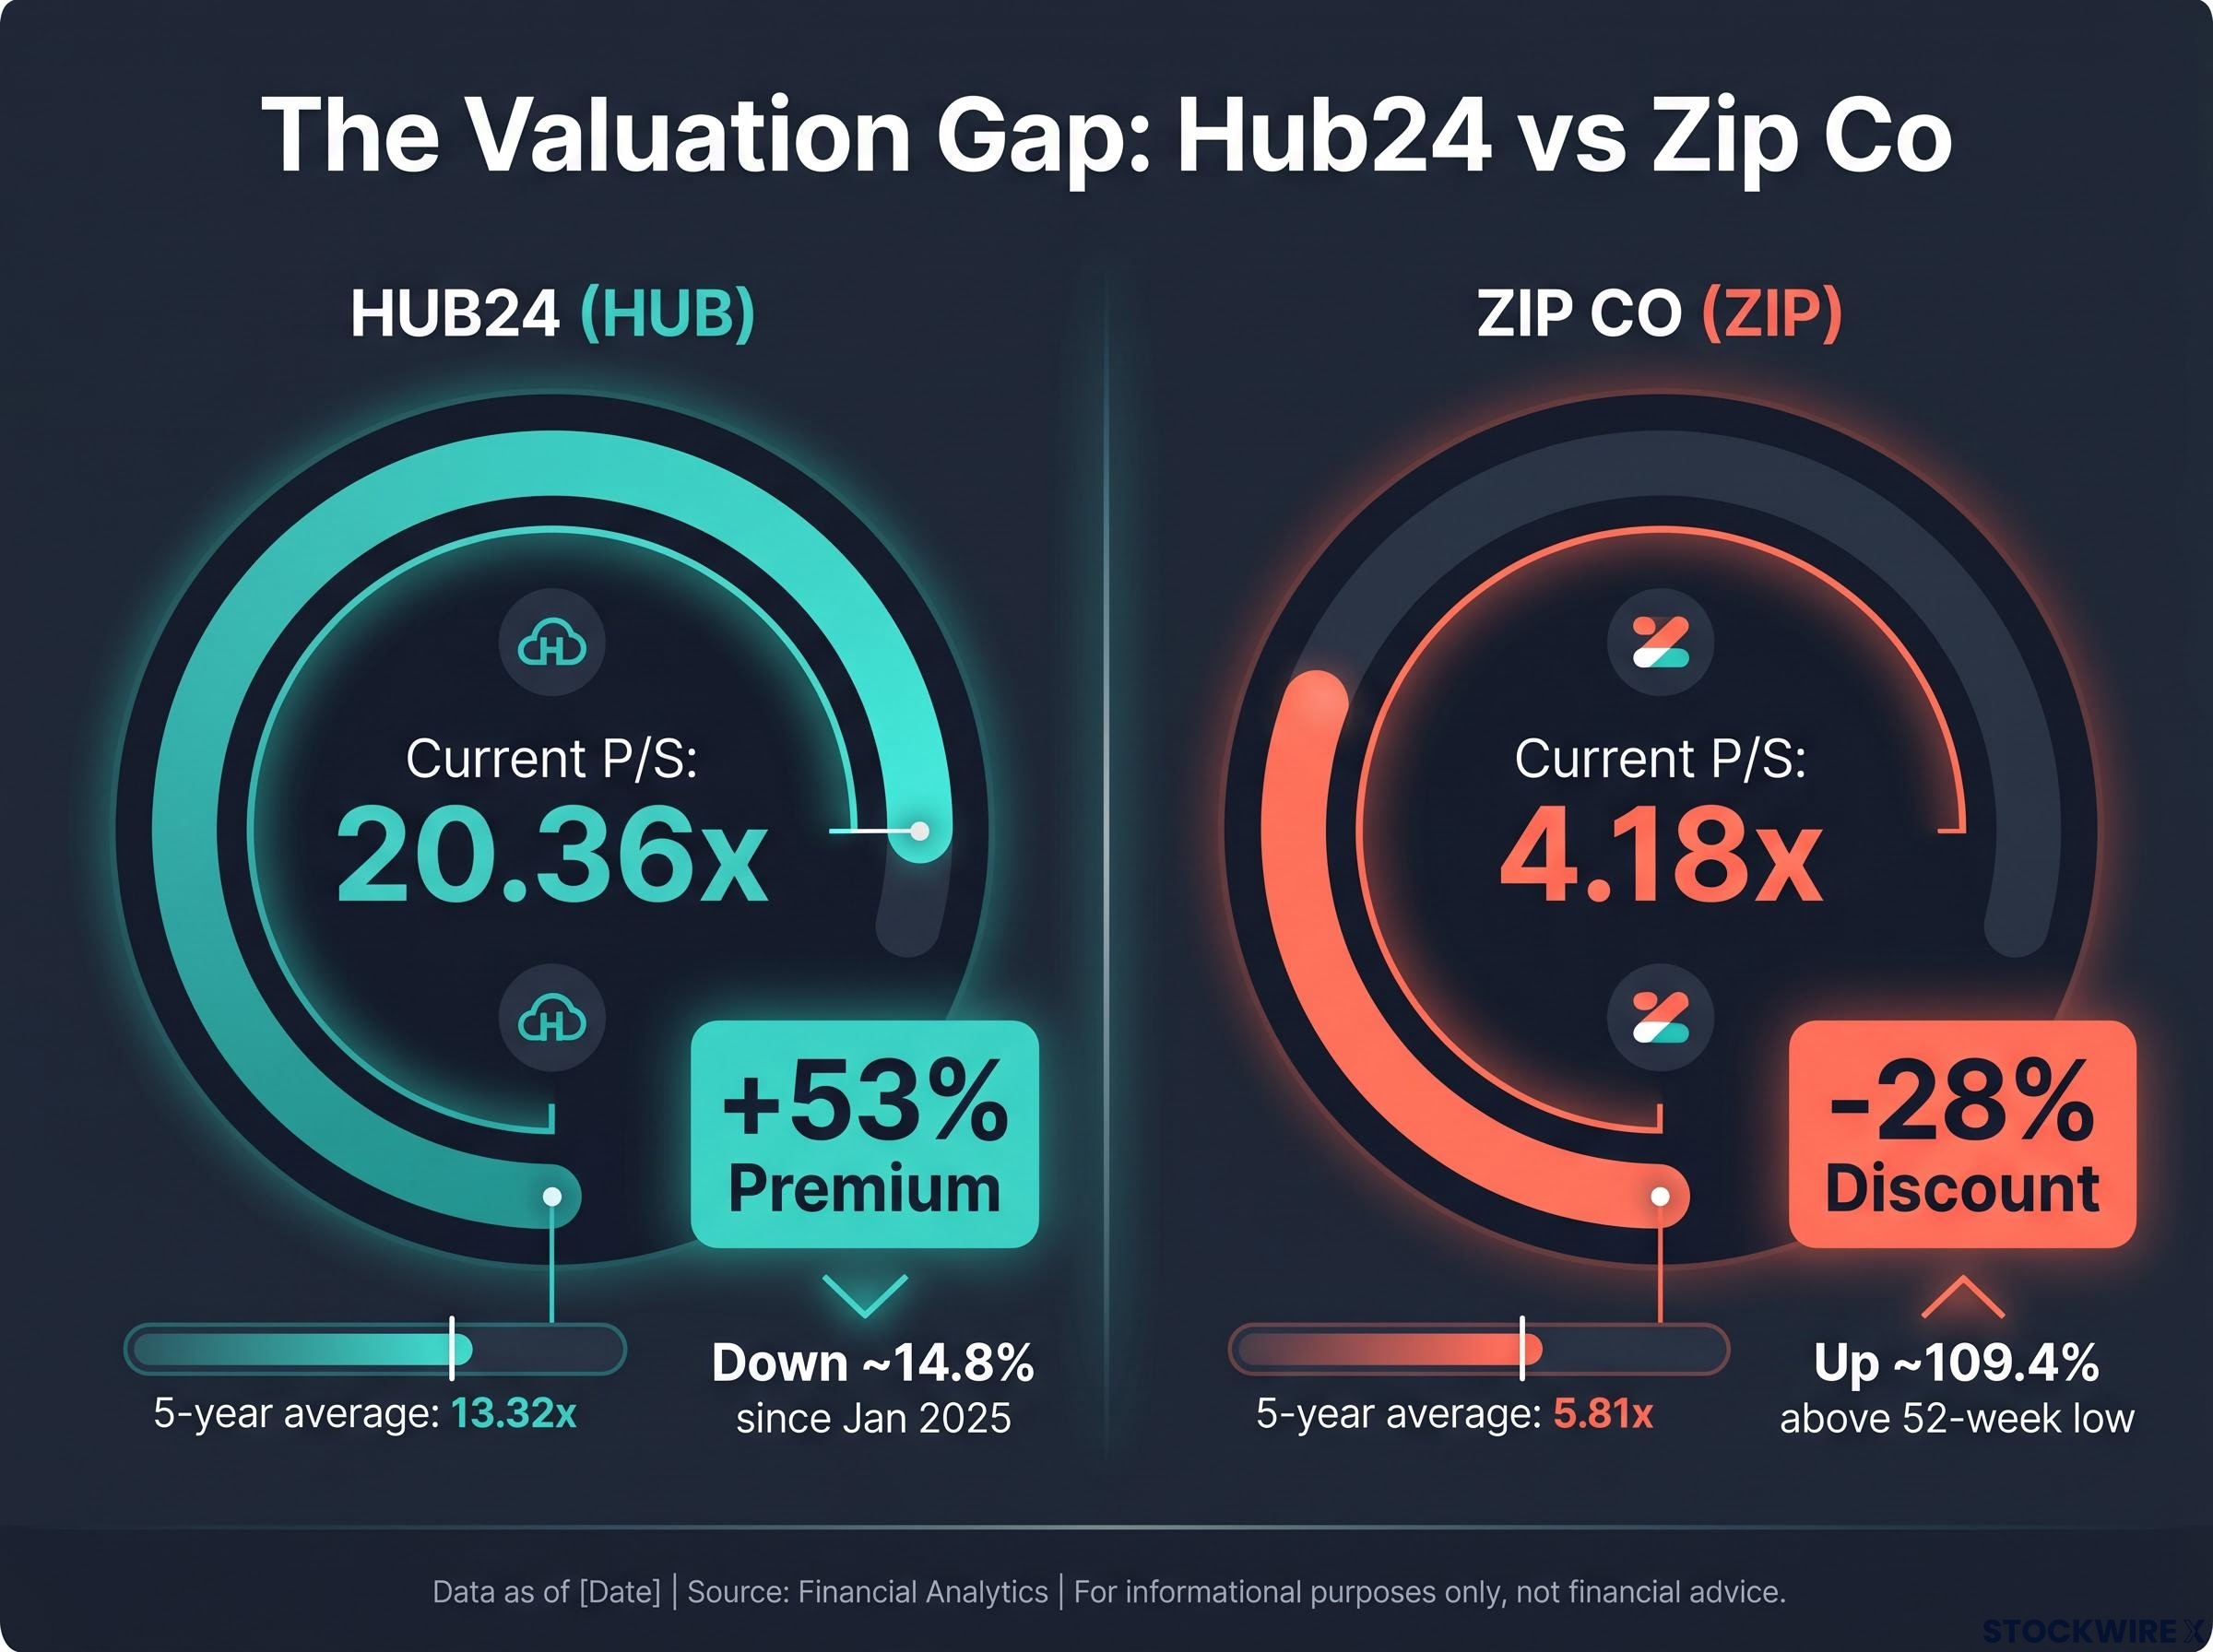
| Current P/S | 20.36x | 4.18x |
| 5-year average P/S | 13.32x | 5.81x |
| Premium or discount vs history | ~53% above | ~28% below |
| Share price move since January 2025 | Down ~14.8% | ~109.4% above 52-week low |
| Position vs 52-week range | Trading below recent highs | ~51% below 52-week high |
The central contrast: Hub24 trades at a 53% premium to its own five-year average P/S. Zip Co trades at a 28% discount. One stock has sold off and remains expensive by its own standards. The other has rallied hard and still looks cheap by its own standards.
The rest of this analysis asks whether each gap reflects rational repricing or an exploitable mispricing, and what would need to happen for each stock’s bull case to materialise.
Hub24 operates across three core products, each positioned within structural tailwinds in Australian wealth management:
Platform embeddedness matters here. Switching costs in wealth-tech are high; once an advice practice integrates its workflows around a platform, the friction of migrating is substantial. That stickiness underpins the durability of Hub24’s revenue base. The company received the Overall Best Platform designation from the Adviser Ratings Financial Advice Landscape Report in 2024, and ranked first for Overall Satisfaction and Brand Image and Reputation in the 2024 Wealth Insights Platform Service Level Report.
Revenue has compounded at approximately 44% per year since 2021, reaching $328m in FY24. Net profit rose from $10m to $47m over the same period, a near-fivefold increase that demonstrates genuine operating leverage rather than growth funded by expanding losses. Return on equity sits at 9.2%.
This is not a speculative story. It is a business with demonstrated earnings power in an attractive niche. The question is whether the price already reflects that.
Hub24’s funds under administration reached $151.7 billion at the March 2026 quarter, already exceeding the company’s own medium-term FUA target of $120-$150 billion by FY28, a data point that complicates the valuation debate because it suggests management guidance may be revised materially upward.
Independent valuation assessments suggest the answer is yes, and then some.
According to Morningstar, Hub24 is approximately 84% overvalued, and the firm does not recognise a sustainable competitive advantage (no economic moat) for the company.
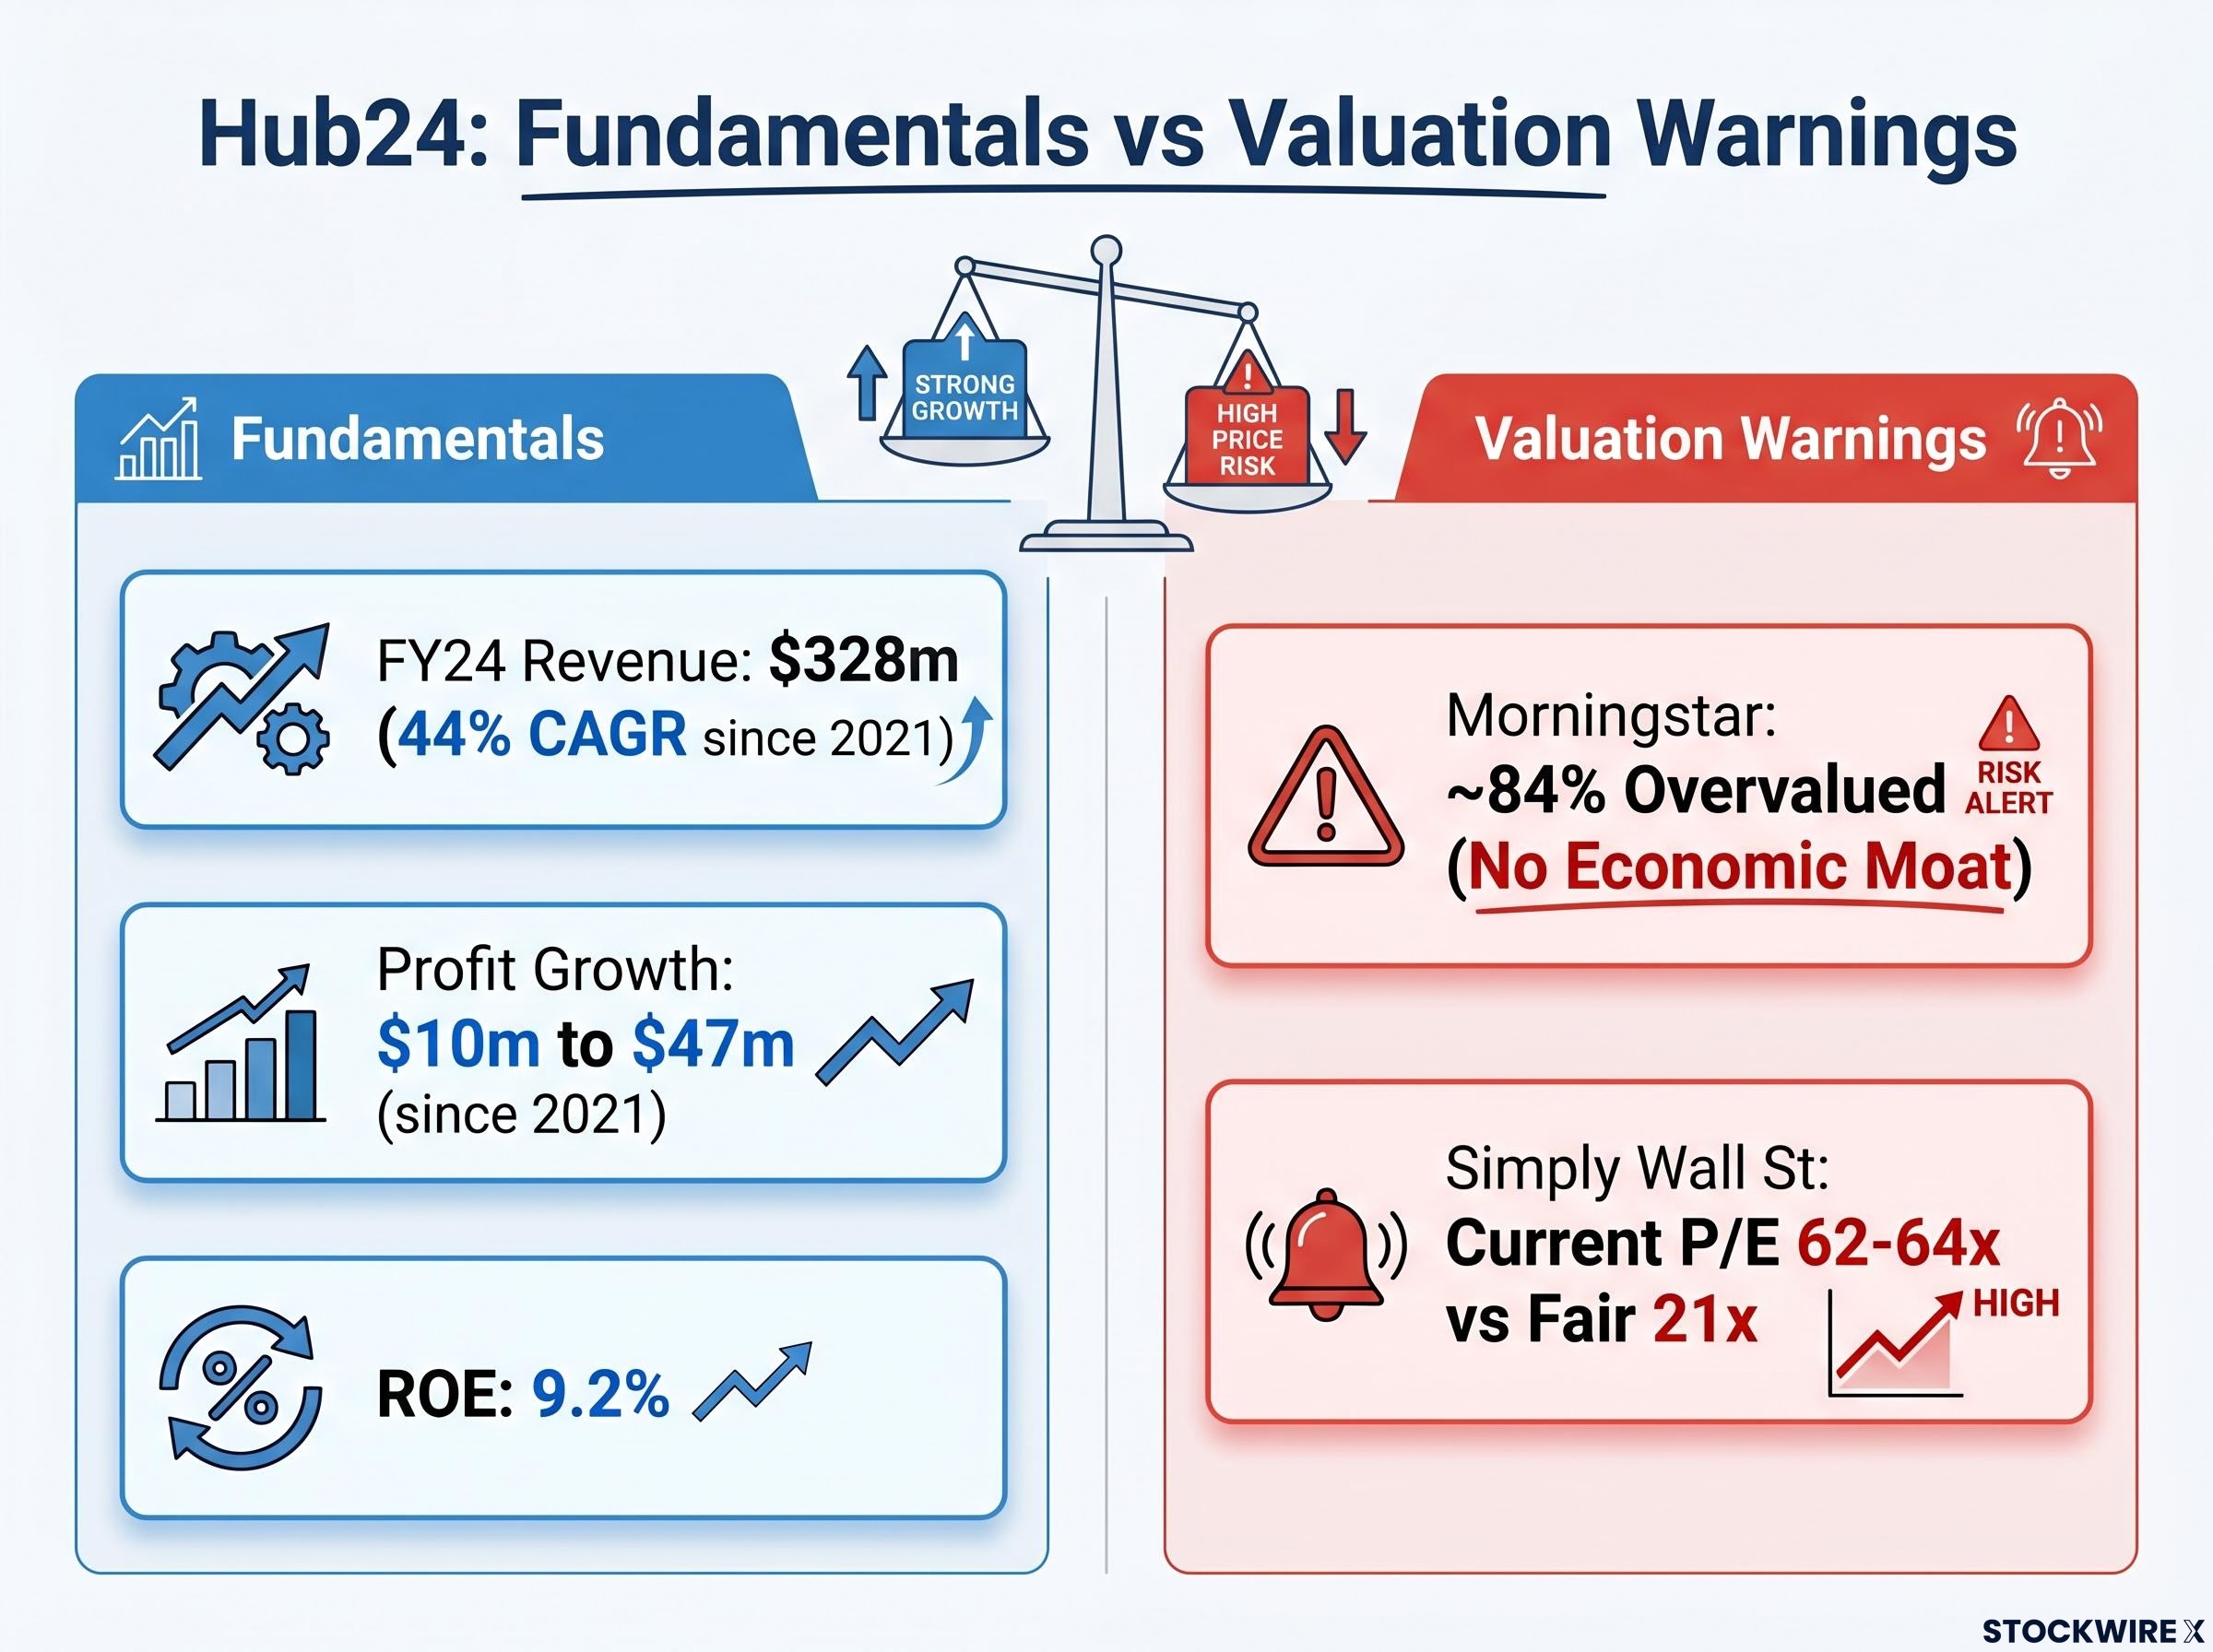
That assessment warrants emphasis. The absence of a recognised durable moat materially affects how much premium is defensible on a long-term discounted cash flow basis.
Two independent views converge on a similar conclusion:
The mechanism of risk here is specific. At 20x+ sales, even a modest deceleration in revenue growth or a broader sentiment shift away from high-multiple tech names can produce outsized price declines without any deterioration in the underlying business. The share price is already down approximately 14.8% since the start of 2025, and the stock remains 53% above its own five-year average P/S.
Multiple compression risk is particularly acute for stocks trading above 20x sales because even a modest deceleration in revenue growth gives the market reason to reassess the discount rate applied to future cash flows, producing outsized price declines that have nothing to do with deterioration in the underlying business.
The quality of a business and the attractiveness of its entry point are different questions. Conflating them is one of the most common and costly errors in growth stock analysis.
Zip Co’s buy-now-pay-later (BNPL) model works in a straightforward way. Consumers acquire goods immediately and repay the cost across multiple interest-free instalments. Zip generates revenue from two primary sources: merchant transaction fees charged to retailers for each transaction processed, and late fees assessed to customers who miss scheduled repayments. The credit and funding risk sits with Zip, not the consumer or merchant, which is why the economics of the model are sensitive to interest rates and default cycles.
The company’s recent history follows a three-stage arc:
Revenue compounded at approximately 76% per year over the three years to FY24, reaching $868m. The swing from a $678m loss to a $6m profit is directionally significant. Return on equity, however, sits at just 1.8%, a figure that underscores how thin the margin for error remains.
Zip’s FY25 earnings result showed net profit after tax of A$79.9 million, roughly 1,110% growth from the $6 million reported in FY24, a step-change that substantially alters the ROE trajectory and the forward earnings picture that underpins the current valuation debate.
Sentiment fragility is the other variable. In February 2026, an earnings miss triggered a 34-39% single-day share price fall, Zip’s worst session in more than a decade. Even after demonstrated operational improvement, the market’s willingness to punish a single disappointment that severely signals how little confidence has been rebuilt.
The core trade-off: Hub24 asks investors to pay up for demonstrated quality and accept valuation risk. Zip Co asks investors to accept model and sentiment risk for potential valuation normalisation.
| Factor | Hub24 (HUB) | Zip Co (ZIP) |
|---|---|---|
| Valuation vs own history | 53% premium to 5-year avg P/S | 28% discount to 5-year avg P/S |
| Business quality indicators | 44% revenue CAGR; $47m profit; 9.2% ROE | 76% revenue CAGR; $6m profit; 1.8% ROE |
| Key risk | Multiple compression on slowing growth | Sentiment fragility; credit and regulatory exposure |
| Bull case condition | Sustained revenue growth with no multiple compression | Continued profitability improvement with credit and regulatory stability |
| Bear case condition | Growth deceleration triggers P/S reversion toward 13x | Earnings miss or regulatory tightening triggers another 30%+ drawdown |
One additional nuance matters for Zip. The five-year average P/S of 5.81x includes the BNPL bubble period, when the market assigned multiples to the sector that may never return. Using that window as a baseline for “normal” could overstate how much discount genuinely exists. Some fund managers have described ZIP as a compelling value opportunity at approximately 12x FY27e P/E after the year-to-date decline. Analyst price targets have been referenced as materially above the current price, though specific consensus figures from sources such as Fintel remain unconfirmed and should be treated as market commentary rather than verified data.
Zip’s Australian rebrand, ordered by the High Court following a successful trademark infringement claim by Firstmac, adds a layer of execution risk to the domestic operations, though with the US business generating approximately 80% of divisional cash earnings, the structural earnings impact is contained.
The February 2026 drawdown of 34-39% on a single earnings miss is the concrete illustration of Zip’s risk profile. That kind of volatility is the price of the potential normalisation trade.
The price-to-sales framework surfaces where each stock sits relative to its own past. It does not determine intrinsic value, and it does not tell investors whether that past was rationally priced.
A more complete assessment would layer on five additional questions:
Return on equity provides one input into that assessment. Hub24’s 9.2% ROE reflects a business generating adequate, if not outstanding, returns on capital deployed. Zip’s 1.8% ROE reflects a business that has only just crossed into profitability, with returns that do not yet compensate for the risk profile.
The same historical P/S framework applied to two businesses in adjacent sectors produces sharply different implications about the risk embedded in today’s price. Hub24 is a high-quality operator whose share price already reflects a great deal of that quality; paying 53% above historical norms requires sustained excellence with no room for deceleration. Zip Co is a high-beta recovery story whose price history may be a less reliable guide than it appears, given the BNPL bubble distortions in the five-year average.
The P/S comparison is the starting point, not the conclusion. The quality of any forward decision depends on the additional questions this analysis surfaces, particularly around growth durability, balance sheet risk, and how much optimism or pessimism is already embedded in the price.
This article is for informational purposes only and should not be considered financial advice. Investors should conduct their own research and consult with financial professionals before making investment decisions. Past performance does not guarantee future results. Financial projections are subject to market conditions and various risk factors.
The price-to-sales ratio divides a company's market capitalisation by its annual revenue, stripping out earnings volatility that can distort comparisons for growth-stage companies. For Hub24 and Zip Co, it reveals that HUB trades at 20.36x sales (53% above its five-year average) while ZIP trades at 4.18x sales (28% below its five-year average), making the gap between the two stocks unusually stark.
Hub24 is down approximately 14.8% since the start of 2025, most likely reflecting multiple compression pressure rather than any deterioration in the underlying business. At over 20x sales, even a modest sentiment shift away from high-multiple growth names can produce outsized price declines, and independent assessments from Morningstar suggest the stock may be approximately 84% overvalued relative to its intrinsic value.
Zip Co restructured its operations after a severe collapse caused by rising interest rates, investor scepticism toward buy-now-pay-later models, and operational overextension. The company streamlined its business and returned to profitability, posting a $6 million net profit in FY24, with FY25 results showing net profit after tax of A$79.9 million, representing approximately 1,110% growth from the prior year.
The primary risk is multiple compression: at 20x-plus sales with no recognised economic moat according to Morningstar, even a modest deceleration in Hub24's revenue growth could give the market reason to reassess the premium it applies, producing significant share price declines that have nothing to do with any deterioration in the actual business.
Zip Co's five-year average P/S of 5.81x includes the BNPL bubble period when the sector commanded inflated multiples that may never return, meaning the apparent 28% discount to historical norms could overstate how cheap the stock genuinely is relative to a more sustainable baseline valuation.