A 4% one-day drop feels like proof that you should have been hedged. The numbers suggest otherwise. A roughly 20-delta SPY put bought every trading day for six years lost money on the large majority of trades, which makes hedging SPY with puts a far more expensive habit than the panic suggests.
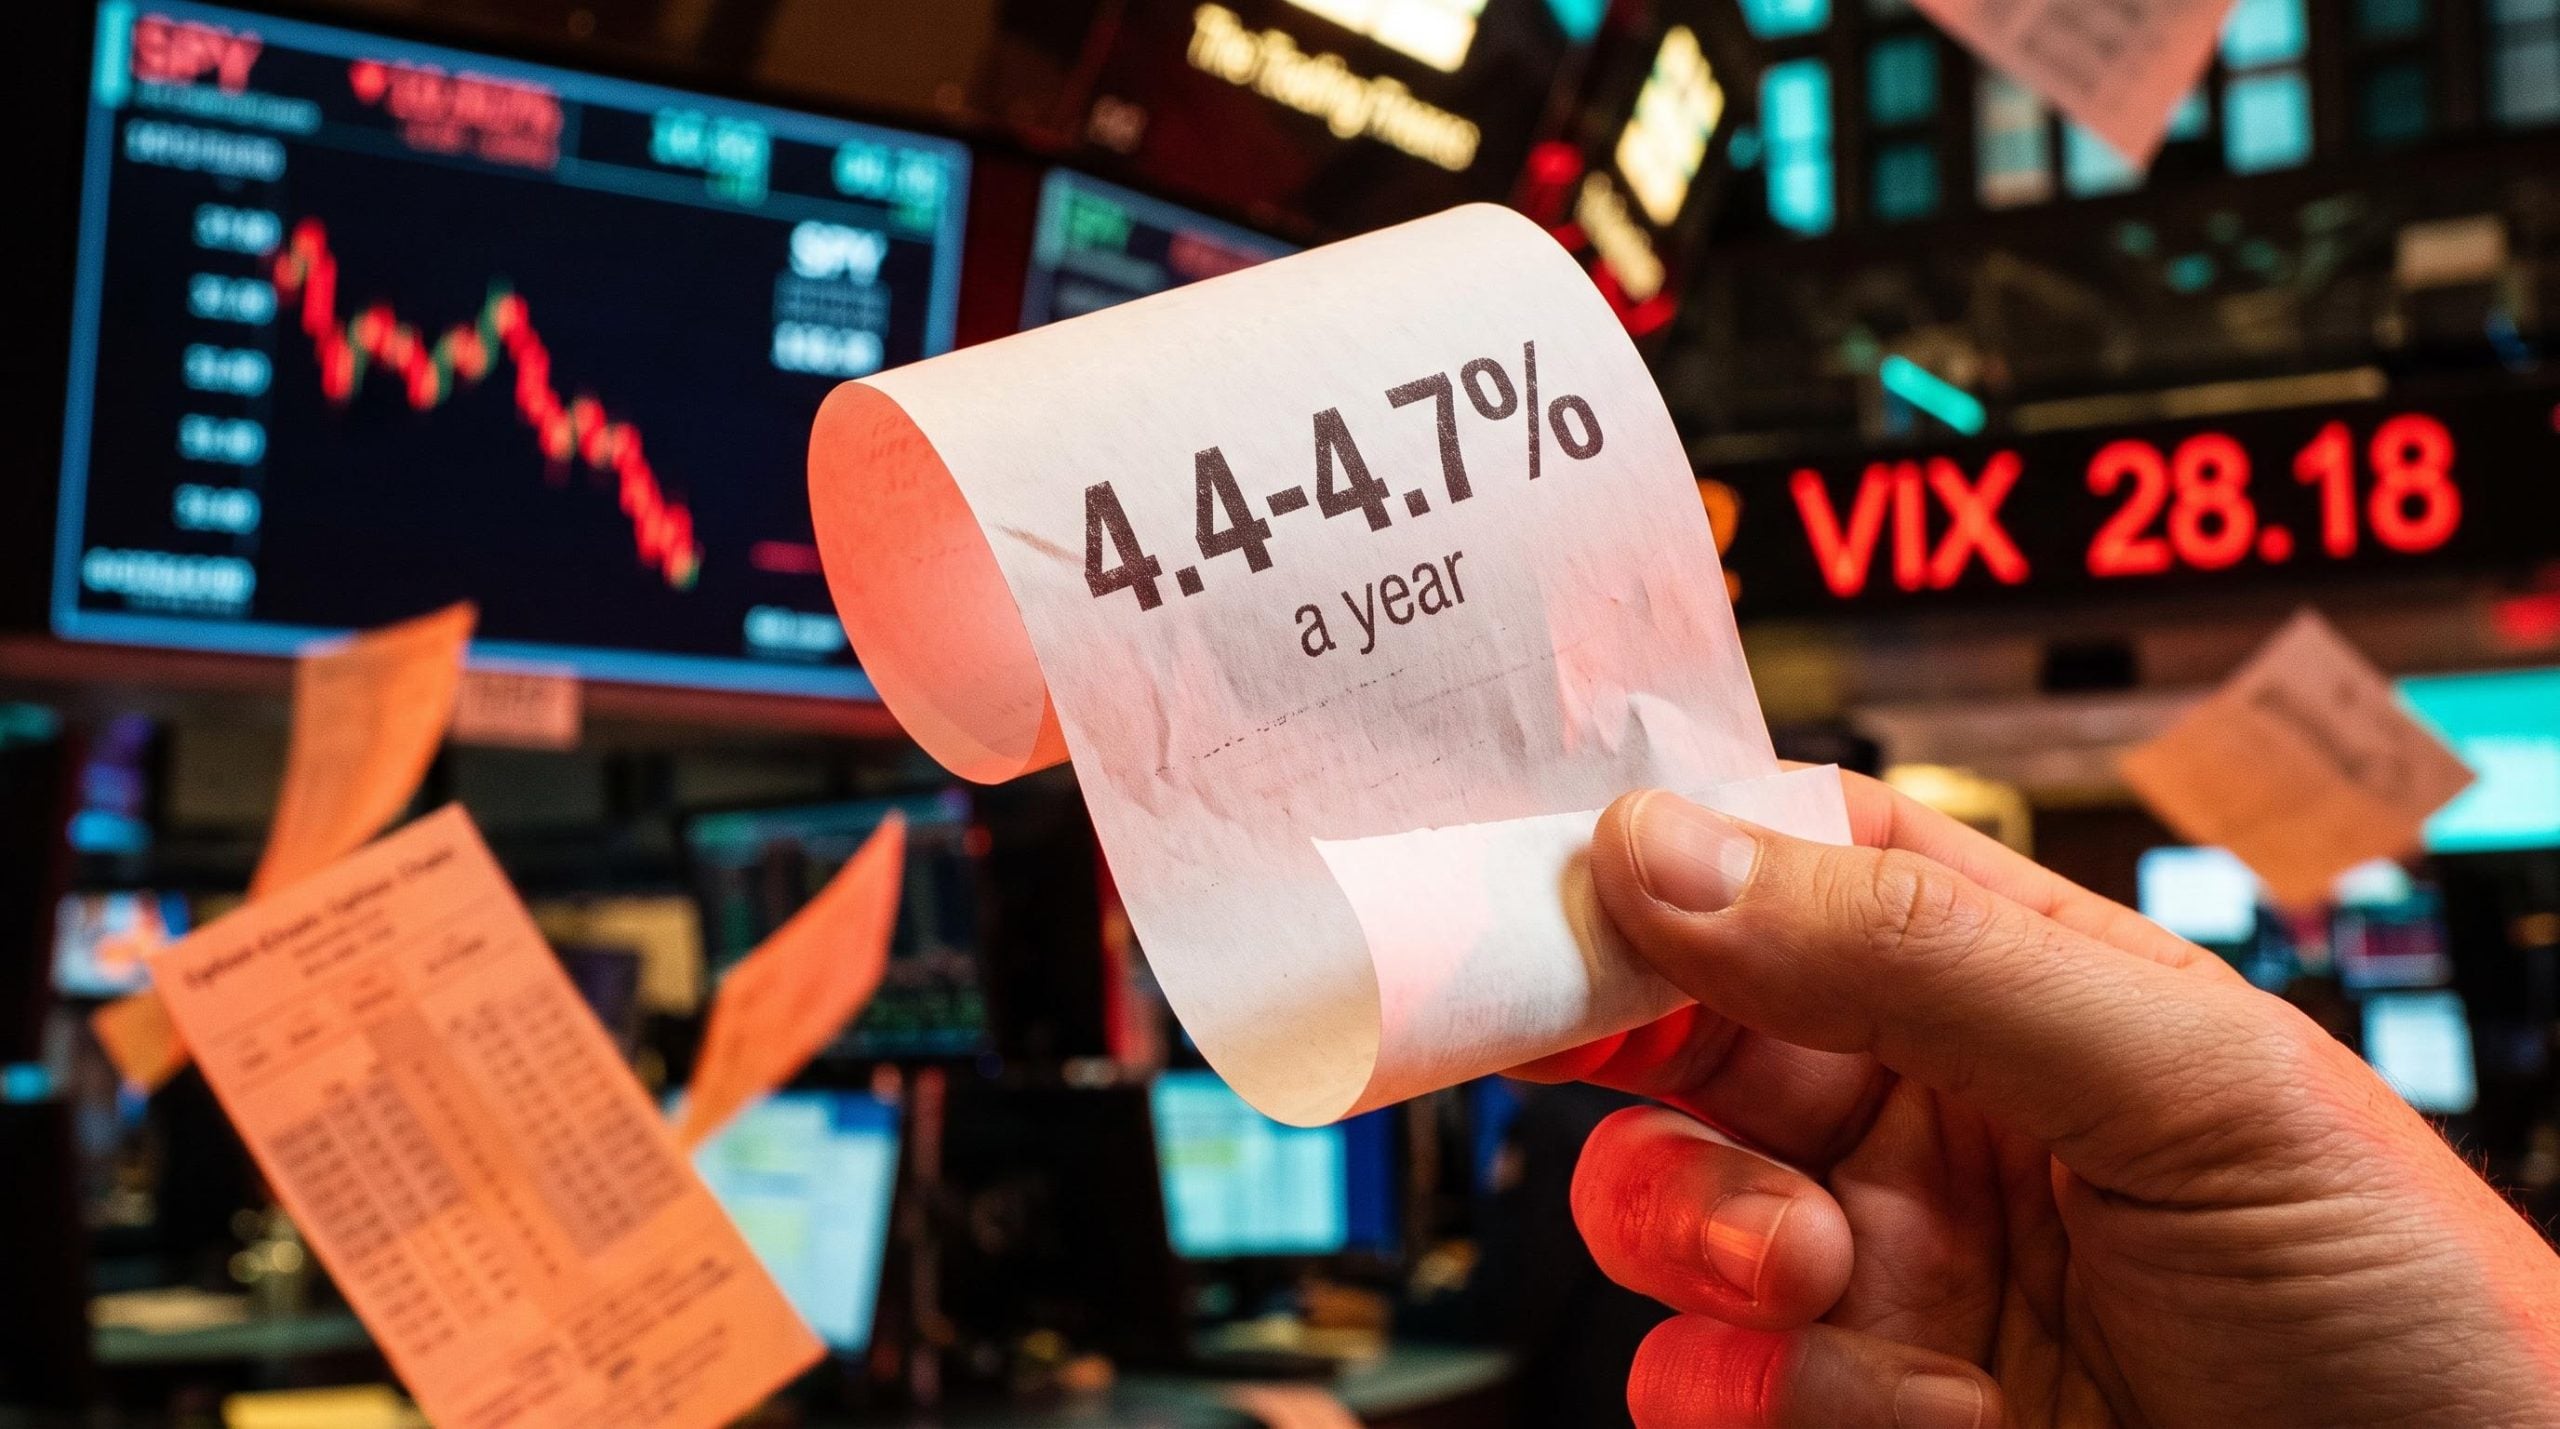
The scare was real. The S&P 500 fell 4.36% on 5 November 2026, SPY dropped about 4.41%, and the Cboe Volatility Index (VIX), a gauge of the market’s expected volatility, jumped from 16.61 to 28.18. Days like that are when stock owners start shopping for insurance.
Yet by 9 November, SPY had climbed back to $752.69, up from about $733.00 at the 5 November close. Anyone who rushed into protection last week paid peak prices for a fall that had already happened.
Here is what six years of daily put buying shows about what protection really costs, and when it is worth paying for.
What a six-year backtest of daily 20-delta SPY puts actually found
The test was simple. Each trading day, the presenter bought one SPY put with a delta of about 20, which meant a strike roughly 5-6% below the market price and up to 45 days to expiry. Delta measures how much an option’s price moves for each $1 move in the underlying, and a 20-delta put sits well below the current price.
That produced about 1,400 trades. Each was tested two ways: held to expiry, or closed early at 21 days to expiry (DTE).
Held to expiry, the average put lost about $3,994. Only about 7% of trades made money.
Managing at 21 DTE helped. The average loss shrank to a bit over $200, and the share of winners rose to about 19%. But the overall bill barely moved.
| Metric | Held to expiration | Managed at 21 DTE |
|---|---|---|
| Average loss per put | About $3,994 | A bit over $200 |
| Share of winning trades | About 7% | About 19% |
| Annual cost (share of stock value) | About 4.4% | About 4.7% |
The annual drag came to about 4.4% of stock value unmanaged and about 4.7% managed. Smaller losses per trade did not translate into a cheaper programme.
The hit rate Between 7% and 19% of puts paid off. The rest expired worthless or were closed at a loss.
The rare winners show why. SPY slid from 695 on 9 February to 634 on 27 March, and a put bought on 9 February earned about $2,100. Puts bought a few weeks later, after the fall had begun, captured far less.
What this tells you is that insurance bought on a schedule pays only when a crash happens to land inside the option’s life. If you run this programme, expect a long string of small losses punctuated by the occasional rescue.
When big ASX news breaks, our subscribers know first
Married puts, puts alone and buy-and-hold: where does the money go?
Puts on their own look alarming. Bought without any shares, the put programme finished about $13,000 in the red, winning on roughly 7% of trades, with a worst single trade of about -$1,800.
Pair each put with 100 SPY shares, a structure called a married put, and the picture brightens. The combined position ended about $25,000 ahead and made money on roughly 61% of trades.
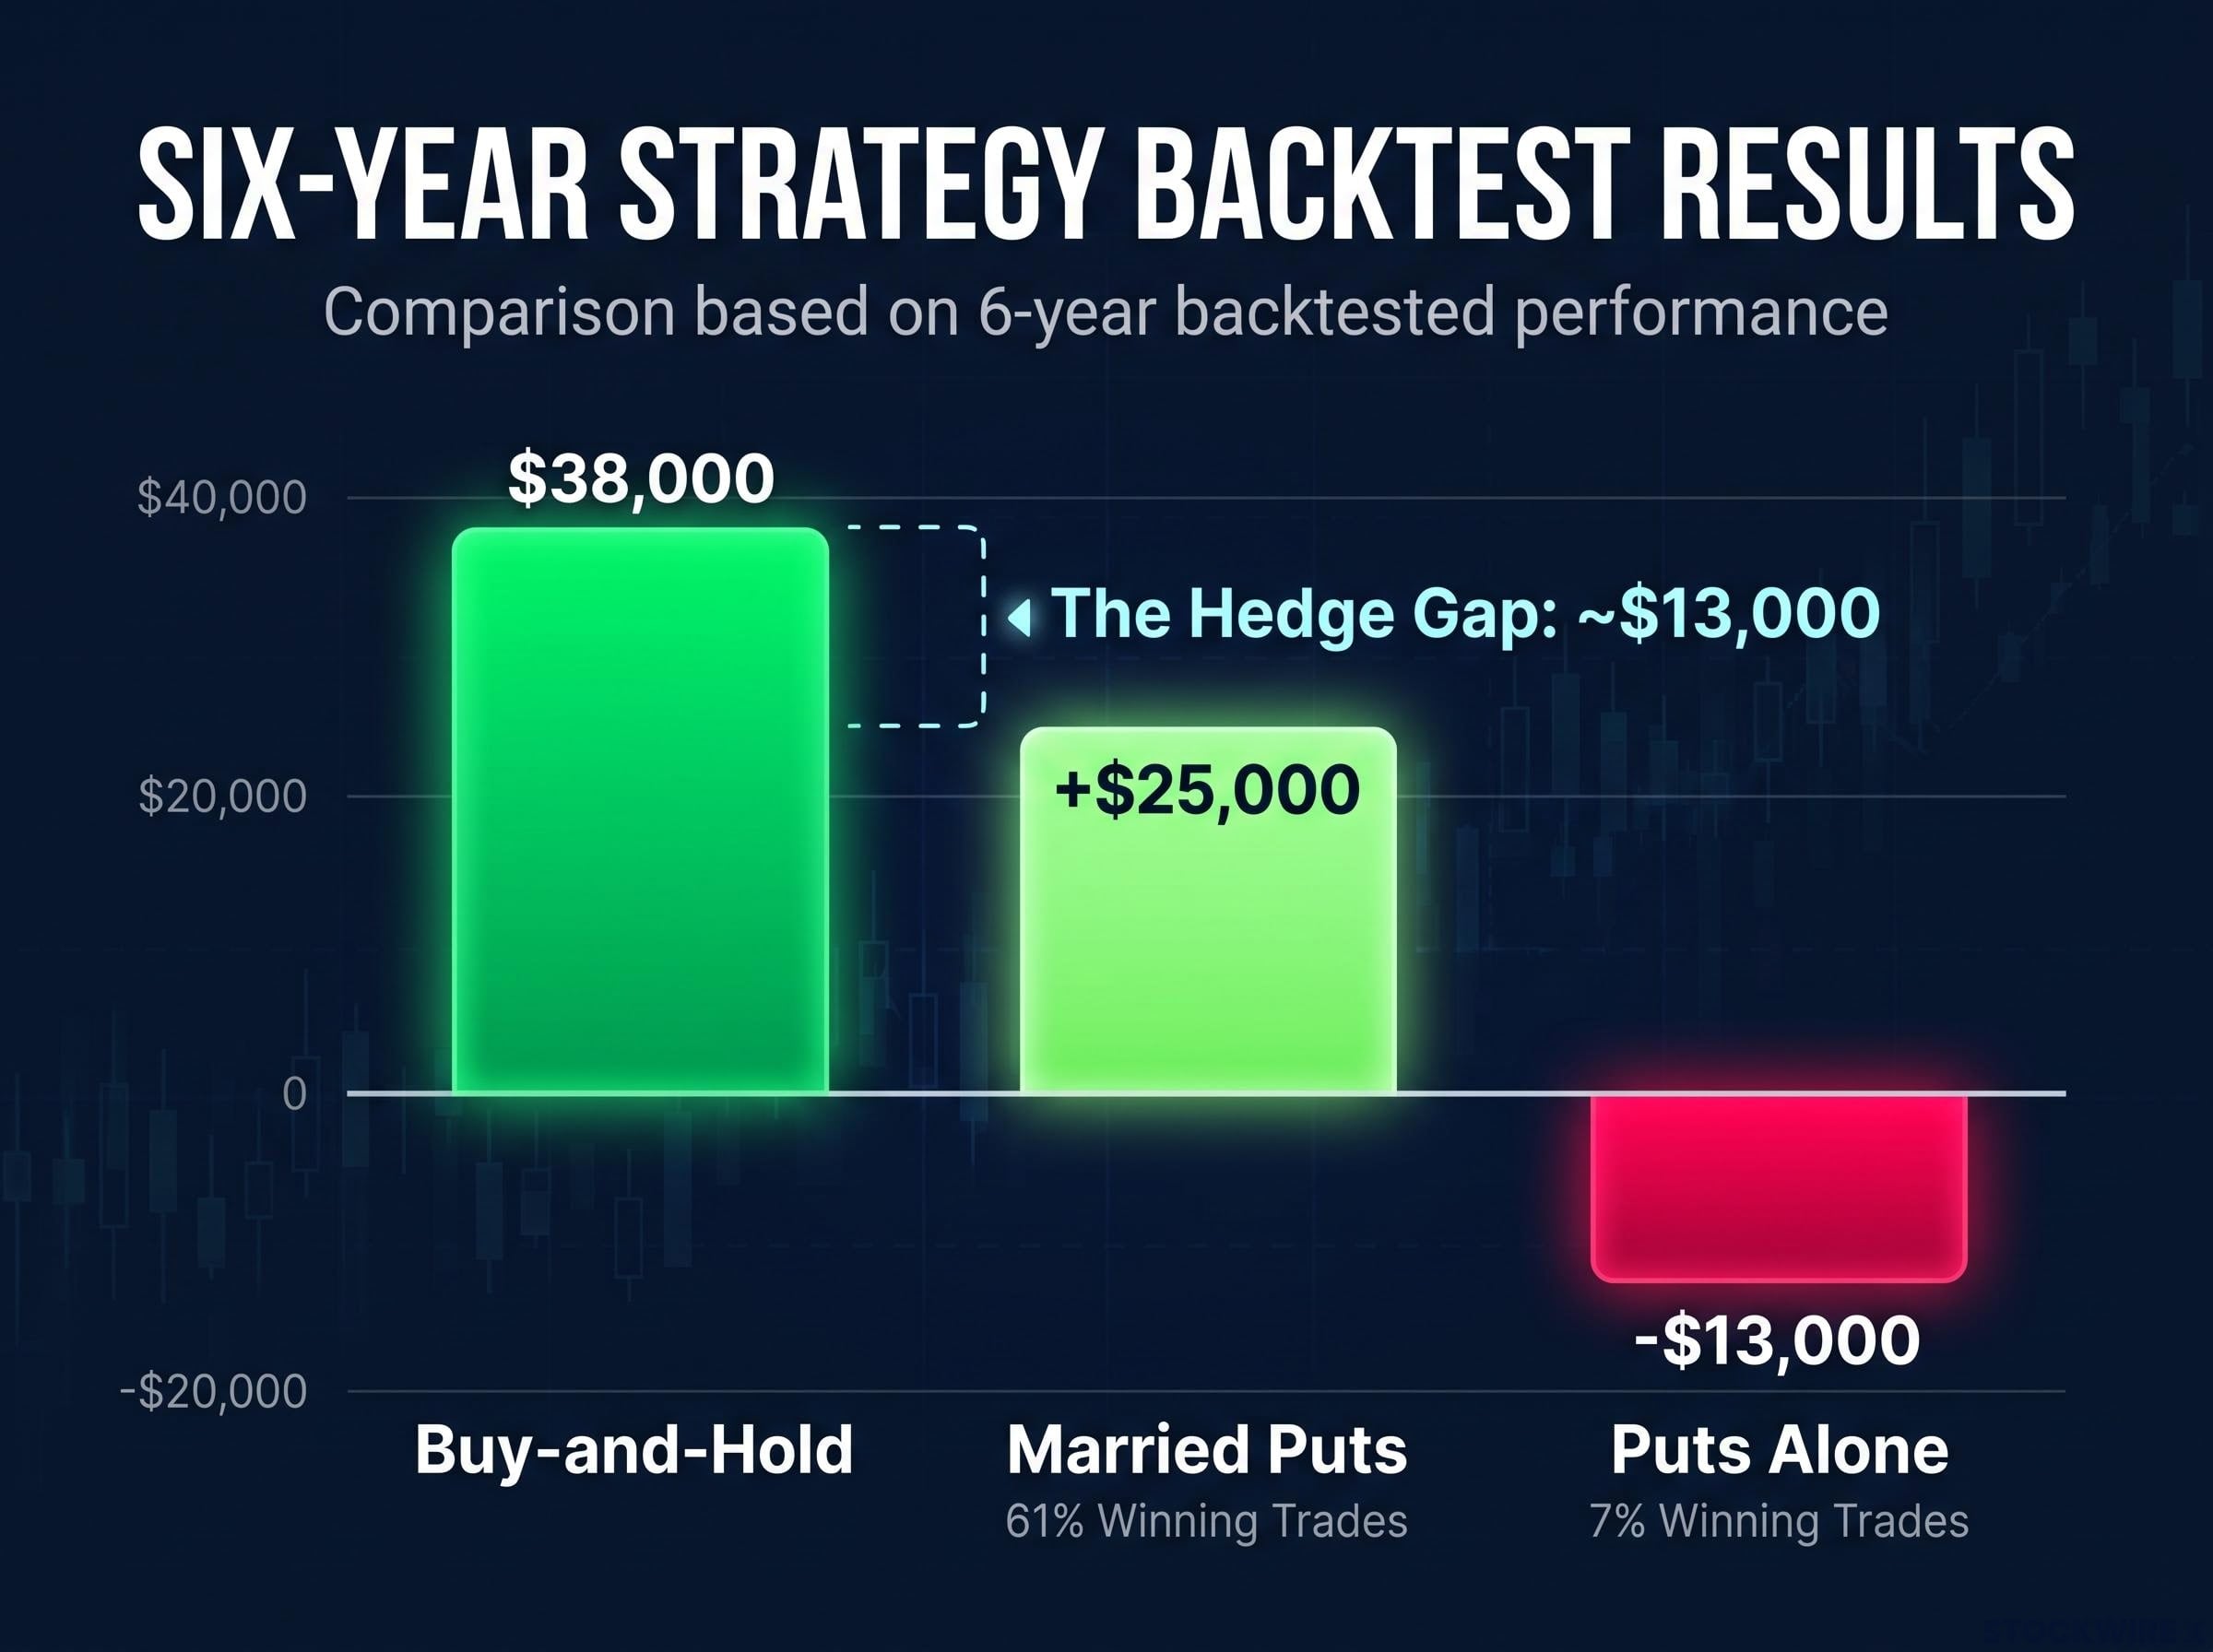
A six-year backtest shows a ~$13,000 hedge gap between the $38,000 buy-and-hold profit and the +$25,000 married puts return.
| Strategy | Ending profit | Winning trades | Worst single trade |
|---|---|---|---|
| Puts alone | About -$13,000 | About 7% | About -$1,800 |
| Married puts | About +$25,000 | About 61% | About -$4,600 |
| Buy-and-hold | About $38,000 | Not reported | Not reported |
Then comes the comparison that matters. Simply holding the shares earned about $38,000, so married puts kept roughly 66% of buy-and-hold profit.
The gap, about $13,000, is the price of the hedge. It was almost identical for the unmanaged and managed versions.
For a long-term holder, giving up roughly one-third of profit means the hedge behaves like a recurring bill, not a source of return. You are paying for a smoother ride, and the invoice arrives every year.
What happens in a 20% drop versus a flat market
The trade-off becomes clearer across three scenarios:
- Stock falls 20%: the married put lost about 6.4%, saving roughly 13.6 percentage points.
- Flat market: the hedge cost about 0.85-0.885%, with nothing to show for it.
- Stock rises 10%: the same 0.85-0.885% cost applied, trimming the gain.
The protection also shrank the worst outcomes. Worst-trade losses fell about 56-57% unmanaged and about 40-45% with management.
That is the deal in plain terms. A real crash makes the hedge look brilliant, but most periods are not crashes, and the steady toll is what compounds against you.
Why do systematic puts lose? The mechanics behind the 4.4-4.7% drag
You already know the bill: roughly 4.4-4.7% a year. Four forces explain where it comes from.
- Volatility risk premium. This is the gap between the volatility option prices imply and the volatility that actually follows. According to Endowus, implied volatility averaged 19.3% from 1990 to 2018, while realised volatility averaged about 15.1%, a premium of about 4 points.
- Theta decay. Theta is the value an option loses each day as expiry approaches. A rolling programme pays it again and again.
- Downside skew. Skew describes how out-of-the-money puts carry higher implied volatility than at-the-money options. That makes a 20-delta put dearer than a plain volatility estimate would suggest.
- Path dependence. The outcome depends on when the fall happens, not just whether it happens. A rolling programme cannot know which cycle will hold the crash.
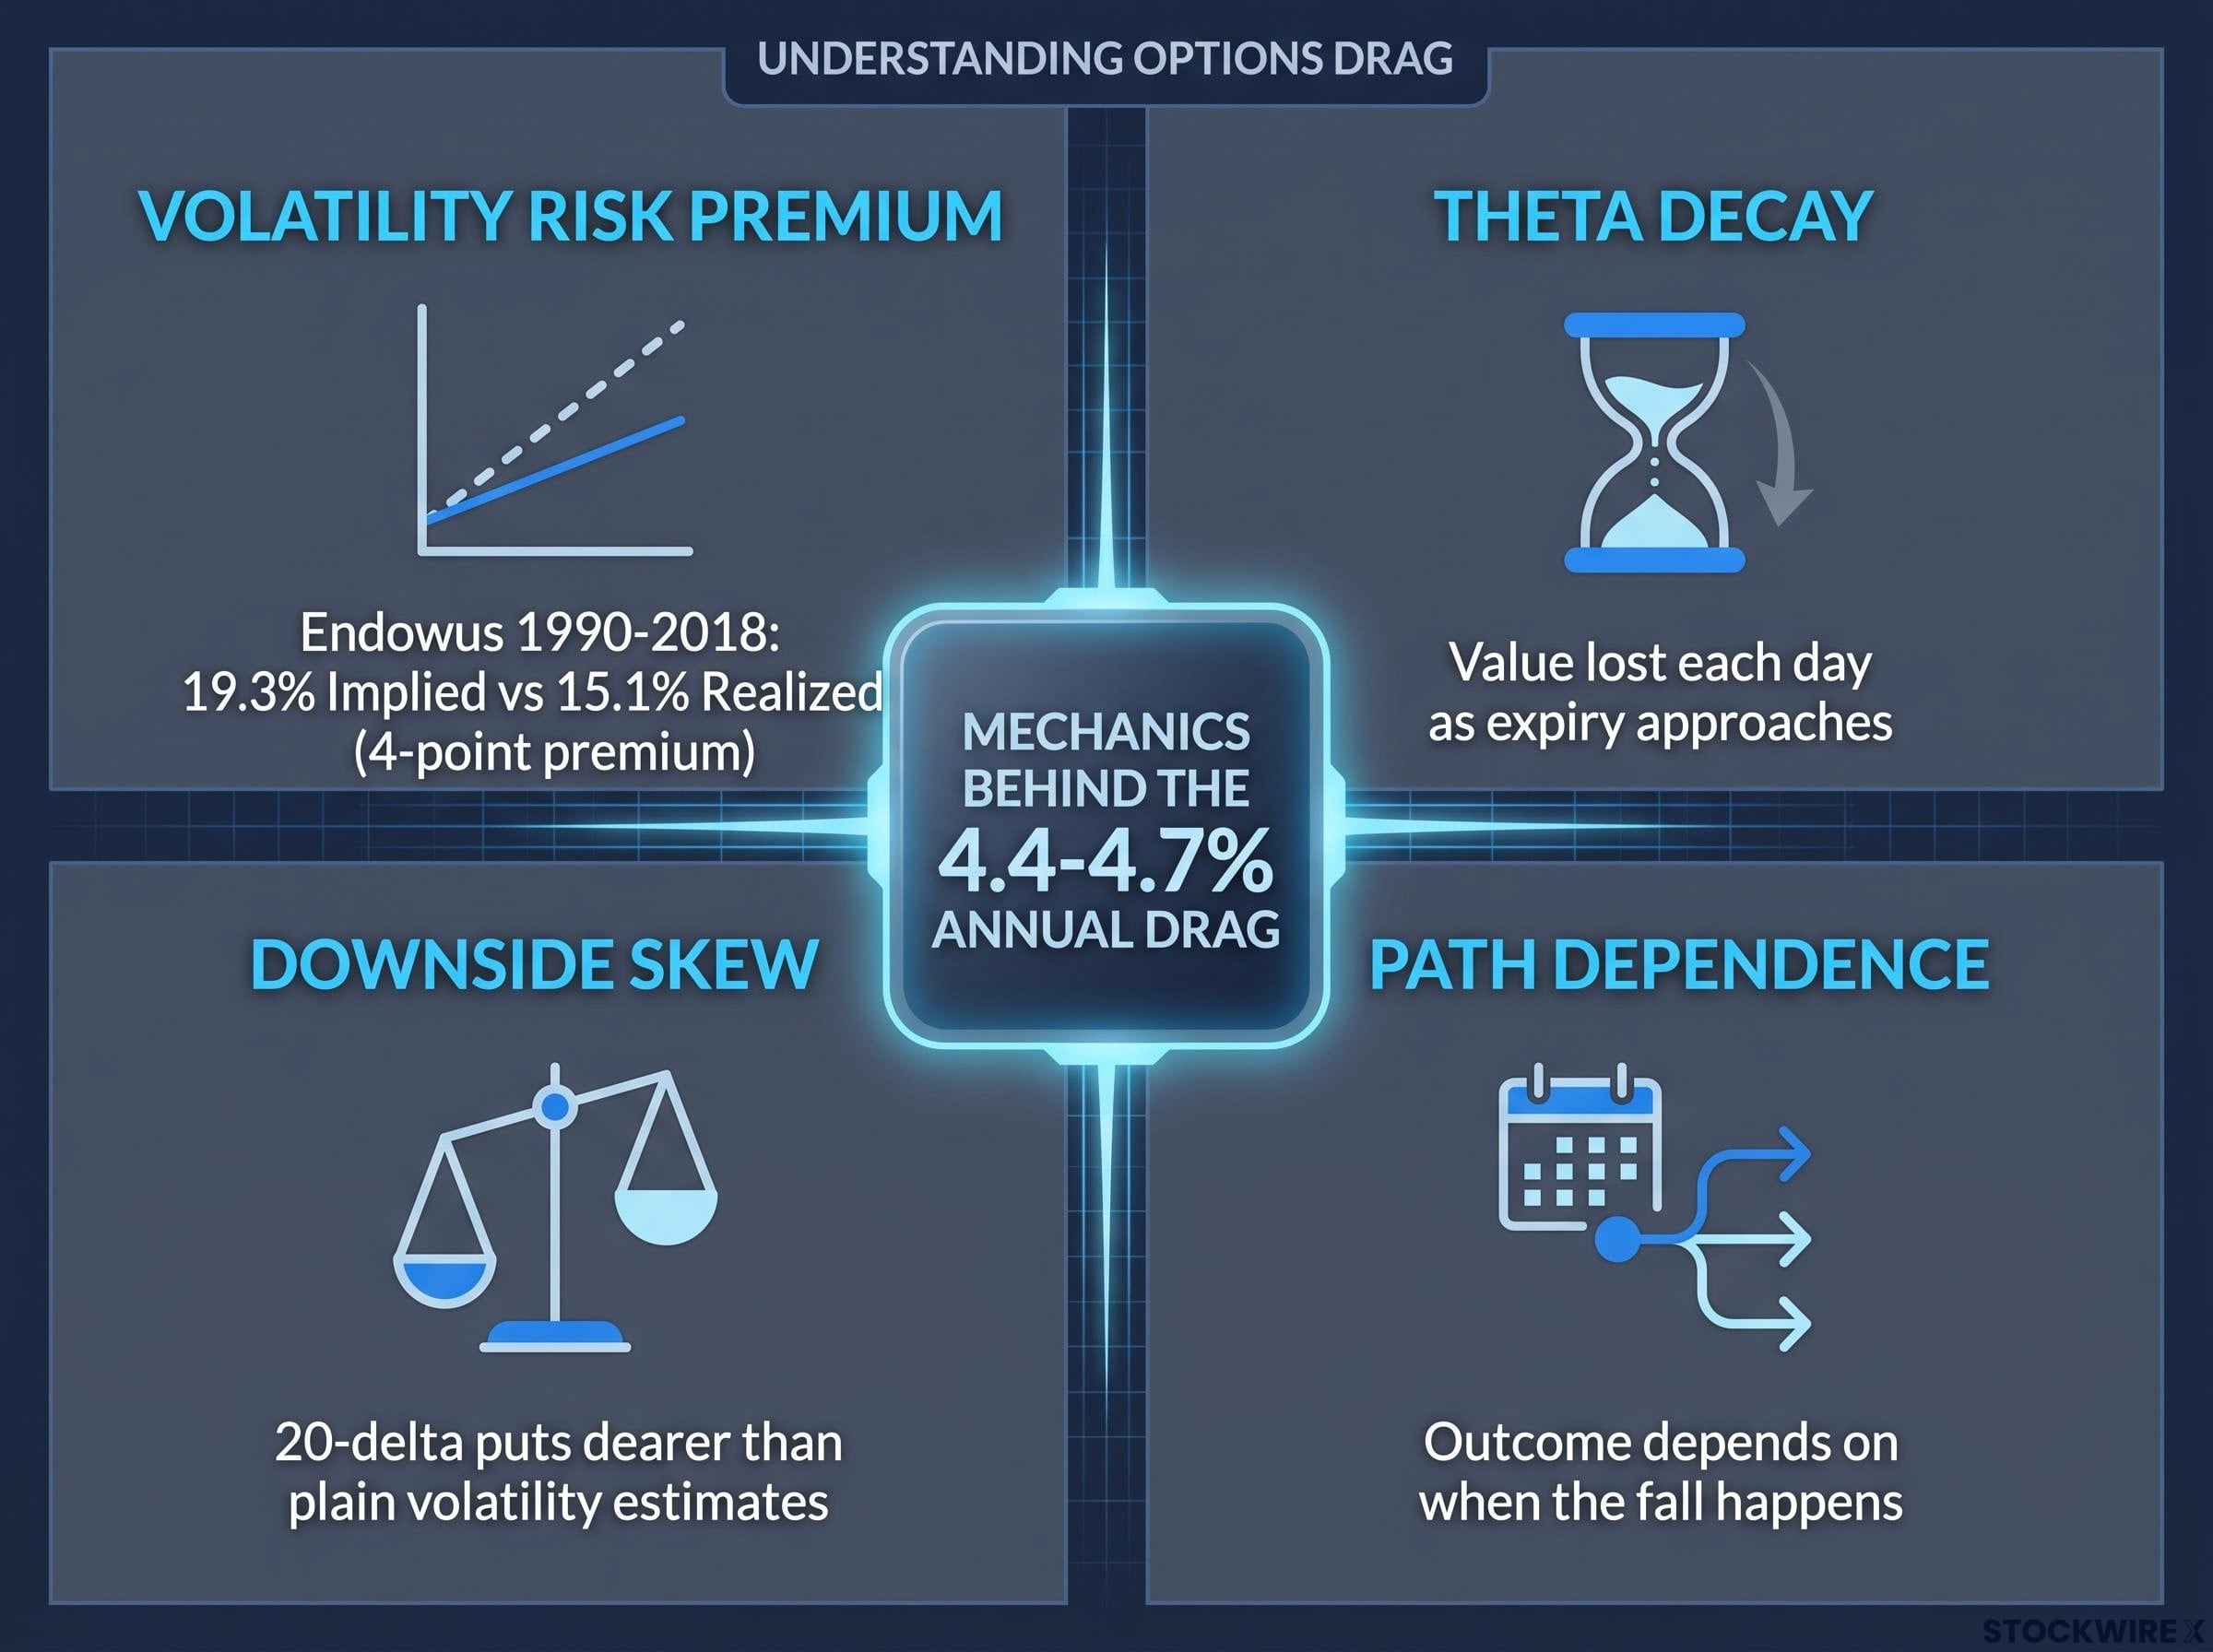
The 4.4-4.7% annual options drag is driven by four forces, including a 4-point volatility risk premium from 1990-2018.
The backtest is no outlier. Long-run studies of protective puts land in the same territory.
| Source | Period | Finding |
|---|---|---|
| Endowus (Cboe-style strategy) | June 1986 to Dec 2018 | 6.64% a year versus 9.80% for the S&P 500 |
| AQR (via Endowus) | 1996-2016 | Rolling 5% OTM monthly put cut excess return from 5.1% to 1.8% |
| Cboe PPUT benchmark | Q1 2020 and Q4 2008 | 0.0% versus -19.6%; +0.2% versus -21.9% |
| AQR | 2022 to 30 Sep | PPUT returned -20.8% |
Cboe’s PPUT index combines the S&P 500 with a monthly put 5% out of the money (OTM). Cboe describes it as a benchmark rather than an investable record. It shines in sudden collapses like 2008 and 2020, yet the 2022 figure shows that a slow, grinding decline still left holders deep in the red.
Because this premium is structural, you should expect to pay it in calm years. The payoff tends to arrive only in fast, severe declines.
Why buying after the spike costs more
Last week offered a live demonstration. As the VIX leapt from 16.61 to 28.18 on 5 November, implied volatility and skew rose together.
That lifted the value of puts investors already owned. It also made new protection pricey: a SPY 30 November 740-strike put closed around $16.91 that day.
The lesson is uncomfortable but useful. Protection is cheapest when nobody wants it, and dearest the moment you do.
Hedge only what you cannot tolerate: cheaper alternatives and a decision rule
So the question shifts from “should I hedge?” to “which risk am I actually trying to remove?” The answer points toward options that cost less than a permanent put overlay.
| Approach | Advantage | Limitation |
|---|---|---|
| Collar | Call premium finances part or all of the put | Upside capped; assignment risk |
| Put spread | Lower premium | No protection below the short strike |
| Tail-risk fund | No personal option rolling | Fees and long negative stretches |
| Covered calls | Premium offsets some cost | Not true crash insurance; sacrifices upside |
| Own less equity | No premium or time decay | Gives up some equity returns |
| Rebalance after declines | Keeps the risk budget; buys lower | Needs cash and discipline; no crash payoff |
Fidelity and Charles Schwab both describe collars as a way to cut net hedging cost, at the price of capped gains. Schwab also points out that a protective put’s premium becomes a real loss if the expected fall never comes.
There is a fair counterargument. Maximising average return is not the same as maximising what an investor can live with, and Cboe’s data show PPUT delivering real value in quarters such as 2008 and 2020.
If a 30-50% drawdown would force you to sell or wreck your spending plans, paying roughly 4-5% a year may be rational. Otherwise, trimming your equity is the cheaper fix.
The principle Hedge only the risks you cannot tolerate. For everyday risk, own less stock.
A simple decision rule
Before buying protection, answer three questions:
- Can you tolerate the loss? If a deep drawdown is survivable, the premium is probably wasted.
- Do you need the money soon? Near-term spending needs raise the case for protection.
- Would you sell at the bottom? If yes, a hedge or a smaller equity position may keep you invested.
If you answer no, no and no, the backtest suggests your best hedge is simply holding less stock.
What to remember the next time the VIX jumps
Continuous 20-delta puts are insurance, not a way to beat the market. The six-year backtest put their cost at about 4.4-4.7% a year, and studies from Cboe and AQR point to a similar multi-point drag over decades.
Timing drives the economics. Protection bought after a spike, as on 5 November, carries the highest price, so the decision belongs before fear arrives rather than after.
Set your risk budget while markets are calm. Decide how much decline you can genuinely absorb, then size your equity exposure or a targeted hedge to match, so the next red day calls for no frantic purchase at all.
This article is for informational purposes only and should not be considered financial advice. Investors should conduct their own research and consult with financial professionals before making investment decisions.