Two semiconductor stocks, both wrapped in bullish analyst coverage, both riding the same AI infrastructure wave. One trades above every scenario in an independent valuation model. The other sits at more than double its model’s midpoint estimate.
Broadcom and KLA are two of the most-discussed names in AI semiconductors, and both have earned meaningful price-target upgrades through 2026. But the strategic question is not whether these are good businesses. It is whether they are good investments at current prices, because business quality and investment quality are not the same thing.
Here is a clear framework for separating the two. By the time you finish this, you will know exactly how each company makes money, what the numbers say about each stock’s price relative to independent valuation models, and where the specific risks sit for each one.
Two companies, two very different ways to profit from AI chips
Comparing Broadcom and KLA is not comparing apples to apples. It is comparing two entirely different positions in the same supply chain, each with its own exposure profile. One sells into the hyperscalers building AI data centres. The other sells to the chipmakers who must inspect every wafer they produce, no matter whose chip it becomes.
Here are the two revenue profiles side by side:
- Broadcom: Custom AI chips and networking ASICs on the semiconductor side, plus infrastructure software at roughly 30% of total revenue. Revenue tracks hyperscaler spending decisions.
- KLA: Inspection and metrology equipment used at every major fabrication node, with roughly 25% of revenue from recurring service contracts. Revenue tracks chipmaker factory investment cycles.
Broadcom: infrastructure-scale AI with a software cushion
Broadcom is a broad participant in the AI buildout rather than a single-product company. Its custom chips and networking ASICs connect large-scale AI data centres, while its infrastructure software segment grows at approximately 30% independently and adds stability to the overall revenue mix.
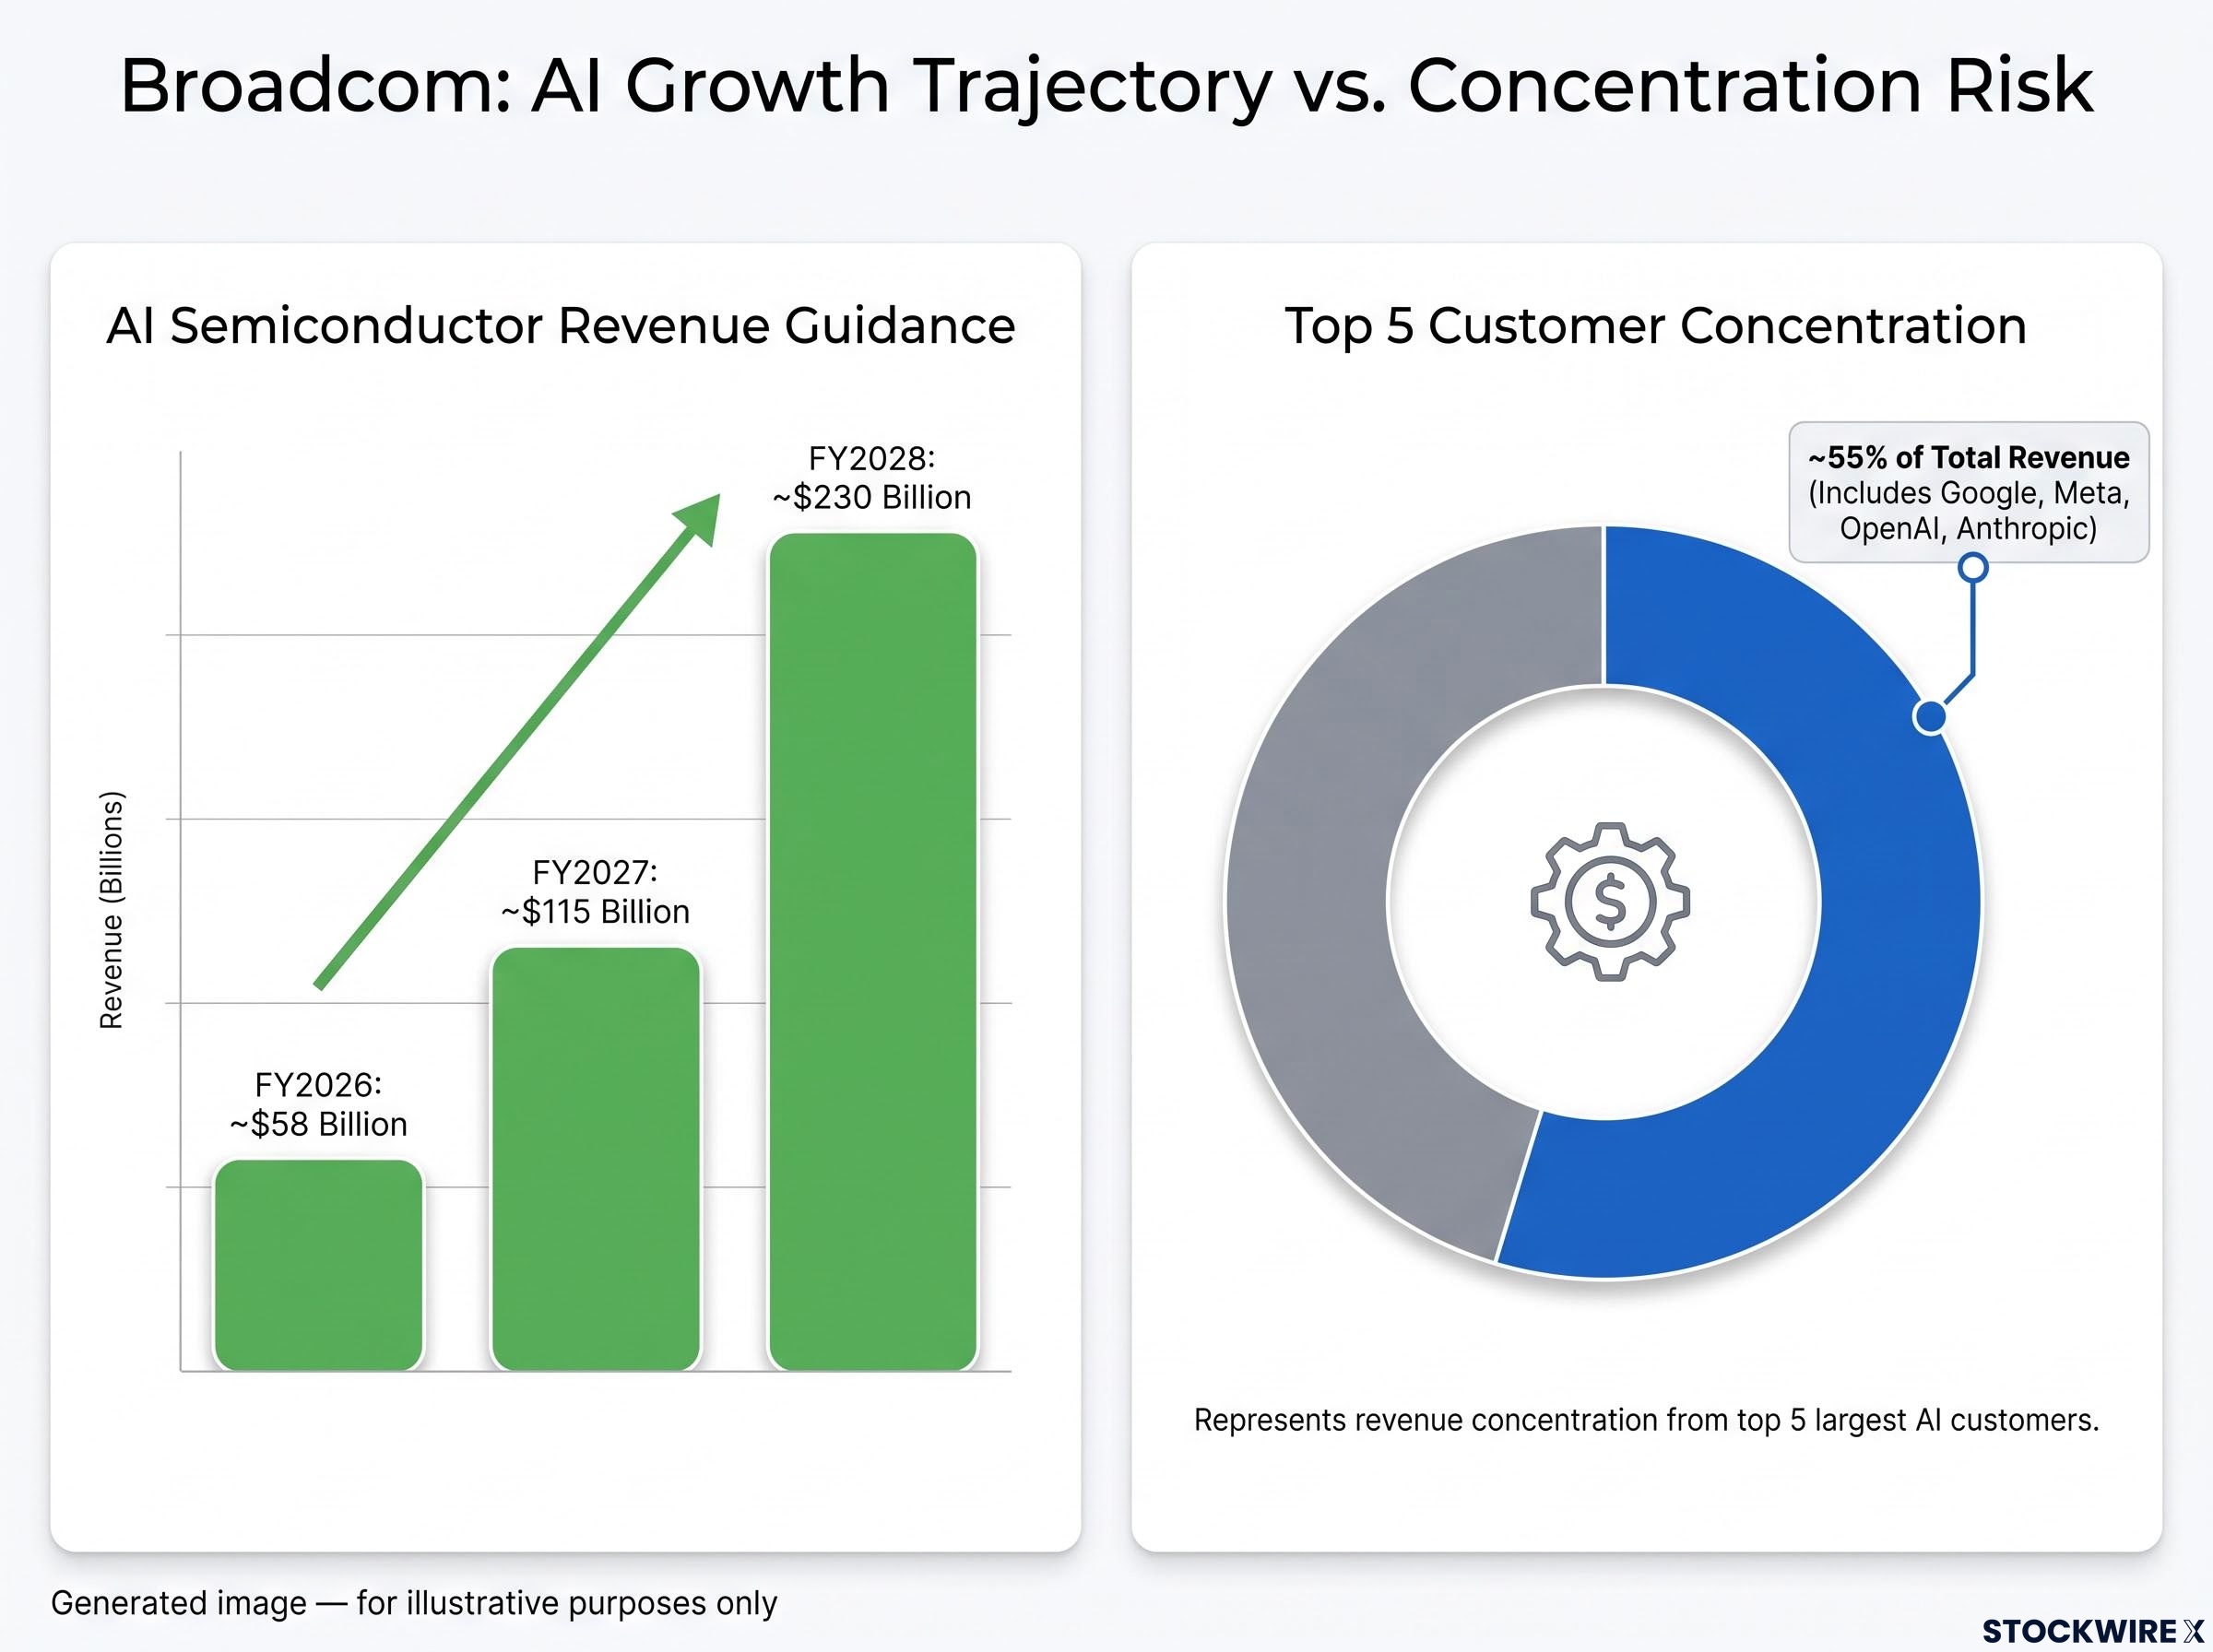
The dependency sits with a handful of very large customers. Broadcom’s top five, understood to include Google, Meta, OpenAI, and Anthropic, account for roughly 55% of total revenue. That concentration is why Broadcom’s top line rises and falls with hyperscaler capex decisions, a dynamic that cuts both ways.
KLA: process-control niche with a recurring-revenue floor
KLA occupies a narrow but entrenched position in process control: detecting microscopic defects in semiconductor wafers during production. Its inspection and metrology tools, which measure and verify chip dimensions and quality, sit at every major node in the manufacturing process.
The niche is structurally difficult to replicate, combining specialised hardware, proprietary algorithms, and decades of process data accumulated across a large installed base. That installed base also generates recurring service revenue, roughly 25% of the total, giving KLA a subscription-like floor through equipment downturns. The company repurchased approximately 12% of outstanding shares over the prior five years, a capital-return signal that it views its own stock as worth owning.
The structural contrast matters for how you read risk. A hyperscaler spending pause would hit Broadcom directly and KLA only indirectly, while an export-control escalation would hit KLA’s China revenue acutely and leave Broadcom largely untouched.
When big ASX news breaks, our subscribers know first
What the financials actually show about each business
Start with Broadcom’s most recent quarter, which forms the foundation of the bull case. In Q3 FY2026, released 2 September 2026, Broadcom reported total revenue of $29.6 billion, up roughly 86% year-over-year. AI semiconductor revenue reached $16.7 billion, about 56% of the total, and grew 221% year-over-year.
Non-GAAP earnings per share came in at $3.32, beating consensus of $3.24, with Q4 FY2026 revenue guidance of approximately $34.8 billion. Free cash flow is approaching $40 billion annually against net debt of roughly $70 billion.
Broadcom’s Q3 FY2026 10-Q filing with the SEC confirms the $29.6 billion revenue figure, the non-GAAP EPS of $3.32, and the forward guidance underpinning the bull case that analysts have been pricing into their targets.
Then there is the forward guidance, which is where the scale of the bull case becomes clear.
Management raised FY2026 AI semiconductor revenue guidance to approximately $58 billion, with a multi-year trajectory of roughly $115 billion in FY2027 and $230 billion in FY2028.
KLA tells a quieter story on headline growth but a sharper one on efficiency. In Q4 FY2025, released 31 July 2025, it reported revenue of $3.175 billion, GAAP net income of $1.203 billion, and free cash flow of $1.065 billion, a record quarterly figure.
Where KLA separates itself is return on capital, a measure of how efficiently a company turns invested money into profit. KLA averaged approximately 40% over five years and 37% in the most recent year, with a net profit margin around 35%. Analysts project its EPS nearly doubling from roughly $550 to $1,015 over four years.
Sit with the efficiency gap for a moment before drawing a conclusion.
Return on capital is the metric that most sharply separates KLA from Broadcom in this comparison: KLA’s five-year average of 40% against Broadcom’s 17.4% signals that KLA converts each invested dollar into profit more efficiently, even though Broadcom’s raw growth trajectory produces a larger absolute earnings base.
| Metric | Broadcom (AVGO) | KLA (KLAC) |
|---|---|---|
| Most recent quarterly revenue | $29.6B (Q3 FY26) | $3.175B (Q4 FY25) |
| YoY revenue growth | ~86% | Double-digit (projected) |
| Return on capital (5-yr avg) | ~17.4% | ~40% |
| Net profit margin (latest year) | ~43% | ~35% |
| Free cash flow (annual) | ~$40B | ~$4B |
KLA’s 40% return on capital against Broadcom’s 17.4% tells you KLA converts investment into profit more efficiently. But Broadcom’s growth rate is so far ahead that the raw scale of its earnings trajectory keeps the comparison genuinely ambiguous rather than settled. Neither business is weak, which is precisely why the valuation question matters.
Valuation versus price: where the independent models diverge from Wall Street
This is where the analysis earns its weight. The gap worth watching is not between Broadcom and KLA. It is between what independent valuation models say these stocks are worth and what Wall Street is targeting.
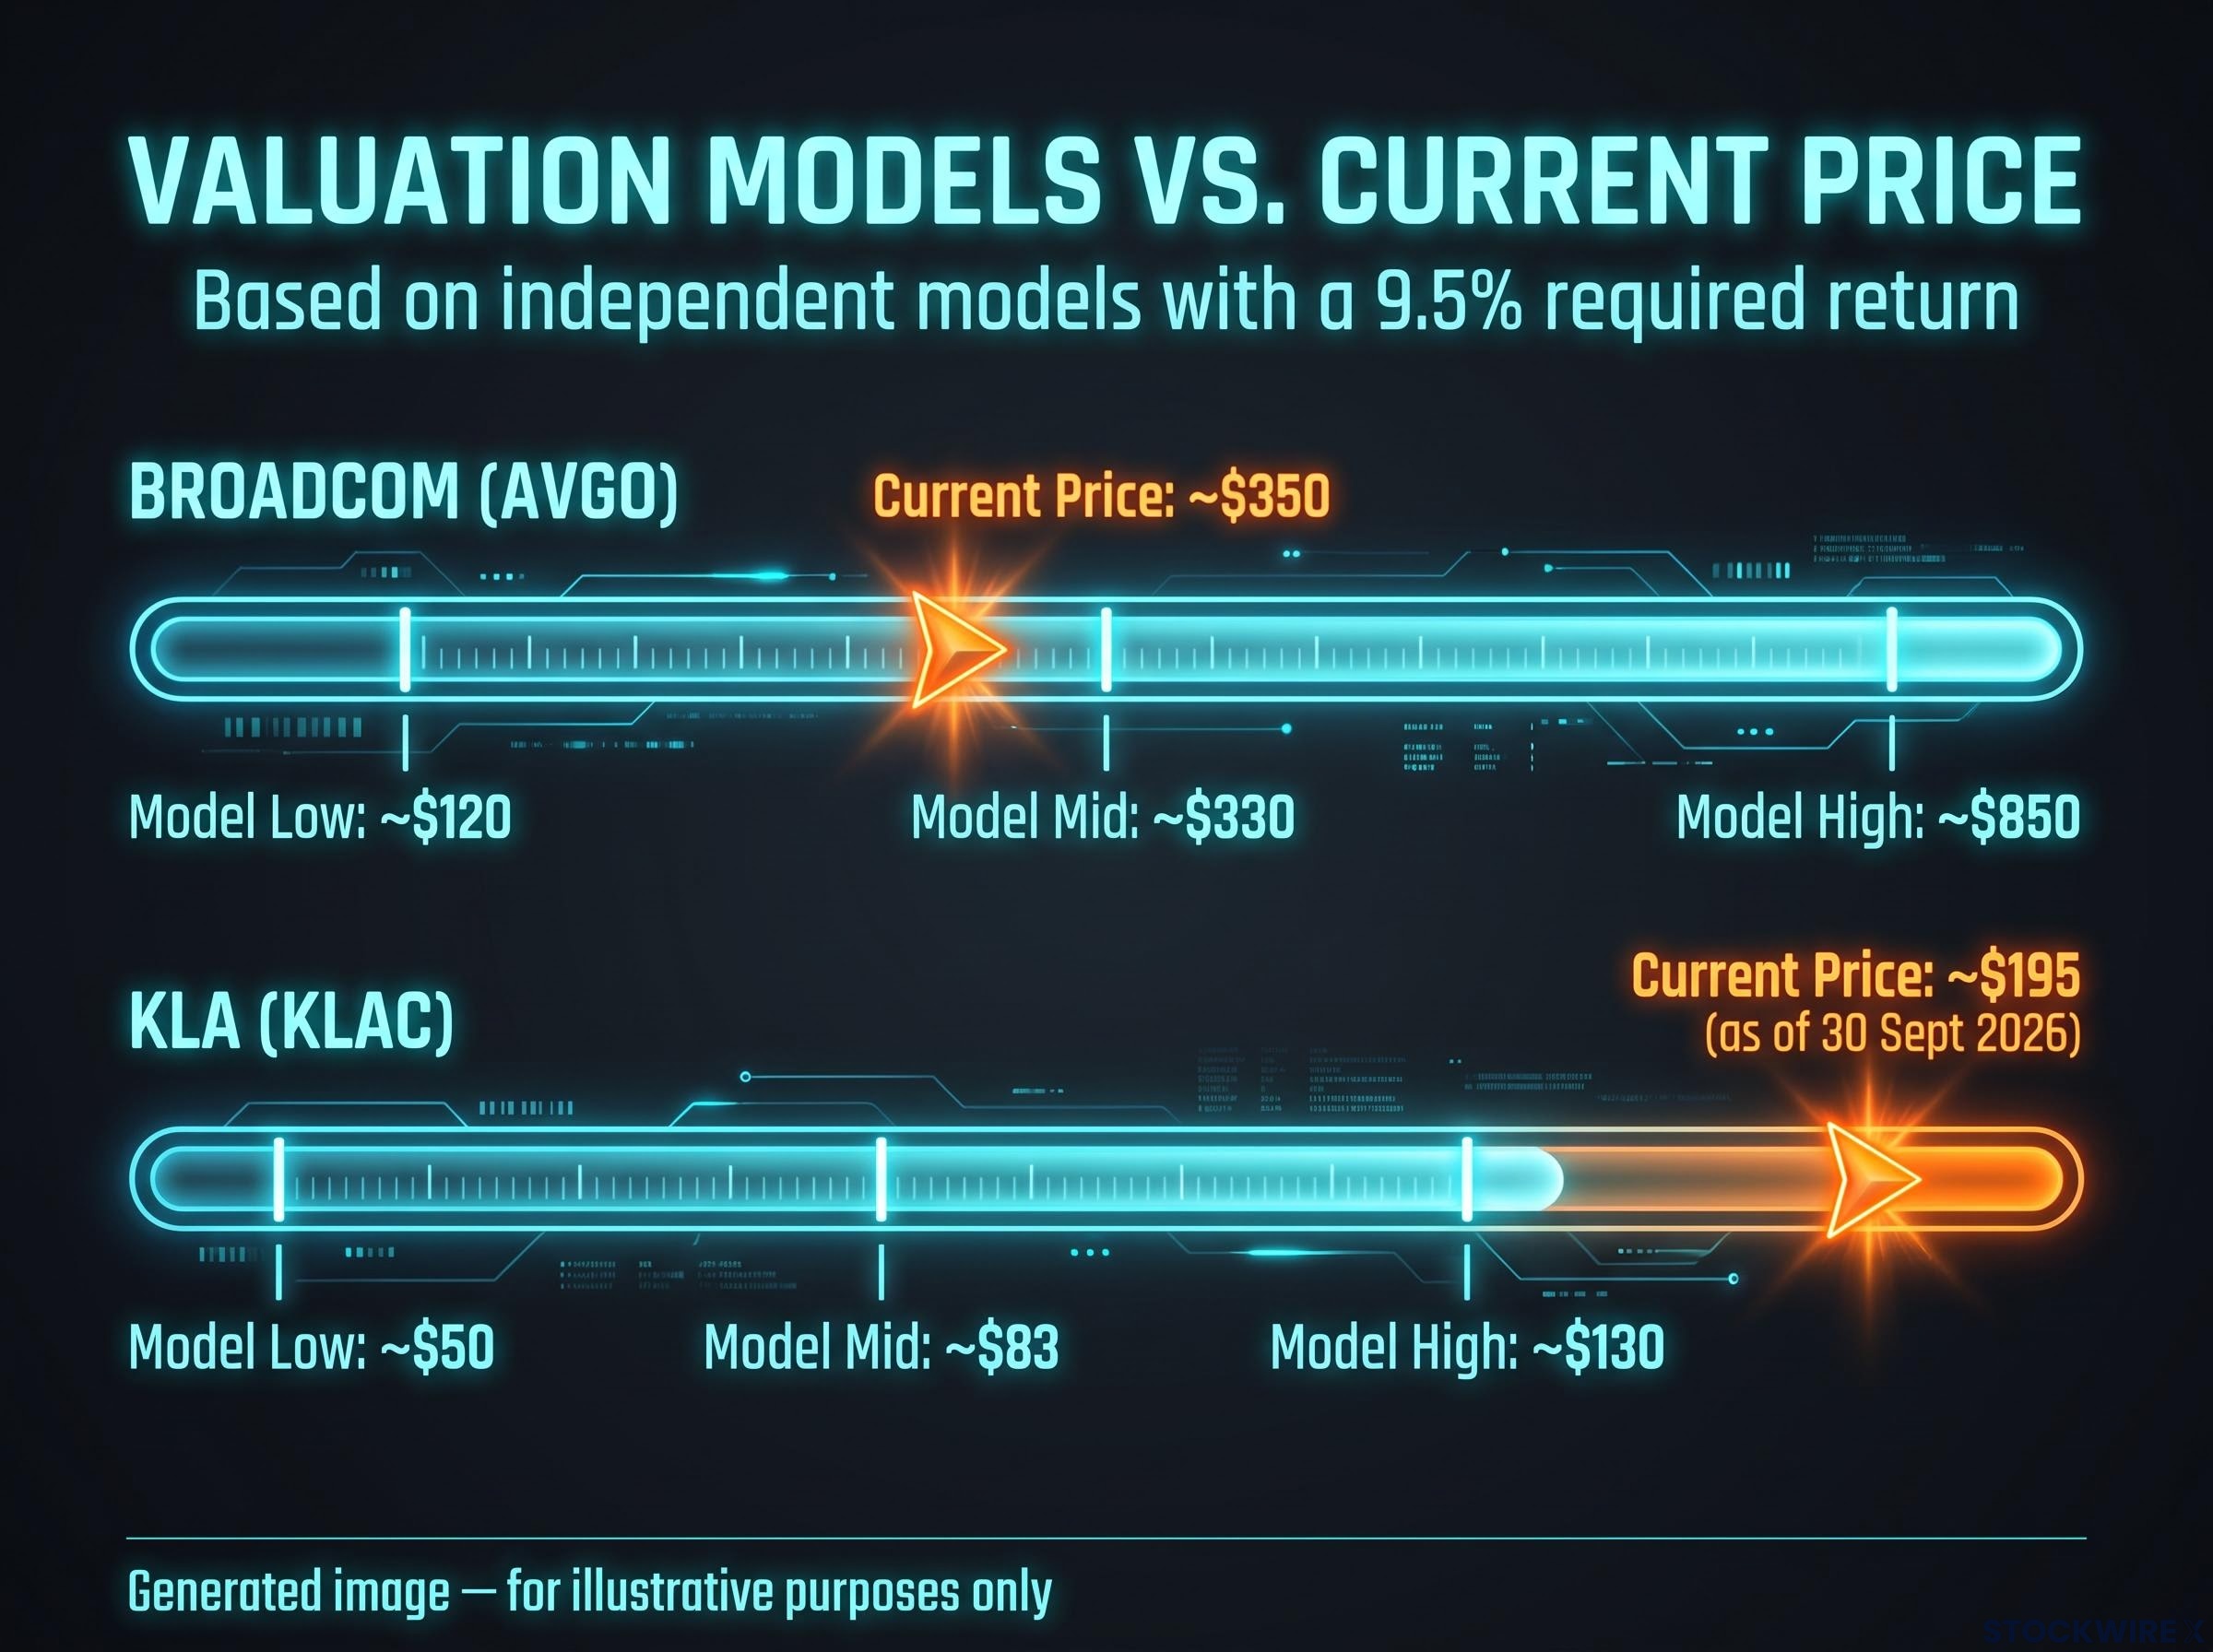
Start with the independent model outputs, built on scenario-based revenue growth, margin, and exit-multiple assumptions at a 9.5% required return. The required return is simply the annual gain an investor demands to justify owning the stock.
The gap between a stock’s market price and its independently modelled worth is the central question in this analysis, and intrinsic value estimation requires stress-testing terminal value assumptions that typically drive 60-80% of any DCF model’s total implied output, a point that matters acutely when the high-end scenario is already priced in.
| Stock | Model low | Model mid | Model high | Current price |
|---|---|---|---|---|
| Broadcom (AVGO) | ~$120 | ~$330 | ~$850 | ~$350 |
| KLA (KLAC) | ~$50 | ~$83 | ~$130 | ~$195 |
Broadcom at roughly $350 sits at or just above its model’s midpoint, within the scenario range. KLA at roughly $195 as of 30 September 2026 trades at more than double its model’s midpoint of $83, and above even the high-end estimate of $130.
Now place Wall Street beside those models. Broadcom’s analyst targets range from $350 to $715, with consensus around $505-$532. Post-Q3 FY2026, the split is stark.
- Cantor Fitzgerald: raised to $600 (bull)
- Rosenblatt Securities: raised to $600 (bull)
- BMO Capital Markets: lifted to $575 (bull)
- BofA Securities: raised to $530 (bull)
- TD Cowen: revised to $475 (dissenter)
- DA Davidson: held at $350-$400 (dissenter)
The dissenters are flagging the same thing in different words. DA Davidson noted Q3 guidance did not exceed already “heightened investor expectations” and that guidance is increasingly priced in. TD Cowen cautioned that reiterating prior growth targets “may not satisfy investors expecting significant beats.”
Here is the detail that should sharpen how you read bullish consensus.
Simply Wall St’s analysis noted that analysts lowered Broadcom’s implied fair value to approximately $339 from $360, even as they raised price targets into the $470-$582 range.
When an analyst raises a price target while lowering the intrinsic value estimate, they are effectively telling you they expect the stock to keep climbing even though they think it is worth less than before. That is momentum-following, not valuation discipline. The distinction matters for whether you treat “bullish coverage” as an actionable signal or as optimism already baked into the price.
The risk profiles are not the same, and the difference is structural
Both stocks wear the same “AI infrastructure” label, but their downside scenarios do not rhyme. Understanding why changes how you would size a position in either.
Positioning in both Broadcom and KLA is also shaped by semiconductor cycle dynamics broader than any single company: TSMC’s locked-in 2026 capital budget of $52-56 billion and a supply wave expected in 2027-2029 create conditions where multiple compression and earnings disappointment can arrive simultaneously, compressing the window for exit.
| Risk dimension | Broadcom (AVGO) | KLA (KLAC) |
|---|---|---|
| Primary risk | Hyperscaler capex cycle / expectations | Export controls / China exclusion |
| Secondary risk | Customer concentration (55% top-5) | Equipment-order cyclicality |
| Geographic risk | Limited direct exposure | Significant; China down 9% YoY |
| Policy risk | Minimal direct | High; BIS licensing active |
| Demand risk | AI spending normalisation | Global demand supportive; China excluded |
Broadcom: when the AI story meets the expectation wall
Broadcom’s chief risk is the hyperscaler spending cycle combined with expectation risk. With targets this elevated, the company may need to beat increasingly aggressive guidance just to avoid a negative price reaction.
Customer concentration compounds this. The top five hyperscalers at roughly 55% of revenue amplify the top line when spending accelerates, but create cliff-edge exposure if a major customer shifts toward fully in-house silicon. MarketBeat analysis from 8 September 2026 noted some analysts reduced targets post-Q3, citing concern that AI capex enthusiasm may be running ahead of fundamentals.
KLA: a demand story undermined by a policy story
KLA’s primary risk is categorically different: policy-driven exclusion from China. US export controls were expected to cut calendar-2025 revenue by approximately $500 million plus or minus $100 million, with a further $300-$350 million impact expected through 2026. China sales in Q4 FY2025 fell 9% year-over-year to $994 million, driven by new BIS rules targeting advanced DRAM facilities.
The policy risk sitting inside KLA’s China revenue loss is not a negotiable trade-layer item; export control durability is grounded in national-security law with bipartisan Congressional backing, placing chip controls structurally outside the reach of bilateral summit agreements or tariff negotiations.
KLA’s Form 10-Q for the quarter ended 30 June 2025 noted that the inability to obtain export licences for certain China shipments has reduced backlog, forced the return of customer deposits, and limited its ability to meet contractual obligations and sell to customers in China.
This matters because KLA’s China problem persists regardless of how strong global AI demand is. That makes its premium to intrinsic value harder to justify than Broadcom’s, whose risk is at least tied to the same growth story that supposedly warrants the premium.
Business quality is clear; investment quality depends on your assumptions
Both of these are genuinely high-quality businesses, not speculative bets. Broadcom has compounded revenue at roughly 23% annually over ten years and 36% over three years, with free cash flow nearing $40 billion. KLA generates around 40% return on capital and posted record quarterly free cash flow in Q4 FY2025.
The investment question is narrower. At current prices, both stocks require the high-end scenario in their independent models to deliver a satisfactory return at 9.5%. Broadcom at roughly $350 needs its path toward the $850 high case; KLA at roughly $195 already trades above its $130 ceiling. The margin of safety is narrow to non-existent.
Paying a premium for a great business is rational only when the growth required to justify it is not already consensus. In both cases, the AI tailwind is consensus, so the premium reflects widely shared optimism rather than proprietary insight.
Here is what to monitor:
- Broadcom: whether AI semiconductor revenue tracks toward the $115 billion FY2027 and $230 billion FY2028 guidance; whether hyperscalers accelerate in-house chip development; whether top-five concentration stays stable.
- KLA: whether export-control policy evolves to restore China access; whether non-China demand accelerates enough to offset structural exclusion; whether equipment-order cycles hold.
This article is for informational purposes only and should not be considered financial advice. Investors should conduct their own research and consult with financial professionals before making investment decisions. Past performance does not guarantee future results. Financial projections are subject to market conditions and various risk factors.