The 10-year Treasury yield touched roughly 5.35% and the 30-year about 5.7% on 5 October 2026, the highest since 2002, yet the Nasdaq closed at a record the same day. Bonds are signalling stress while stocks are signalling confidence, and both cannot be fully right.
The 10-year yield is the yardstick for mortgage rates, corporate borrowing and the models that value shares, so a move this size reaches household budgets and portfolios alike. It is also not just an American story: French bonds, the euro and the dollar are all moving in the same storm.
Here is the framework for understanding the global bond sell-off: why yields are rising, how the move travels into currencies, hedging and valuations, and what to watch next, from the 7 October FOMC minutes to the question of whether the 30-year reaches 6%.
What is driving the global bond sell-off, and why now?
Start with the scale. The 10-year hit about 5.34-5.35% intraday, and the 30-year about 5.7%, both the highest since 2002, before settling lower at roughly 5.3% and 5.6%.
Reuters described the 10-year as:
“a yardstick for borrowing costs and asset prices globally.”
| Treasury | Intraday peak | Recent level | Milestone |
|---|---|---|---|
| 10-year | About 5.34-5.35% | About 5.262-5.311%, settled near 5.3% | Highest since 2002 |
| 30-year | About 5.7% | About 5.613-5.69%, settled near 5.6% | 24-year high |
No single shock explains this. Five pressures are converging:
- Fed “higher for longer”: The Federal Reserve hiked in September, and investors want more compensation for holding long bonds if rates stay high.
- Deficits and supply: Bigger deficits mean more long-dated issuance, which lifts the term premium (the extra yield investors demand for locking money up for years).
- Energy-shock inflation: The Middle East conflict and the Strait of Hormuz keep oil-linked inflation fears alive. The ISM services PMI (a survey of service-sector activity) came in at 54.9 against 55.4 prior, but its prices paid gauge rose to 74 from 72.6.
- European fiscal stress: France’s budget troubles add to the global risk premium. Bundesbank’s Nagel and the ECB’s chief economist have urged flexibility and a measured response to Hormuz-linked inflation risk.
- Dollar safe-haven flows: Money seeking safety tightens financial conditions for borrowers outside the US.

The quarter delivered the largest rise in the 10-year yield this century, which points to structural repricing rather than a blip. For you, it means bond investors are demanding more for inflation and fiscal risk, so borrowing costs across the economy are being marked up, not just Treasury prices.
It also gives you a way to sort the drivers. Energy and French politics could fade; deficits and the Fed’s stance look stickier. Bloomberg Economics says the bar for an October hike is high, which offers some relief on one front.
The Fed’s September hike and a dot plot in which 16 of 18 officials expect another increase suggest that higher for longer is a multi-year regime, which is why long-bond holders are demanding extra compensation.
The 6% question for the 30-year
Earl Davis of BMO Global Asset Management has called a 30-year yield above 6% inevitable, possibly within October. That would be a fresh psychological threshold.
The counter-view is that anchored inflation expectations and even modestly cooling growth could stabilise long yields below that level.
When big ASX news breaks, our subscribers know first
How Europe and the dollar amplify the move
Shift your gaze to Paris. French bonds came under heavy pressure over doubts that the government can rein in its deficit and debt, and over fears of budget gridlock before the 2027 election.
The gap between French and German yields, the OAT-Bund spread, hit its widest since 2011 on 2 October before easing to about 145 bps. Spain added to regional jitters by calling a snap election for 29 November.
The euro felt it. It touched about $1.1161, a 17-month low and its weakest since May 2025, then traded near $1.1246 on 5 October after four straight weekly declines.
“Main winner” was how Matthew Ryan of Ebury described the dollar, as rising Treasury yields lift the appeal of US assets while debt selling abroad boosts demand for safe-haven currencies.
The US Dollar Index reached its highest since April 2025, rising 0.19% on the session after a high of +0.6%. Here is how the chain runs:
- French budget stress unsettles investors.
- The OAT-Bund spread widens.
- The euro weakens.
- Demand for dollar assets rises.
- Higher US yields draw further capital, and the cycle repeats.
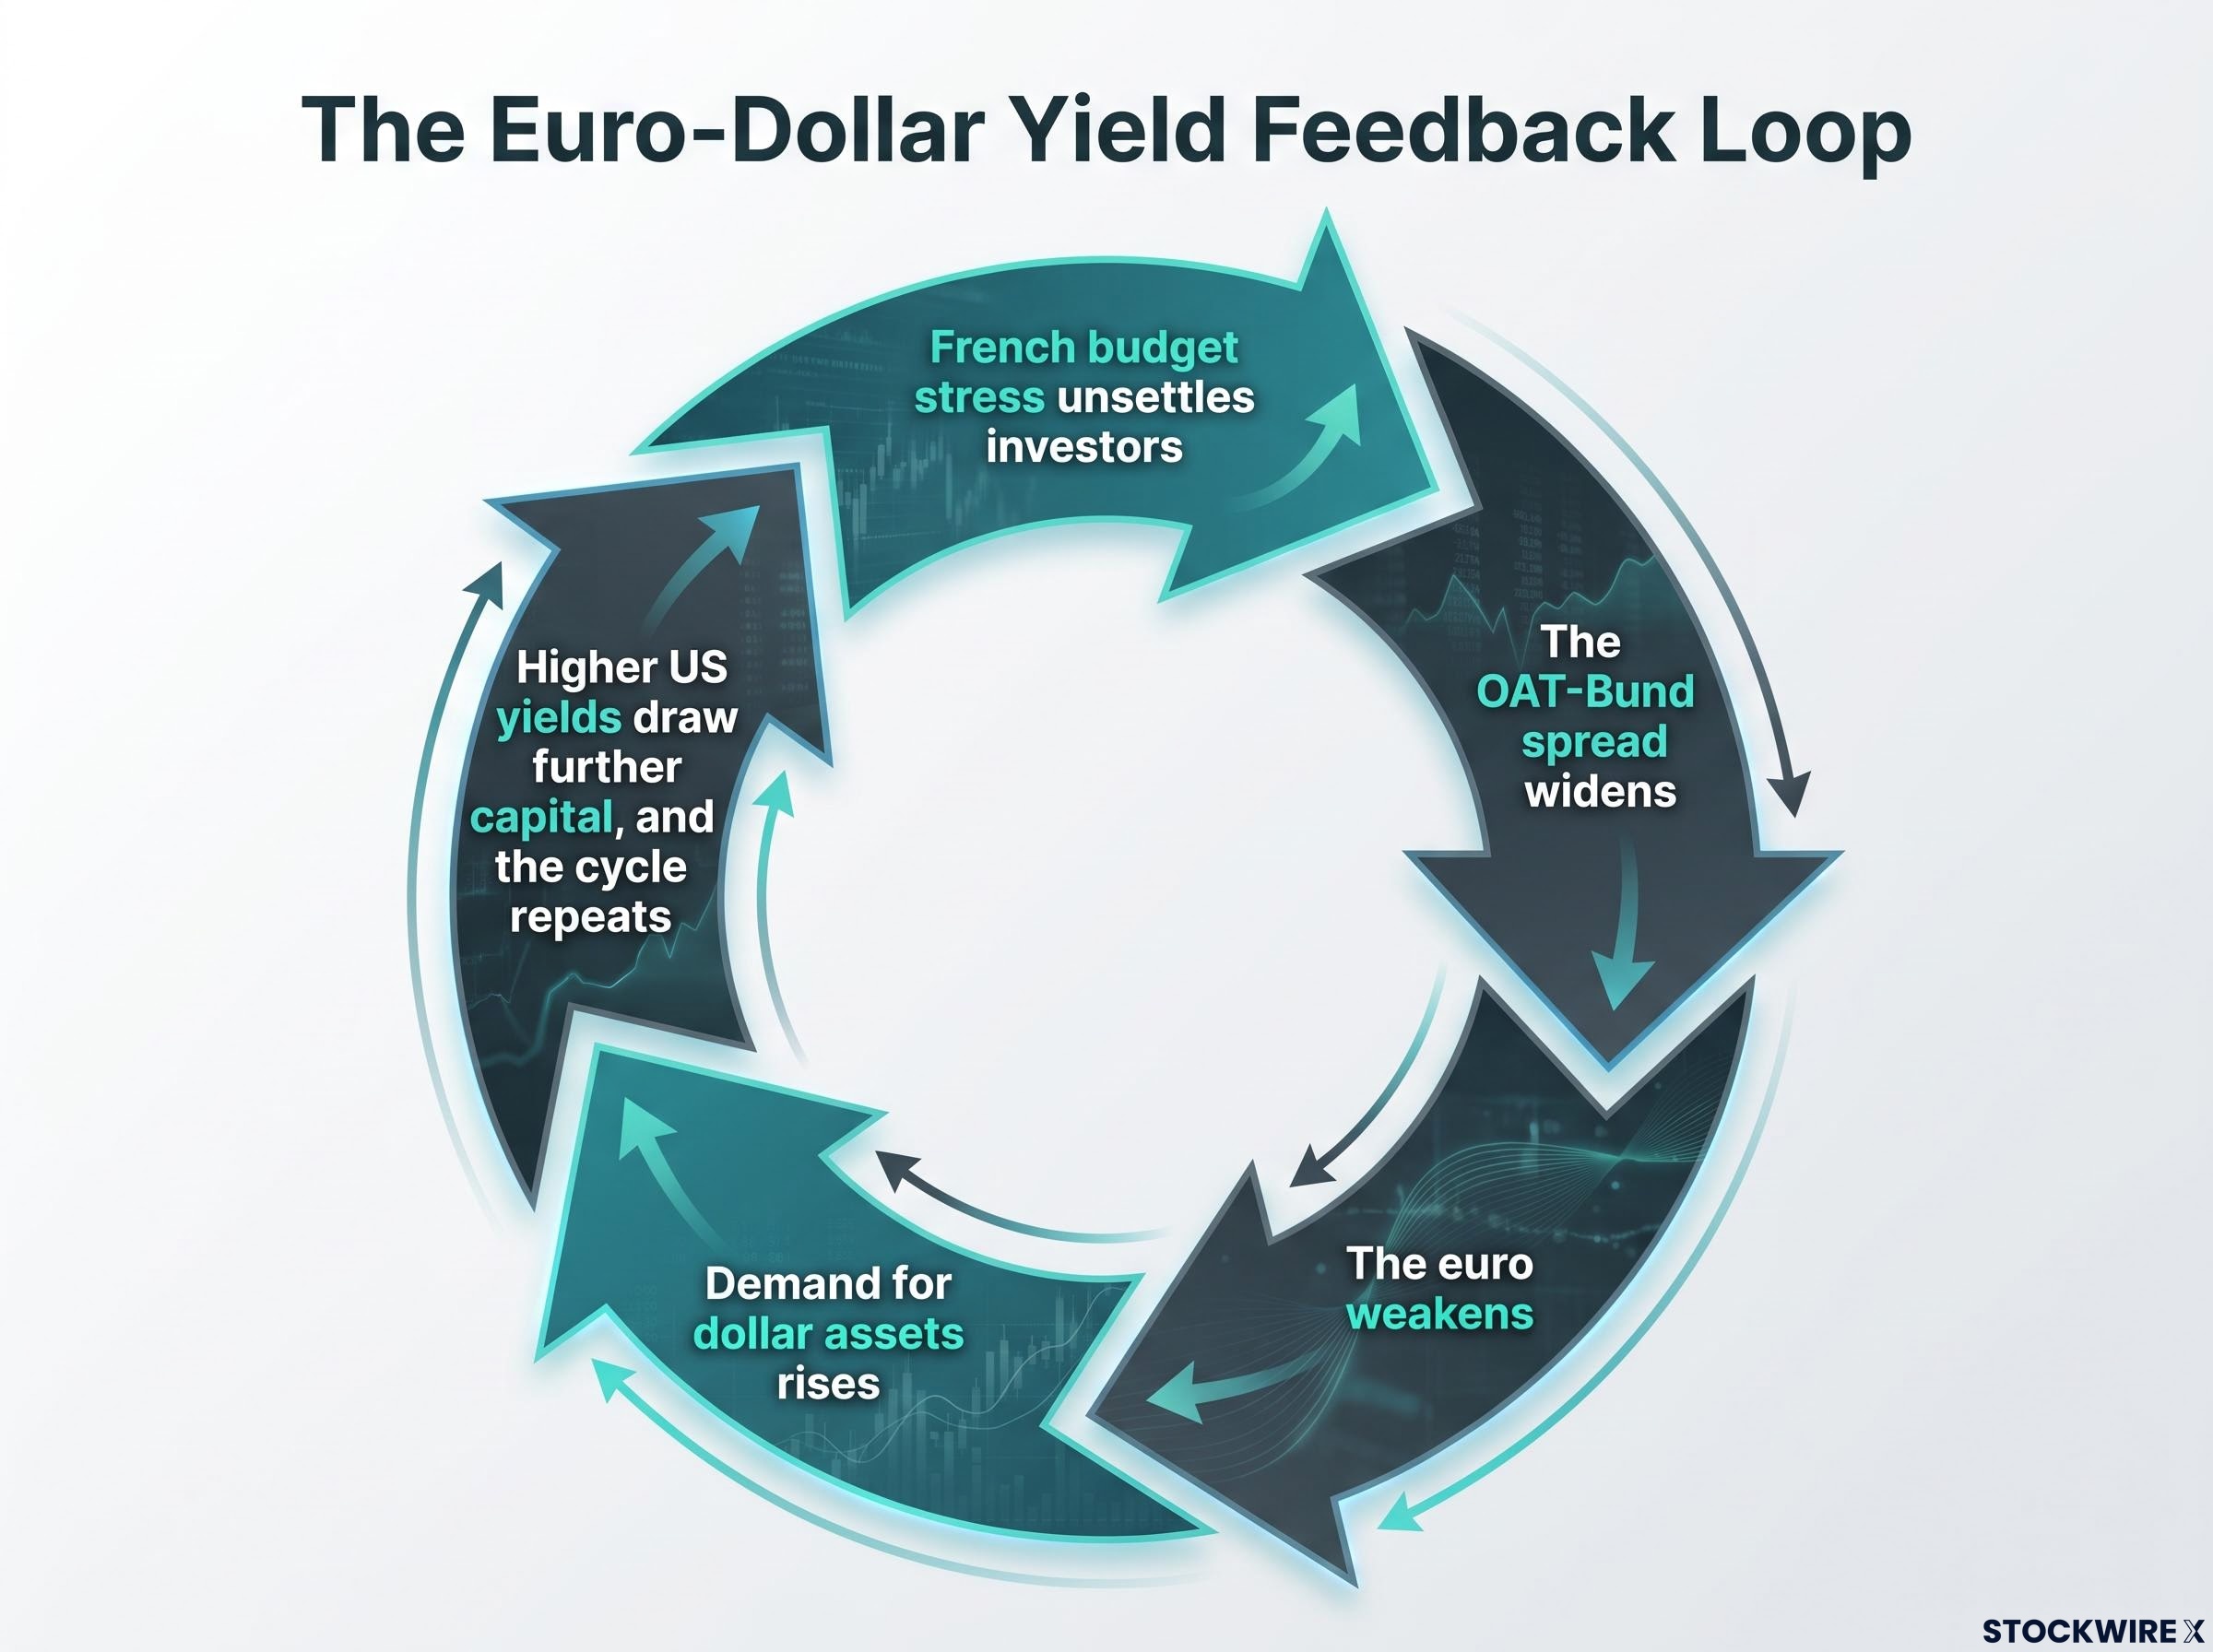
A stronger dollar and higher yields feed each other, so European stress is exporting upward pressure to US borrowing costs rather than providing a diversion. If you hold international assets, travel abroad or buy imports, the currency move belongs to the same story as the bond move.
The dollar’s global dominance helps explain the loop: it sits on one side of nearly 90% of foreign exchange trades, so capital flows toward US assets whenever Treasury yields rise.
How rising long-term yields reach hedging, the basis trade, valuations and currencies
You already know the starting intuition: higher rates mean higher costs. The less obvious part is the plumbing underneath, where a Treasury move can hit a leveraged fund and a growth stock in the same week.
Discount rates and the valuation squeeze
Investors value a company by estimating its future earnings and discounting them back to today’s money, using a rate tied to Treasury yields. When the yield rises, those future earnings are worth less now.
Long-duration assets, such as growth tech whose biggest profits lie years ahead, feel this most. Real Estate was the only S&P 500 sector to decline on 5 October, down 0.44%.
Why the basis trade draws regulator attention
The basis trade is a leveraged bet on the gap between Treasury futures prices and the cash bonds themselves. Funds borrow heavily to make a small price gap worth the effort.
When volatility rises, lenders demand more collateral (margin) and funding costs climb. A fund that cannot meet a margin call must sell, and forced selling can push prices further. That is what happened in the March 2020 “dash for cash,” when basis positions were unwound and the Fed had to step in.
The Fed, the Bank for International Settlements (BIS) and the International Monetary Fund (IMF) have repeatedly flagged hedge-fund participation in this trade. Near-6% long yields are seen as a threat to the futures complex.
The IMF Global Financial Stability Report warns that high debt and leverage among nonbank financial intermediaries can amplify volatility and force selling, which is exactly the mechanism that turns an orderly repricing in Treasuries into a disorderly one.
Real-money investors (pension funds and asset managers) face higher hedging costs too, and may cut duration instead, adding to the selling. The risk is not only slower growth but forced selling, which can turn an orderly repricing into a disorderly one.
| Channel | Mechanism | Who is most exposed | Warning sign |
|---|---|---|---|
| Valuations | Higher discount rates cut present value of future earnings | Growth stocks | Falling shares as yields climb |
| Hedging | Higher hedging costs push investors to cut duration | Real-money investors | Persistent long-end selling |
| Basis trade | Volatility lifts margin and funding costs | Leveraged funds | Treasury liquidity strain |
| Currencies | Yields pull capital into dollar assets | Euro and emerging-market currencies | Further dollar strength |
Why stocks are holding up, and what history says about the risk
On 5 October the equity market shrugged off the bond rout. The gains faded from session highs, but the closes still told a confident story.
| Index | Close | Daily change |
|---|---|---|
| S&P 500 | 7,774 | +0.66% |
| Dow Jones | 51,268 | +0.18% |
| Nasdaq (record) | 27,477 | +1.05% |
| Russell 2000 | 2,847 | +0.50% |
The VIX, Wall Street’s fear gauge, sat at 15.52. Nvidia rose 2.1% and Broadcom 2.0%, while Materials, Communication Services and Energy gained 1.22%, 1.14% and 0.89%. Abroad, the Nikkei added 2.40%, the FTSE 100 0.34% and the DAX 0.09%.
Three reasons are cited for the resilience:
- Strong nominal growth and earnings.
- Profitable mega-cap tech with strong balance sheets and AI demand, which is less sensitive to financing costs.
- A view that this is a one-time repricing, “higher for longer but not higher forever,” rather than a runaway cycle.
Bulls argue real yields are rising because growth and productivity prospects have improved, and that tight credit spreads show financial conditions remain manageable:
- Rising real yields may reflect better growth.
- Credit spreads remain tight.
- The Nasdaq record suggests conditions are workable.
Bears counter that yields of 5.3-5.7% will eventually bite:
- Higher mortgage rates.
- Tighter corporate financing.
- Pressure on richly valued growth stocks, with narrow mega-cap leadership looking fragile.
Breadth offers partial comfort: the equal-weight S&P 500 performed in line with the cap-weighted version. Yet the Dow remains about 6% below its 5 August record, and FactSet shows a record 60% of S&P 500 stocks carry Buy ratings ahead of Q3 earnings, which leaves little room for disappointment.
Three precedents, three differences
In 2023 the 10-year approached 5% on similar term-premium and fiscal worries, but today’s move is larger and coincides with energy and European stress. In March 2020, leveraged basis trades triggered a Treasury liquidity shock and heavy Fed intervention; regulators are more alert now, but heavy issuance and active basis trades keep the question open.
The 2022 UK gilt crisis exposed leveraged liability-driven investment strategies and forced Bank of England purchases. Today’s episode is broader and global, spanning Treasuries, euro-area debt and currencies, though central banks now have the gilt episode as a template.
Equity strength tells you markets are betting on a repricing, not a tightening spiral. The FOMC minutes and any push toward 6% are the tests of that bet. Exact Brent and WTI levels and the minutes’ contents were not available at the time of writing.
What the yield spike settles, and what it leaves open
The evidence points one way: yields are rising on inflation, fiscal and European pressures, and the move travels through the dollar, hedging costs and valuations. Equities are currently wagering on a repricing rather than a spiral.
The signposts are close at hand: the FOMC minutes on 7 October, whether the 30-year edges toward 6%, French spreads, and Q3 earnings. Each will show whether the equity bet holds.
For your own portfolio, the questions to ask are how much of your exposure sits in long-duration growth, and how your borrowing costs track the 10-year.
This article is for informational purposes only and should not be considered financial advice. Investors should conduct their own research and consult with financial professionals before making investment decisions. These statements are speculative and subject to change based on market developments, and past performance does not guarantee future results.