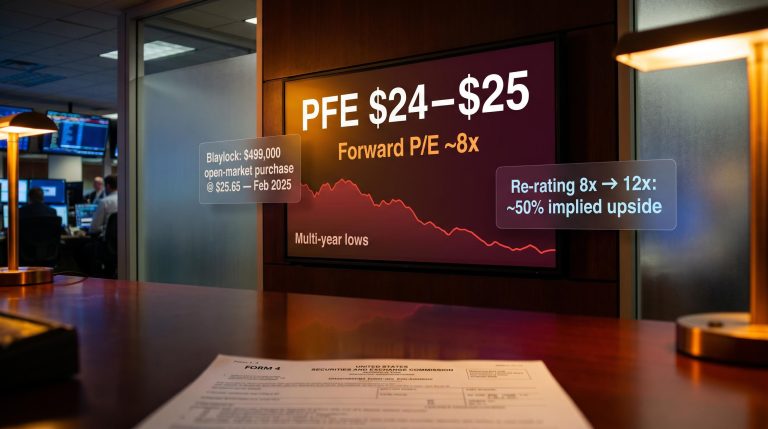
Pfizer Insider Buying: What the Filings Actually Confirm
8 mins ago

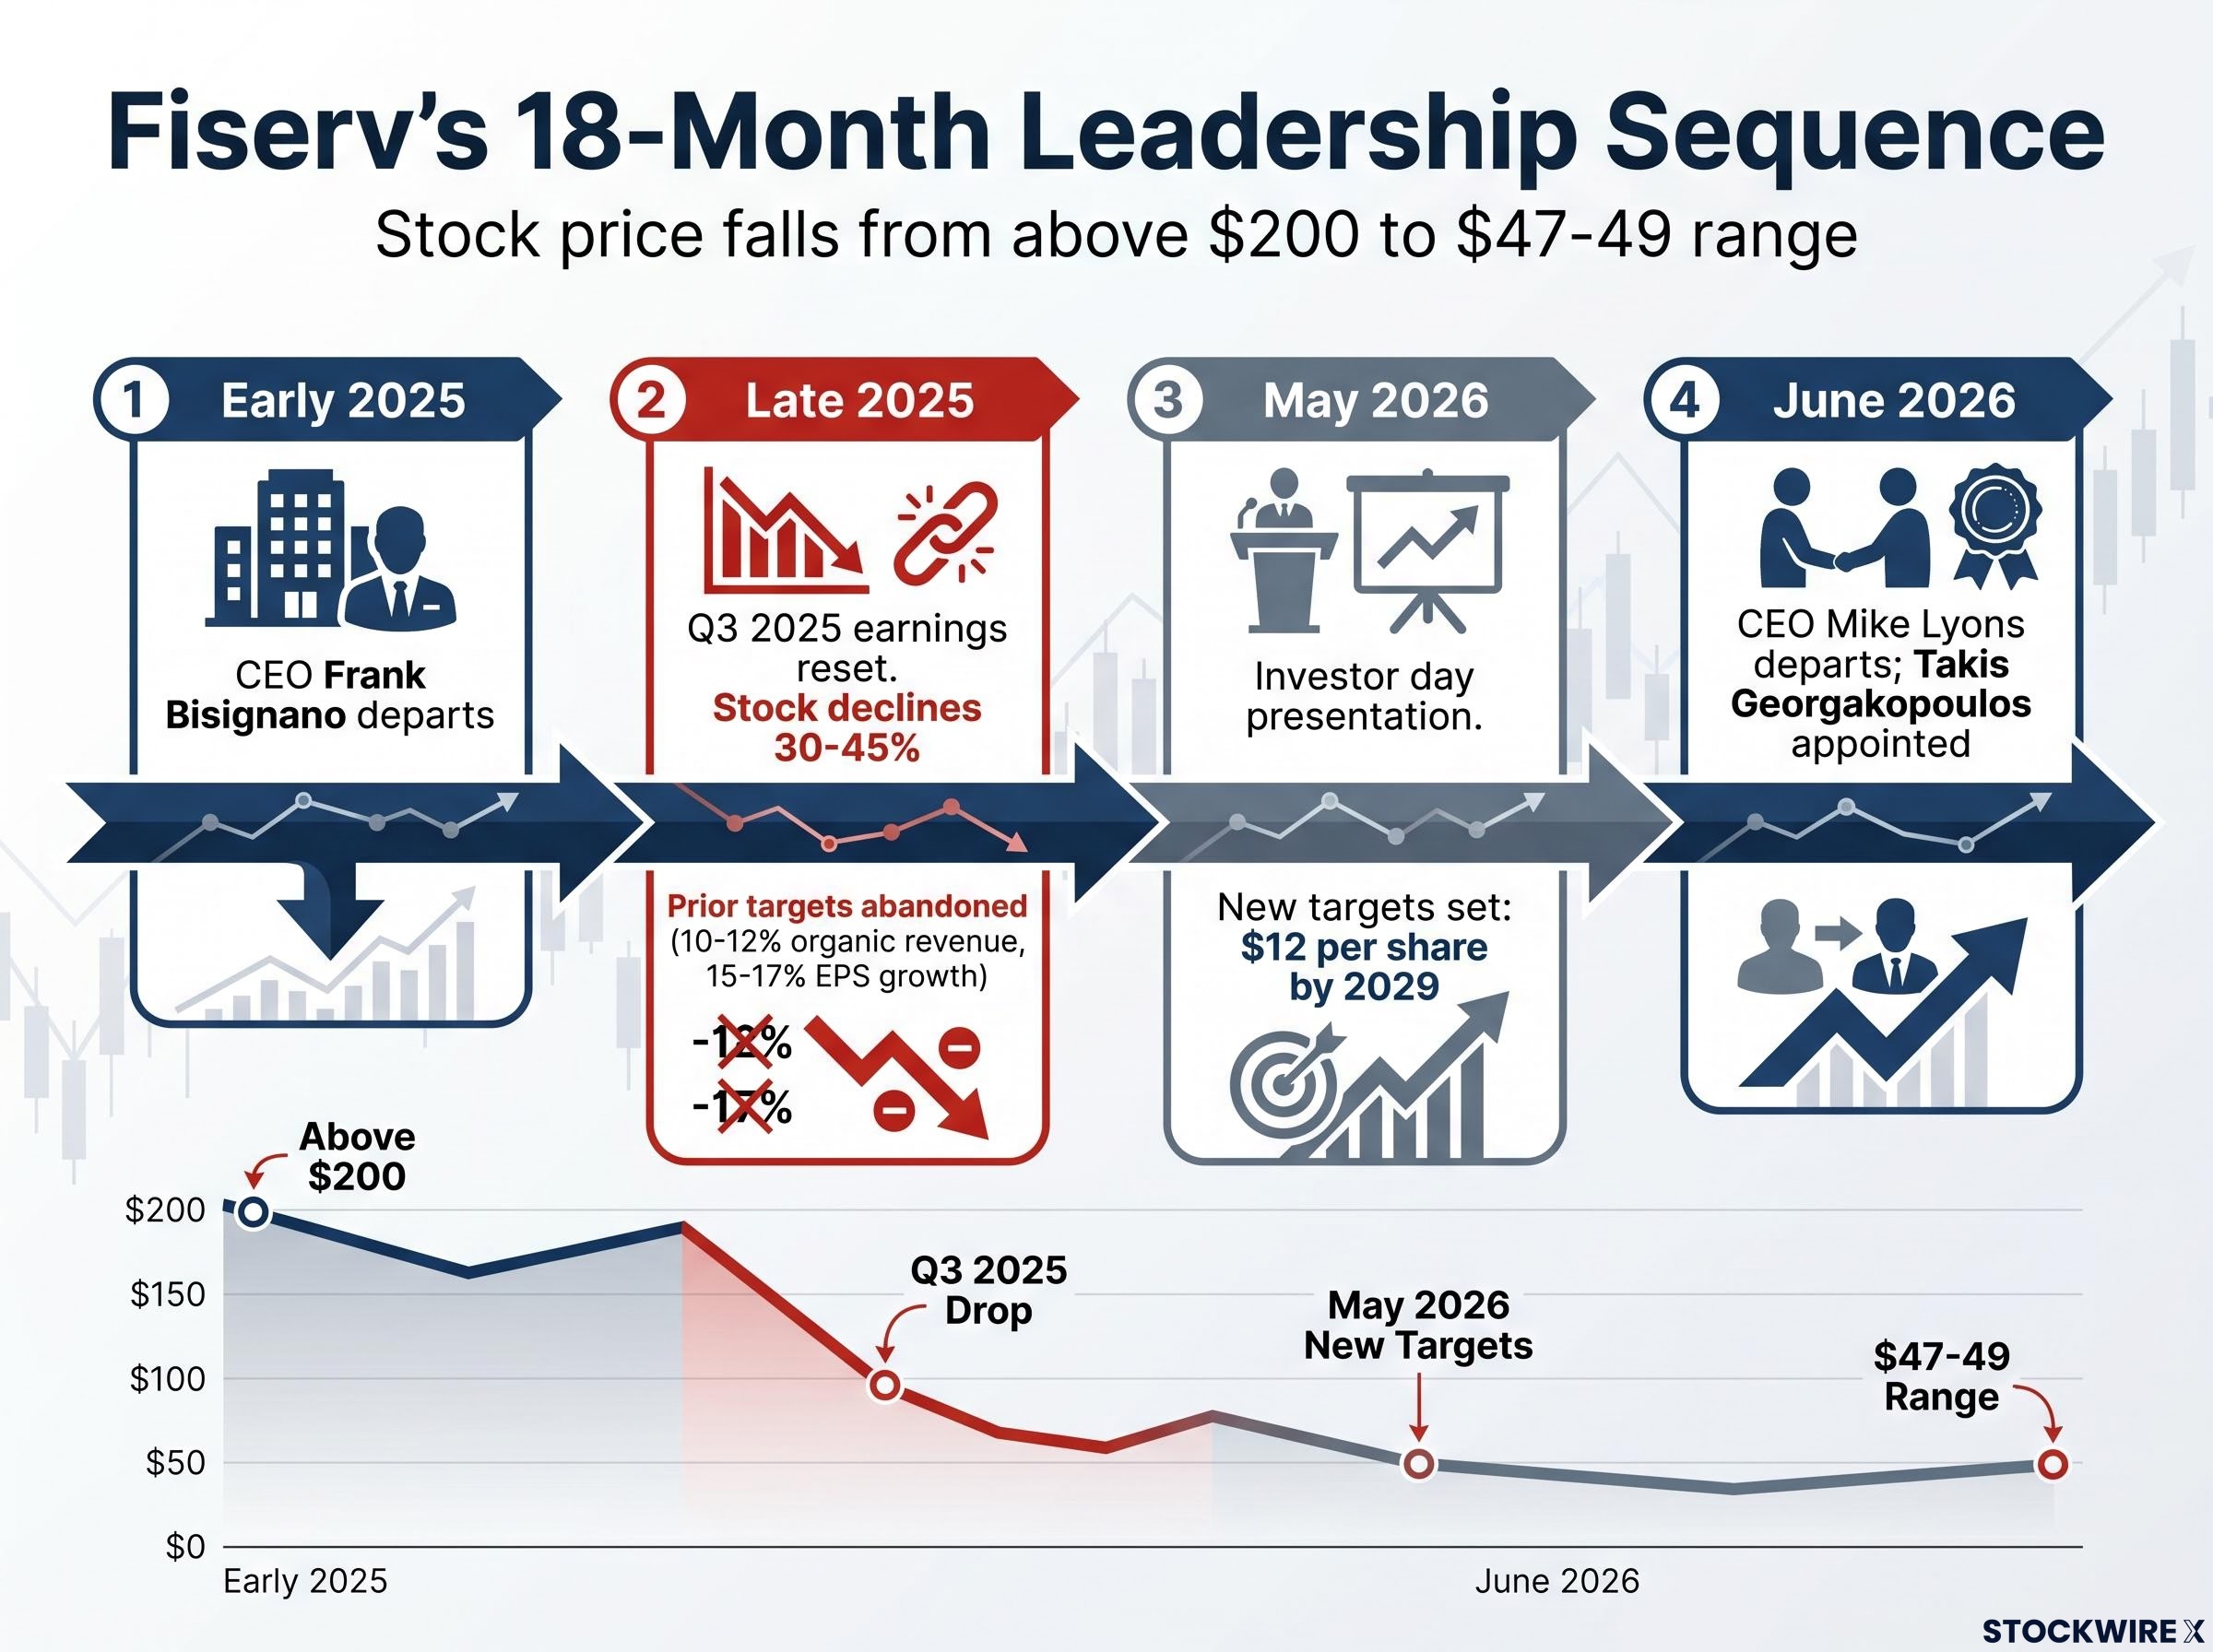
Fiserv has now lost two CEOs in roughly 18 months. The second departure, announced in June 2026, arrived just weeks after management stood in front of investors and laid out a fresh set of forward targets. When leadership changes this rapidly after a guidance reset, every projection on the table deserves a harder look.
This is not a distressed company. Fiserv processes trillions of dollars in payment volume annually, ranks as the leading merchant acquirer across the United States according to Nielsen data, and generates approximately $20 billion in annual revenue. But the stock has fallen from above $200 to the $47-49 range over roughly 18 months, a compression that implies either a genuine value opportunity or a trap, depending on which variables resolve first.
Here is a framework for what the turnaround actually requires, what the realistic scenario range looks like from the current price, and which quarterly metrics will tell you whether the thesis is working before the broader market adjusts.
The timeline matters because each event changed the information environment differently. Follow the sequence:
| Event | Date | Market impact | Credibility effect |
|---|---|---|---|
| Bisignano departure | Early 2025 | Reassessment of prior growth guidance | Original thesis anchor removed |
| Q3 2025 earnings reset | Late 2025 | Stock declined approximately 30-45% | Prior targets (10-12% organic revenue, 15-17% EPS growth) abandoned |
| Investor day presentation | May 2026 | New targets set: $12 per share by 2029 | Partial credibility rebuild attempted |
| Lyons departure; Georgakopoulos appointed | June 2026 | Further confidence erosion | Third CEO in 18 months; investor day targets now orphaned from presenter |
Georgakopoulos brought experience from JP Morgan before arriving at Fiserv toward the end of 2024, and had been directing the Merchant Solutions segment prior to his appointment as CEO. That background makes him the most credible interpreter of the growth targets he helped formulate. It also makes him the executive with the most to lose from another reset. He personally owns the investor day numbers. Whether that produces accountability or defensiveness is the question investors need to watch.
Fiserv’s official leadership transition announcement confirms that Georgakopoulos succeeds Lyons, who departed to become CEO of Truist Financial Corporation, placing the new chief executive directly in ownership of the investor day targets he helped develop as head of Merchant Solutions.
Look at the numbers before and after, and the severity of the stock’s reaction starts to make sense. The prior leadership team had set out targets of organic revenue growth in the 10-12% range alongside adjusted earnings-per-share (EPS) gains of 15-17%, with a stated objective of surpassing $10 per share. The Q3 2025 result delivered approximately 1% total organic revenue growth. Merchant Solutions grew 5%. Financial Solutions declined 3%.
A miss that large against guidance that aggressive would be painful on its own. What made it worse was the confession that accompanied it.
New management publicly acknowledged that prior EPS targets had been pursued too aggressively while the business was simultaneously underinvesting in services and products.
That is not a cyclical miss. That is a structural admission. Analysts drew comparisons to Jack Welch-era management practices: a pattern of prioritising reported earnings each quarter while hollowing out the business beneath, a framing with particular resonance for US investors who remember how that story ended. The implication is that reported margins under the prior regime were partially borrowed from the company’s future operational health.
When management states that prior targets required underinvestment in the core business, you have to reprice not just the near-term numbers but the quality of every historical earnings figure. That is why the stock did not fall 10%. It fell 30-45%.
Fiserv runs two segments that each account for roughly half of total revenues: Financial Solutions and Merchant Solutions. The consolidated picture only makes sense once you understand what is happening inside each one.
Financial Solutions serves thousands of banks and credit unions by supplying core banking technology, digital payment capabilities, and card issuance infrastructure. Revenue has declined in the low-to-mid single digits recently, with the most recent reported quarter showing a decline of approximately 5-6%.
Management has attributed the weakness explicitly to client attrition, particularly among smaller credit unions and banks, tied to service and implementation failures accumulated over years. This is not demand-cycle weakness. Switching costs in core banking technology run in both directions: they kept clients locked in for years, but they now slow re-acquisition once trust has been damaged. Winning back a community bank that endured a botched migration is materially harder than retaining one that never left.
Merchant Solutions is anchored by Clover, Fiserv’s flagship platform for small and medium-sized businesses (SMBs). Clover serves as an integrated business management platform, combining payment processing with tools covering stock control, receivables tracking, and merchant marketing capabilities. Management projects long-term Clover growth of 10% or more annually and is layering value-added services (VAS), software tools that drive revenue per merchant upward, with artificial intelligence (AI) integration as the stated next lever.
The headline Clover growth rate looks strong. The complication sits underneath it. Small-business total payment volume (TPV), the total dollar value of transactions processed, has grown only approximately 4-6% in aggregate, while Clover TPV has posted materially stronger growth. That gap implies part of Clover’s strength comes from routing Fiserv’s internal pipeline toward Clover rather than purely winning new market share.
| Segment | Recent revenue trend | Key driver | Key risk | Management target |
|---|---|---|---|---|
| Financial Solutions | Declining approximately 5-6% | Core banking software for banks and credit unions | Structural client attrition from service failures | Stabilise toward flat |
| Merchant Solutions | Flat to slightly negative overall | Clover platform and VAS penetration | Clover growth masking legacy merchant decline; mix-shift dynamics | Clover 10%+ annually; high single-digit overall |
What this means for you: track consolidated merchant segment organic growth alongside Clover’s headline figure. A sustained gap between the two would indicate that Clover is displacing older volume within Fiserv rather than growing the total addressable pool. The bull case requires Clover to lift net segment growth clear of the mid-single-digit range. Should the overall segment persistently fall short of Clover’s reported TPV gains, the underlying growth engine is producing heat without moving the vehicle forward.
The balance sheet is not a background risk factor. It is the sequencing constraint that determines when and whether the buyback thesis can actually activate.
Fiserv carries debt-to-EBITDA (earnings before interest, taxes, depreciation, and amortisation, a measure of a company’s ability to service its debt from operating earnings) of approximately 3.3x, debt-to-capital near 0.5, and goodwill of approximately $37-38 billion from past acquisitions. At around 3x net debt-to-EBITDA, management has indicated the balance sheet begins to look stretched and uncomfortable.
Under prior leadership, capital allocation leaned toward maximising shareholder distributions, including leverage-funded buybacks. New management has shifted focus toward debt reduction as the near-term priority. That shift itself has been a source of investor disappointment, but it reflects reality: at 3.3x leverage with slowing revenue growth, aggressive buybacks would be borrowing against a deteriorating base.
Once leverage improves to approximately 2.5x net debt-to-EBITDA or below, management has indicated the company could direct an estimated 10-15% of market capitalisation annually to share repurchases at current valuations.
That is the value-unlock condition. But it is contingent, not current. Track these items quarterly:
The $37-38 billion goodwill figure deserves separate attention. It suppresses reported return on capital in a way that makes the business look worse on standard financial screens than its cash generation actually justifies. If you are screening Fiserv on GAAP return on capital alone, you may be systematically underestimating the cash economics.
The goodwill figure also suppresses reported return on equity in a way that confounds standard financial screens; the fundamental analysis metrics most relevant here are those measuring cash generation and leverage trajectory rather than GAAP-based return ratios that goodwill distorts.
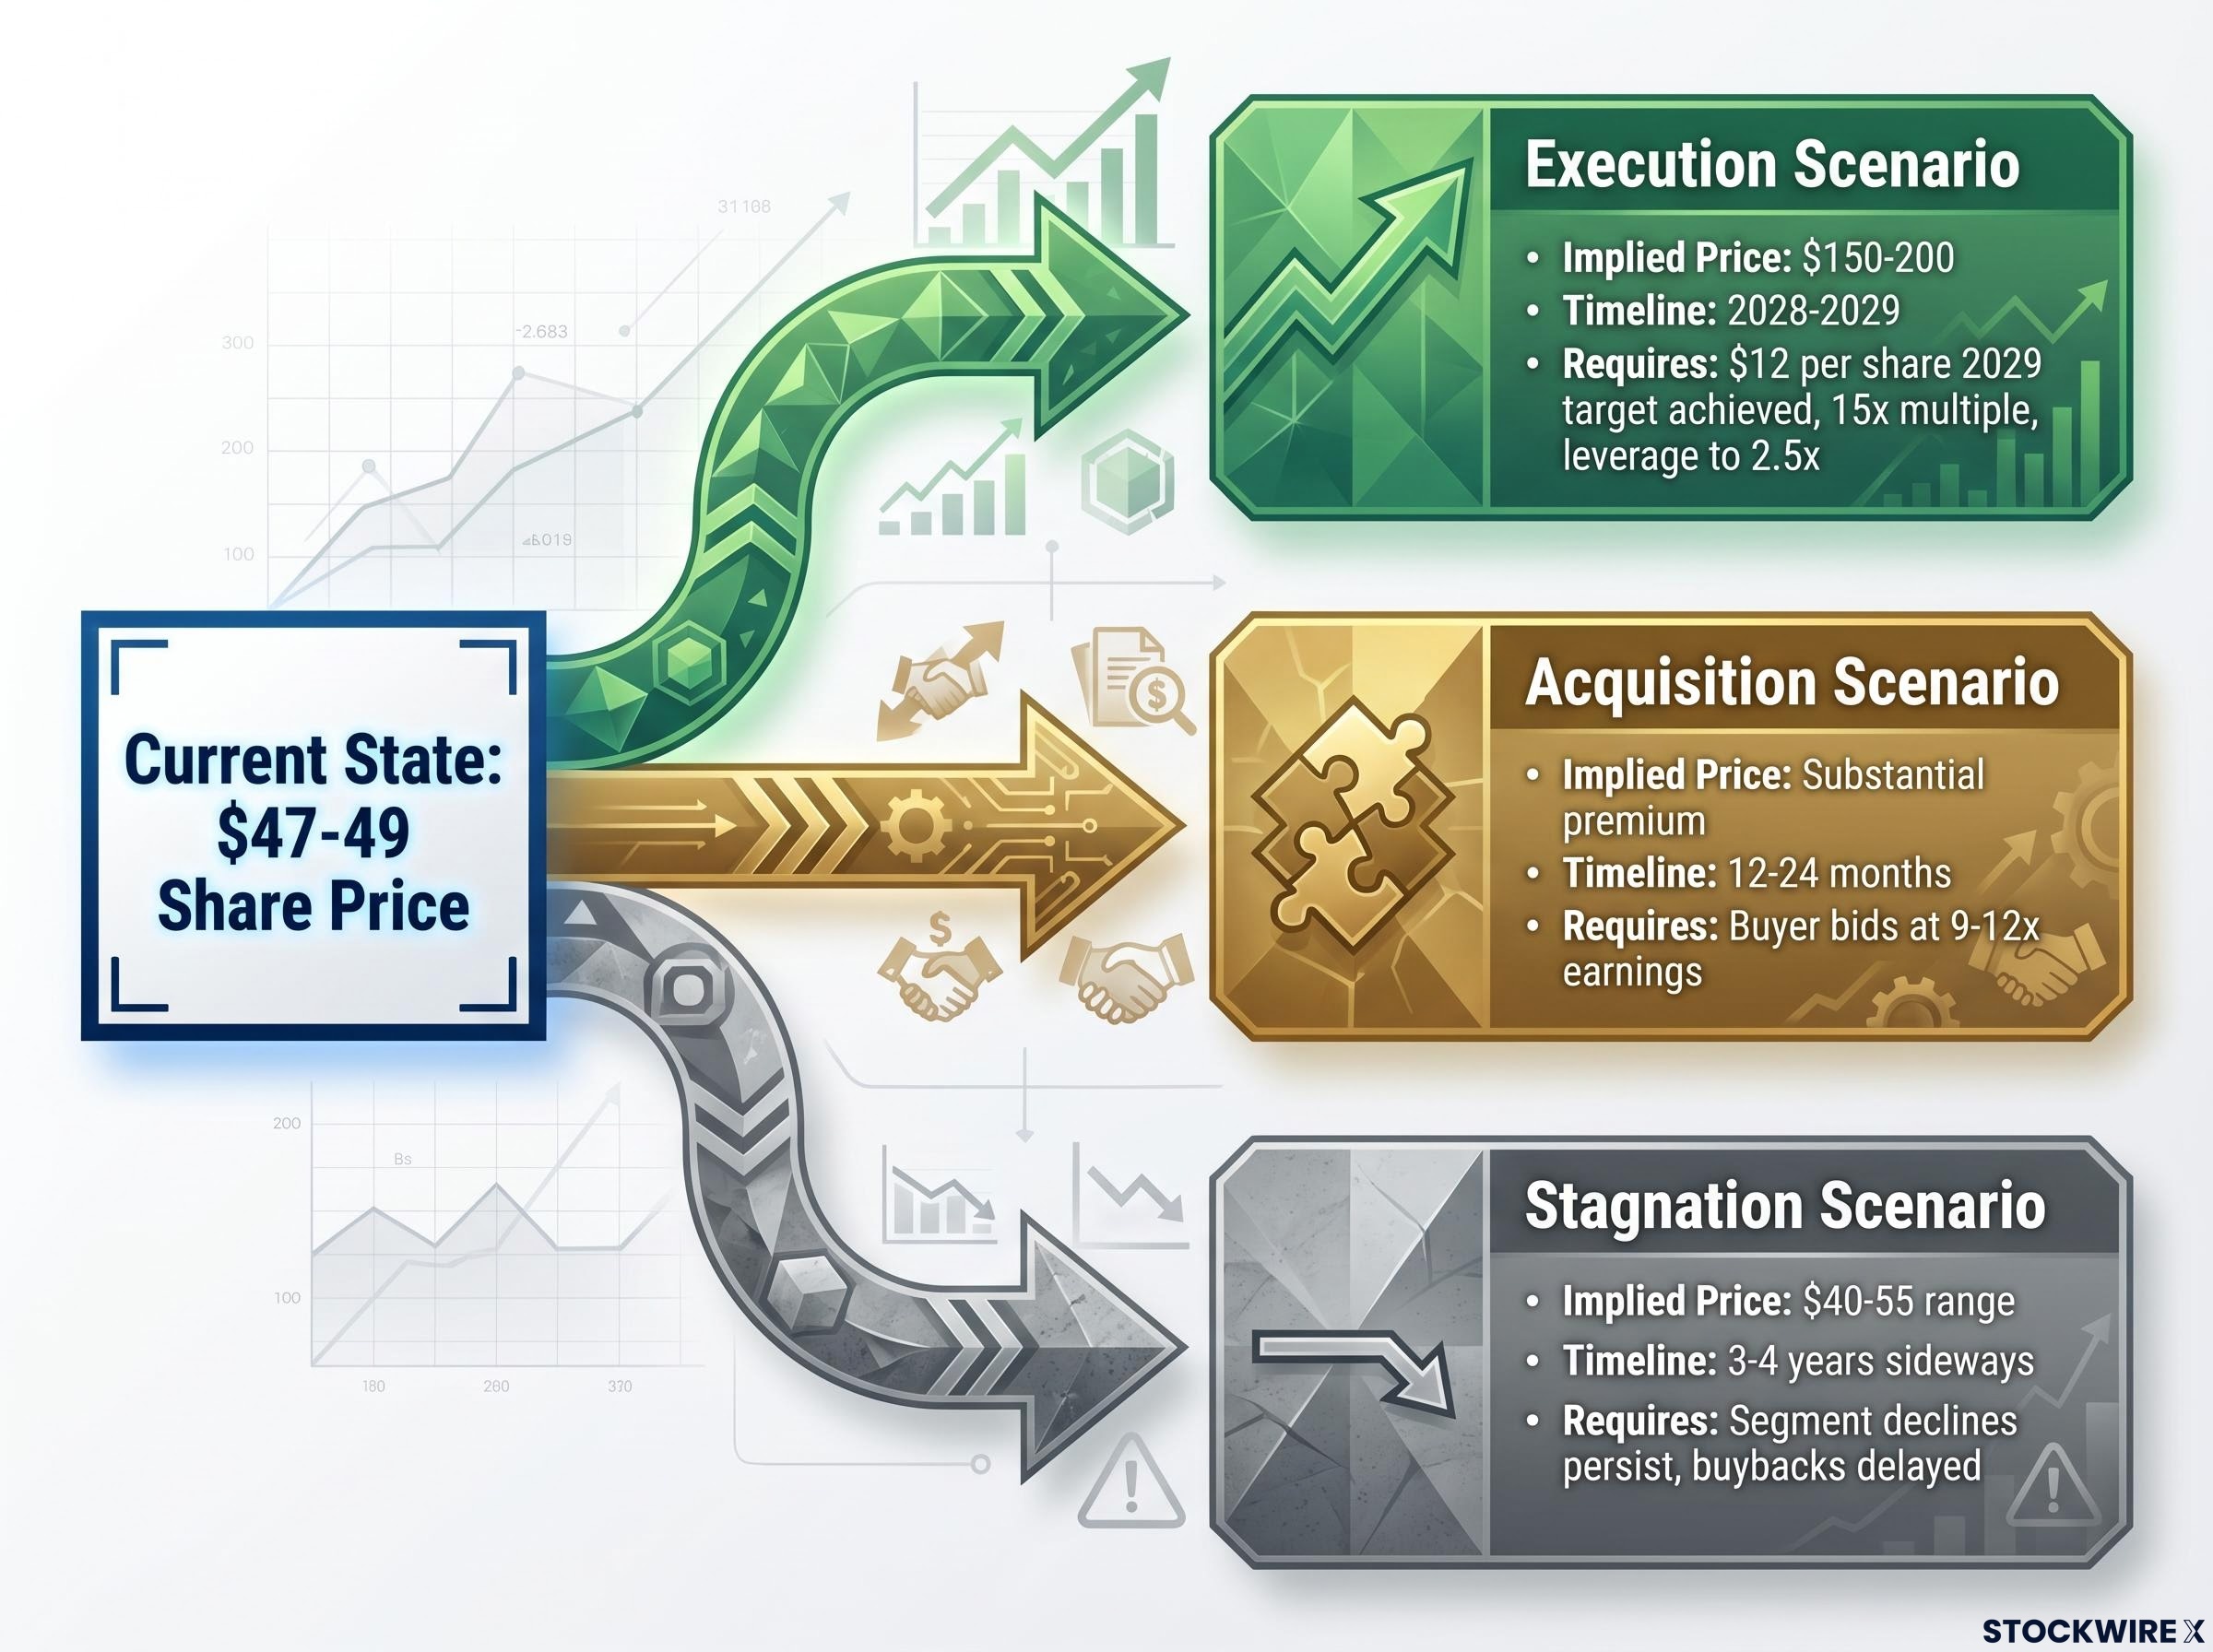
The stock was changing hands at close to 25 times earnings in early 2025, before the reset drove the share price down to the current $47-49 range. The question is what the current price is actually paying for. Three scenarios frame the range:
| Scenario | Key conditions required | Implied share price | Timeline | Primary risk |
|---|---|---|---|---|
| Execution | Financial Solutions stabilises; Clover drives consolidated growth; leverage falls to 2.5x | $150-200 | 2028-2029 | Another guidance reset or leadership change |
| Acquisition | Strategic or PE buyer bids at 9-12x earnings | Substantial premium to current | 12-24 months | Integration complexity; leverage; regulatory risk |
| Stagnation | Segment declines persist; buybacks delayed by leverage | $40-55 range | 3-4 years sideways | Indefinite value deferral; opportunity cost |
The gap between the current price and the execution scenario is not free money. It represents the market’s current pricing of the probability that management fails to deliver. Whether the market is assigning that probability correctly, too harshly, or too generously is the central question the investment thesis rests on. The arithmetic is only as good as the assumptions feeding it.
Note: the original analyst whose research informs this analysis sold personal Fiserv holdings above $200 per share at the start of 2025.
The stock price itself will not give you an early signal. The segment metrics and leverage trajectory will show the thesis working or breaking months before the broader market adjusts its view. Four items deserve quarterly monitoring:
This is not a core compounder holding. It is a special-situation position that requires small sizing, patience across a 3-4 year horizon, and comfort with further leadership volatility. Quarterly active monitoring of the metrics above is non-negotiable.
Other well-capitalised businesses in the payments sector trade at below-market multiples while carrying less debt and more predictable management continuity. Investors who place a premium on operational stability and conservative balance sheets may find those names offer a more attractive trade-off between risk and return. Fiserv suits a different kind of buyer: one explicitly positioned for a compressed-multiple recovery with the possibility of a strategic transaction providing an additional exit route.
Working from the current $47-49 share price, the maths of the $12 per share 2029 earnings target are straightforward: a return to even a modest 13-15 times multiple on those earnings would place the share price in the $150-180 range, a recovery of several times the current price. The question has never been the maths. It is the credibility of the assumptions.
The bull case is arithmetically compelling. The execution track record under current leadership is not yet established. That gap is the entire investment question.
Georgakopoulos must demonstrate three things within 2-3 quarterly reporting cycles to re-establish the forward earnings credibility the stock needs for re-rating:
Executive confidence signals, including significant insider purchases and product-launch timing, carry weight in special-situation turnaround theses because they represent management putting capital alongside the guidance they have set, a dynamic that sharpens accountability in ways that verbal commitment alone does not.
If those conditions materialise, the current price looks like genuine deep value. If they do not, the discount reflects earned scepticism rather than market error. The payments sector contains alternatives carrying steadier management records and more comfortable leverage ratios for investors who would rather not take on this degree of execution risk. Fiserv at $47 is the higher-variance proposition, one that rewards handsomely if the new team delivers and extracts a cost in time and foregone opportunity if it does not.
The verdict is not that Fiserv is cheap or expensive at this price. It is that the current valuation is only unambiguously attractive if you assign a higher probability to management delivery than the market currently does. That is a judgement only you can make after watching the next two or three quarters.
This article is for informational purposes only and should not be considered financial advice. Investors should conduct their own research and consult with financial professionals before making investment decisions. Past performance does not guarantee future results. Financial projections are subject to market conditions and various risk factors.
The collapse was triggered by a Q3 2025 earnings reset in which new management admitted prior EPS targets had been pursued too aggressively while the business simultaneously underinvested in services and products, causing the stock to fall approximately 30-45% and prompting a full repricing of historical earnings quality.
Clover is Fiserv's flagship platform for small and medium-sized businesses, combining payment processing with inventory, receivables, and marketing tools; management targets 10% or more annual Clover growth, but the key risk is that Clover's headline gains may partly reflect internal volume routing rather than genuine new market share.
Fiserv carries net debt-to-EBITDA of approximately 3.3x, and management has indicated that leverage needs to fall to around 2.5x before the company can direct an estimated 10-15% of market capitalisation annually to share repurchases, meaning the buyback thesis is contingent, not current.
The four critical metrics are: the Financial Solutions revenue decline rate moderating from approximately 5-6% toward flat, consolidated Merchant Solutions organic growth tracking Clover TPV, net debt-to-EBITDA progress toward 2.5x, and whether management hits its own quarterly guidance across two or three consecutive periods.
At a 13-15 times earnings multiple on the $12 per share 2029 target, the implied share price would fall in the $150-180 range, but that arithmetic is only as reliable as the probability an investor assigns to the new management team actually delivering on those numbers.


